
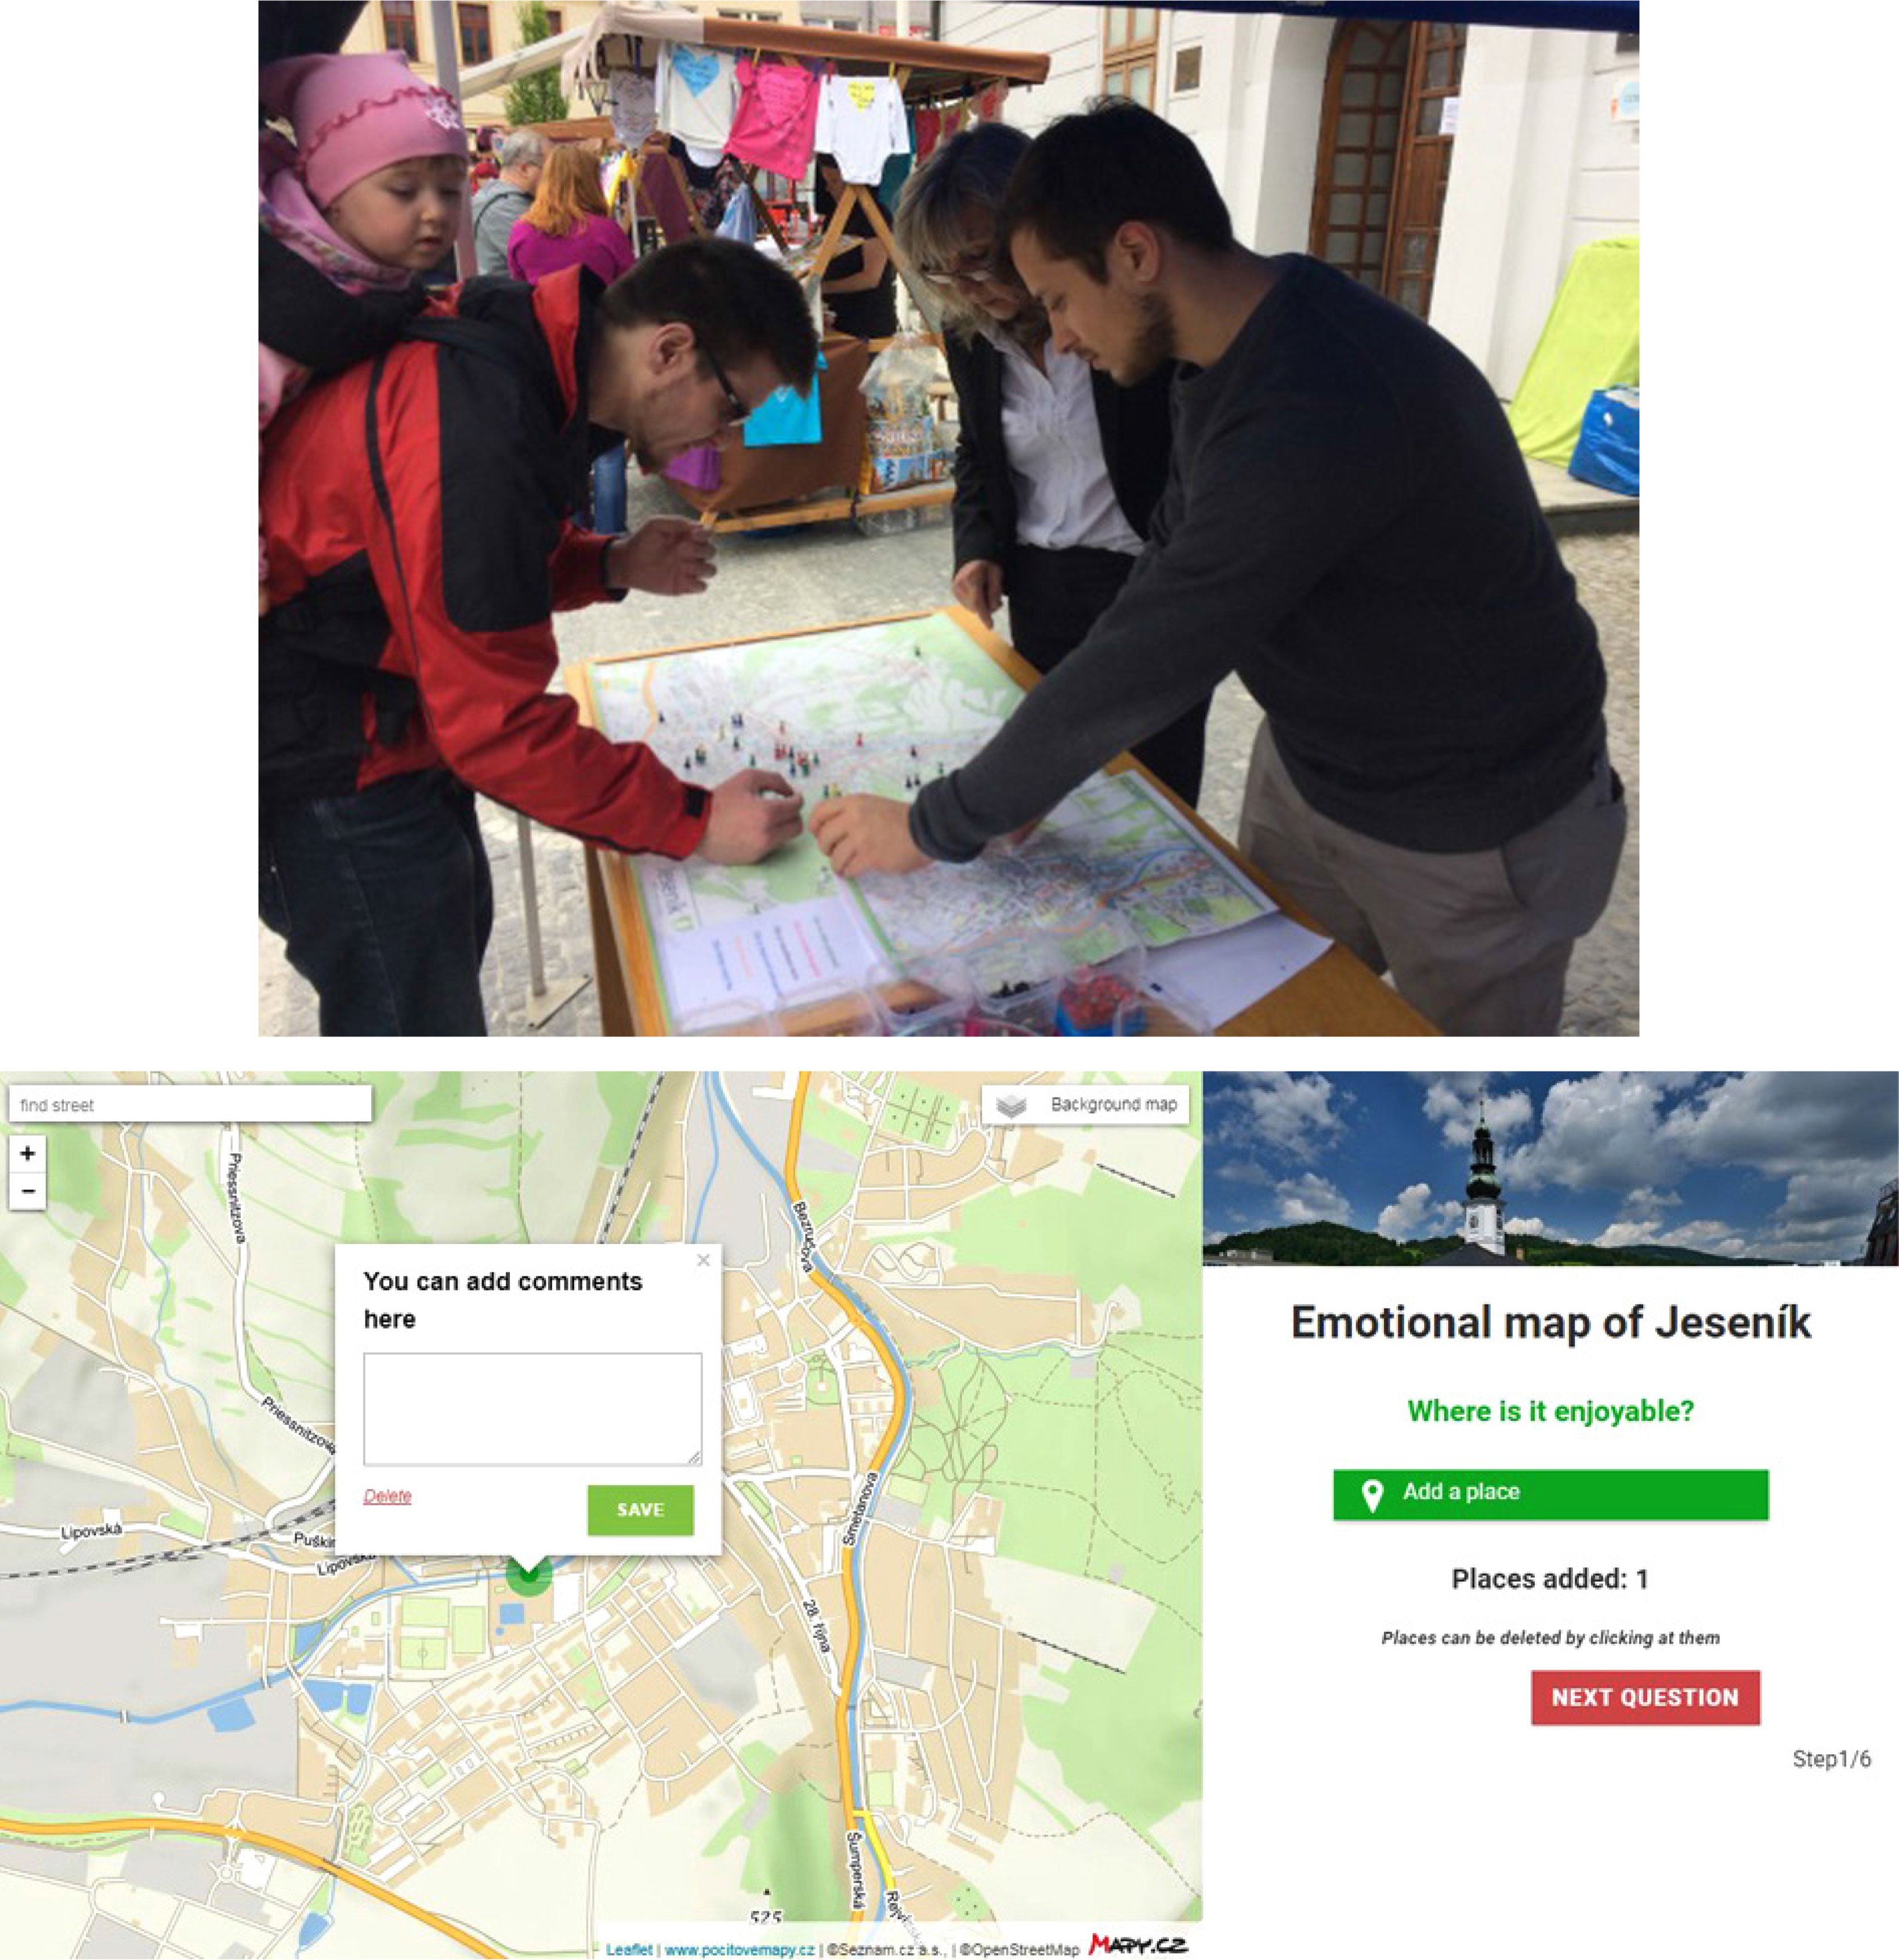
Fig. 1
Analogue mapping during the festival (up) and printscreen of the web-mapping platform (down).
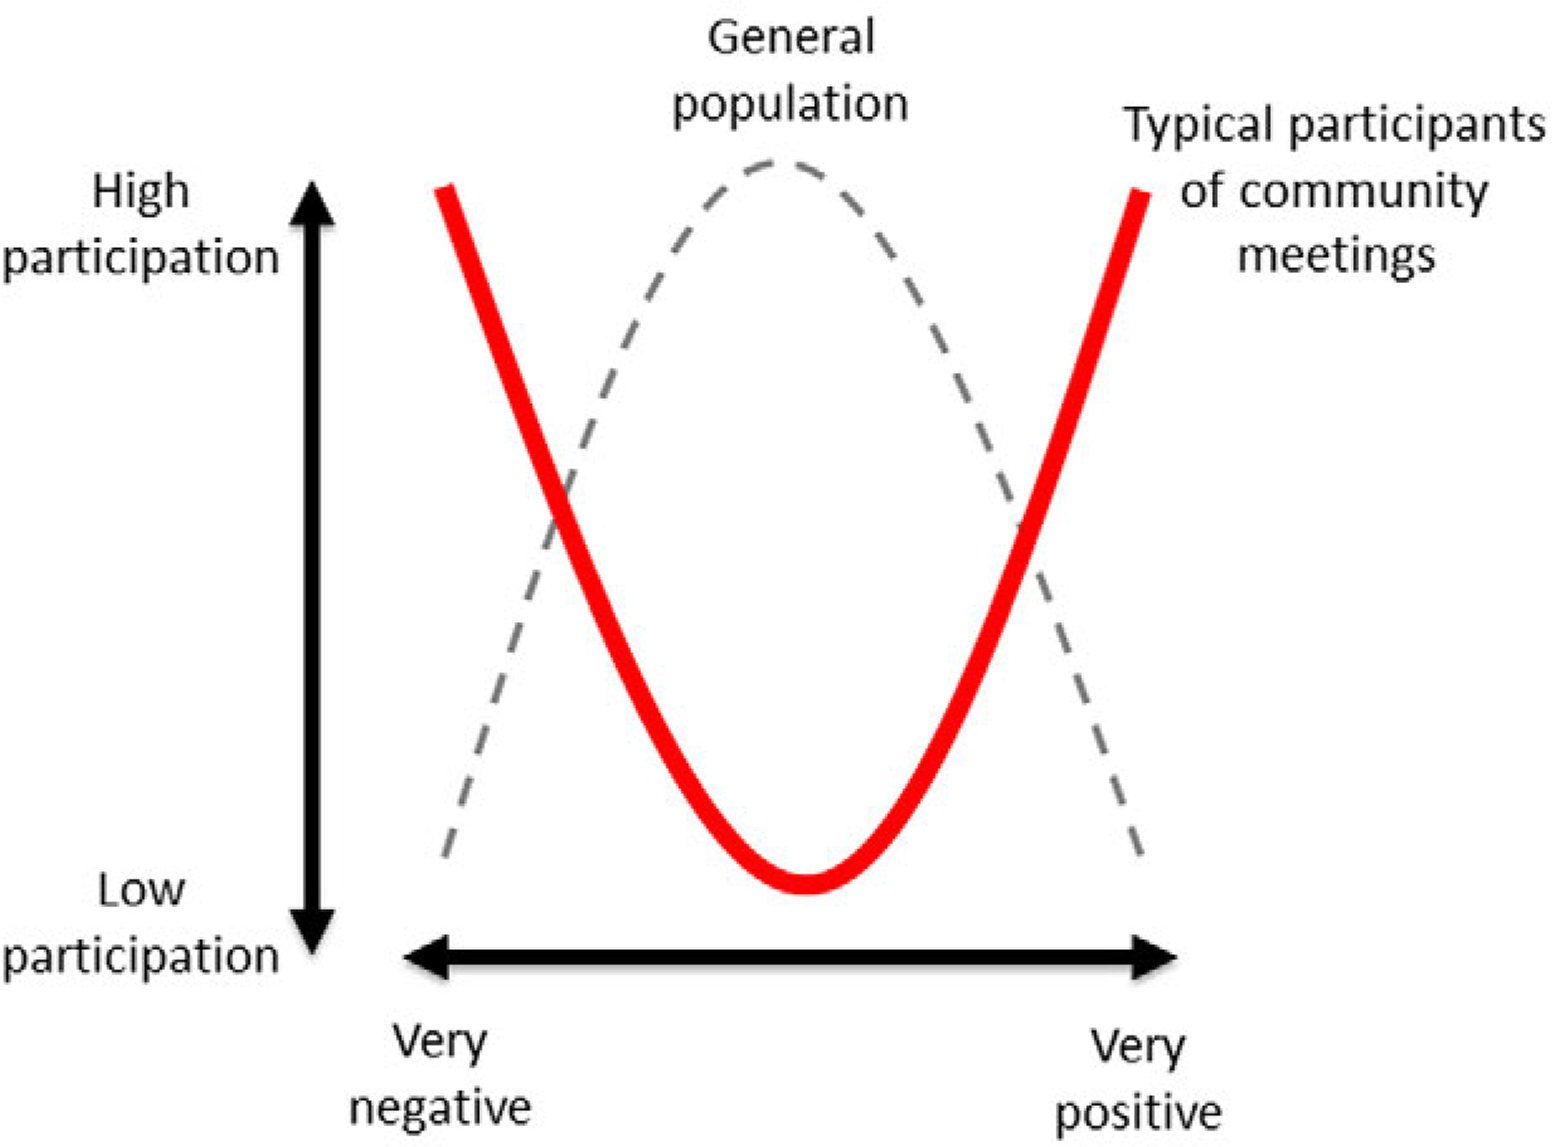
Fig. 2
An author's visualisation of the non-response bias in community affairs surveys.
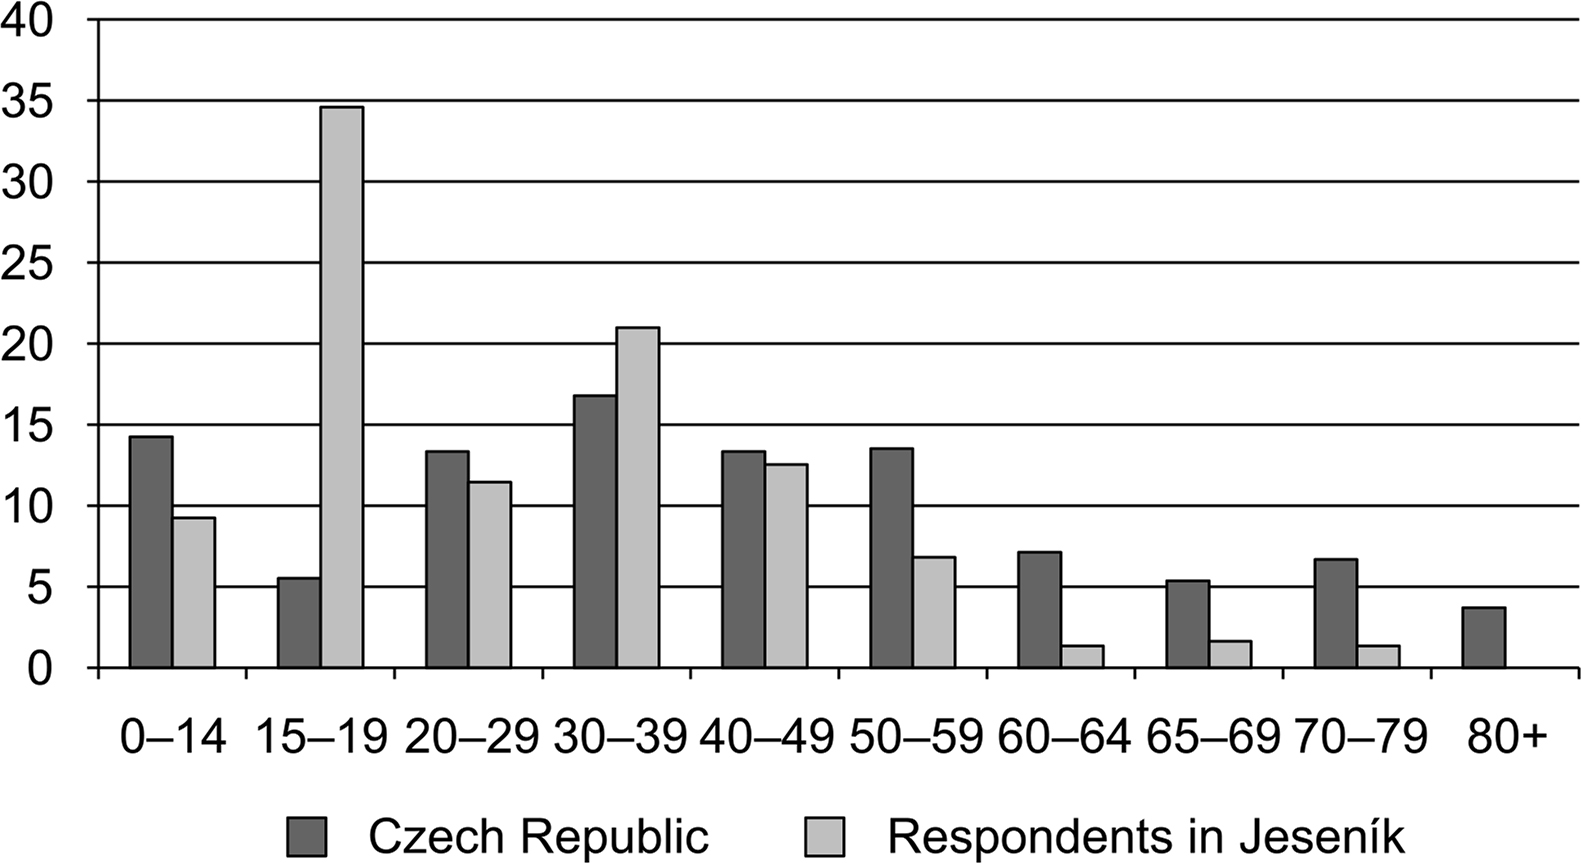
Fig. 3
Age distribution of overall population in the Czech Republic and age distribution of respondents in Jeseník. Data by Czech Statistical Office (2017).
Table 1
Basic statistics from the participatory mapping results.
| Parameter | Where is it enjoyable? | Where is it dangerous? | Where is it deprived? | Where is a place with dangerous traffic? | Where do you miss something? | Where do you spend your free time? | Total |
|---|---|---|---|---|---|---|---|
| Total number of points | 1,063 | 784 | 733 | 688 | 576 | 870 | 4,714 |
| Points from web map | 978 | 742 | 689 | 648 | 545 | 850 | 4,452 |
| Points from paper map | 85 | 42 | 44 | 40 | 31 | 20 | 262 |
| Number of comments | 308 | 275 | 244 | 233 | 310 | 168 | 1,538 |
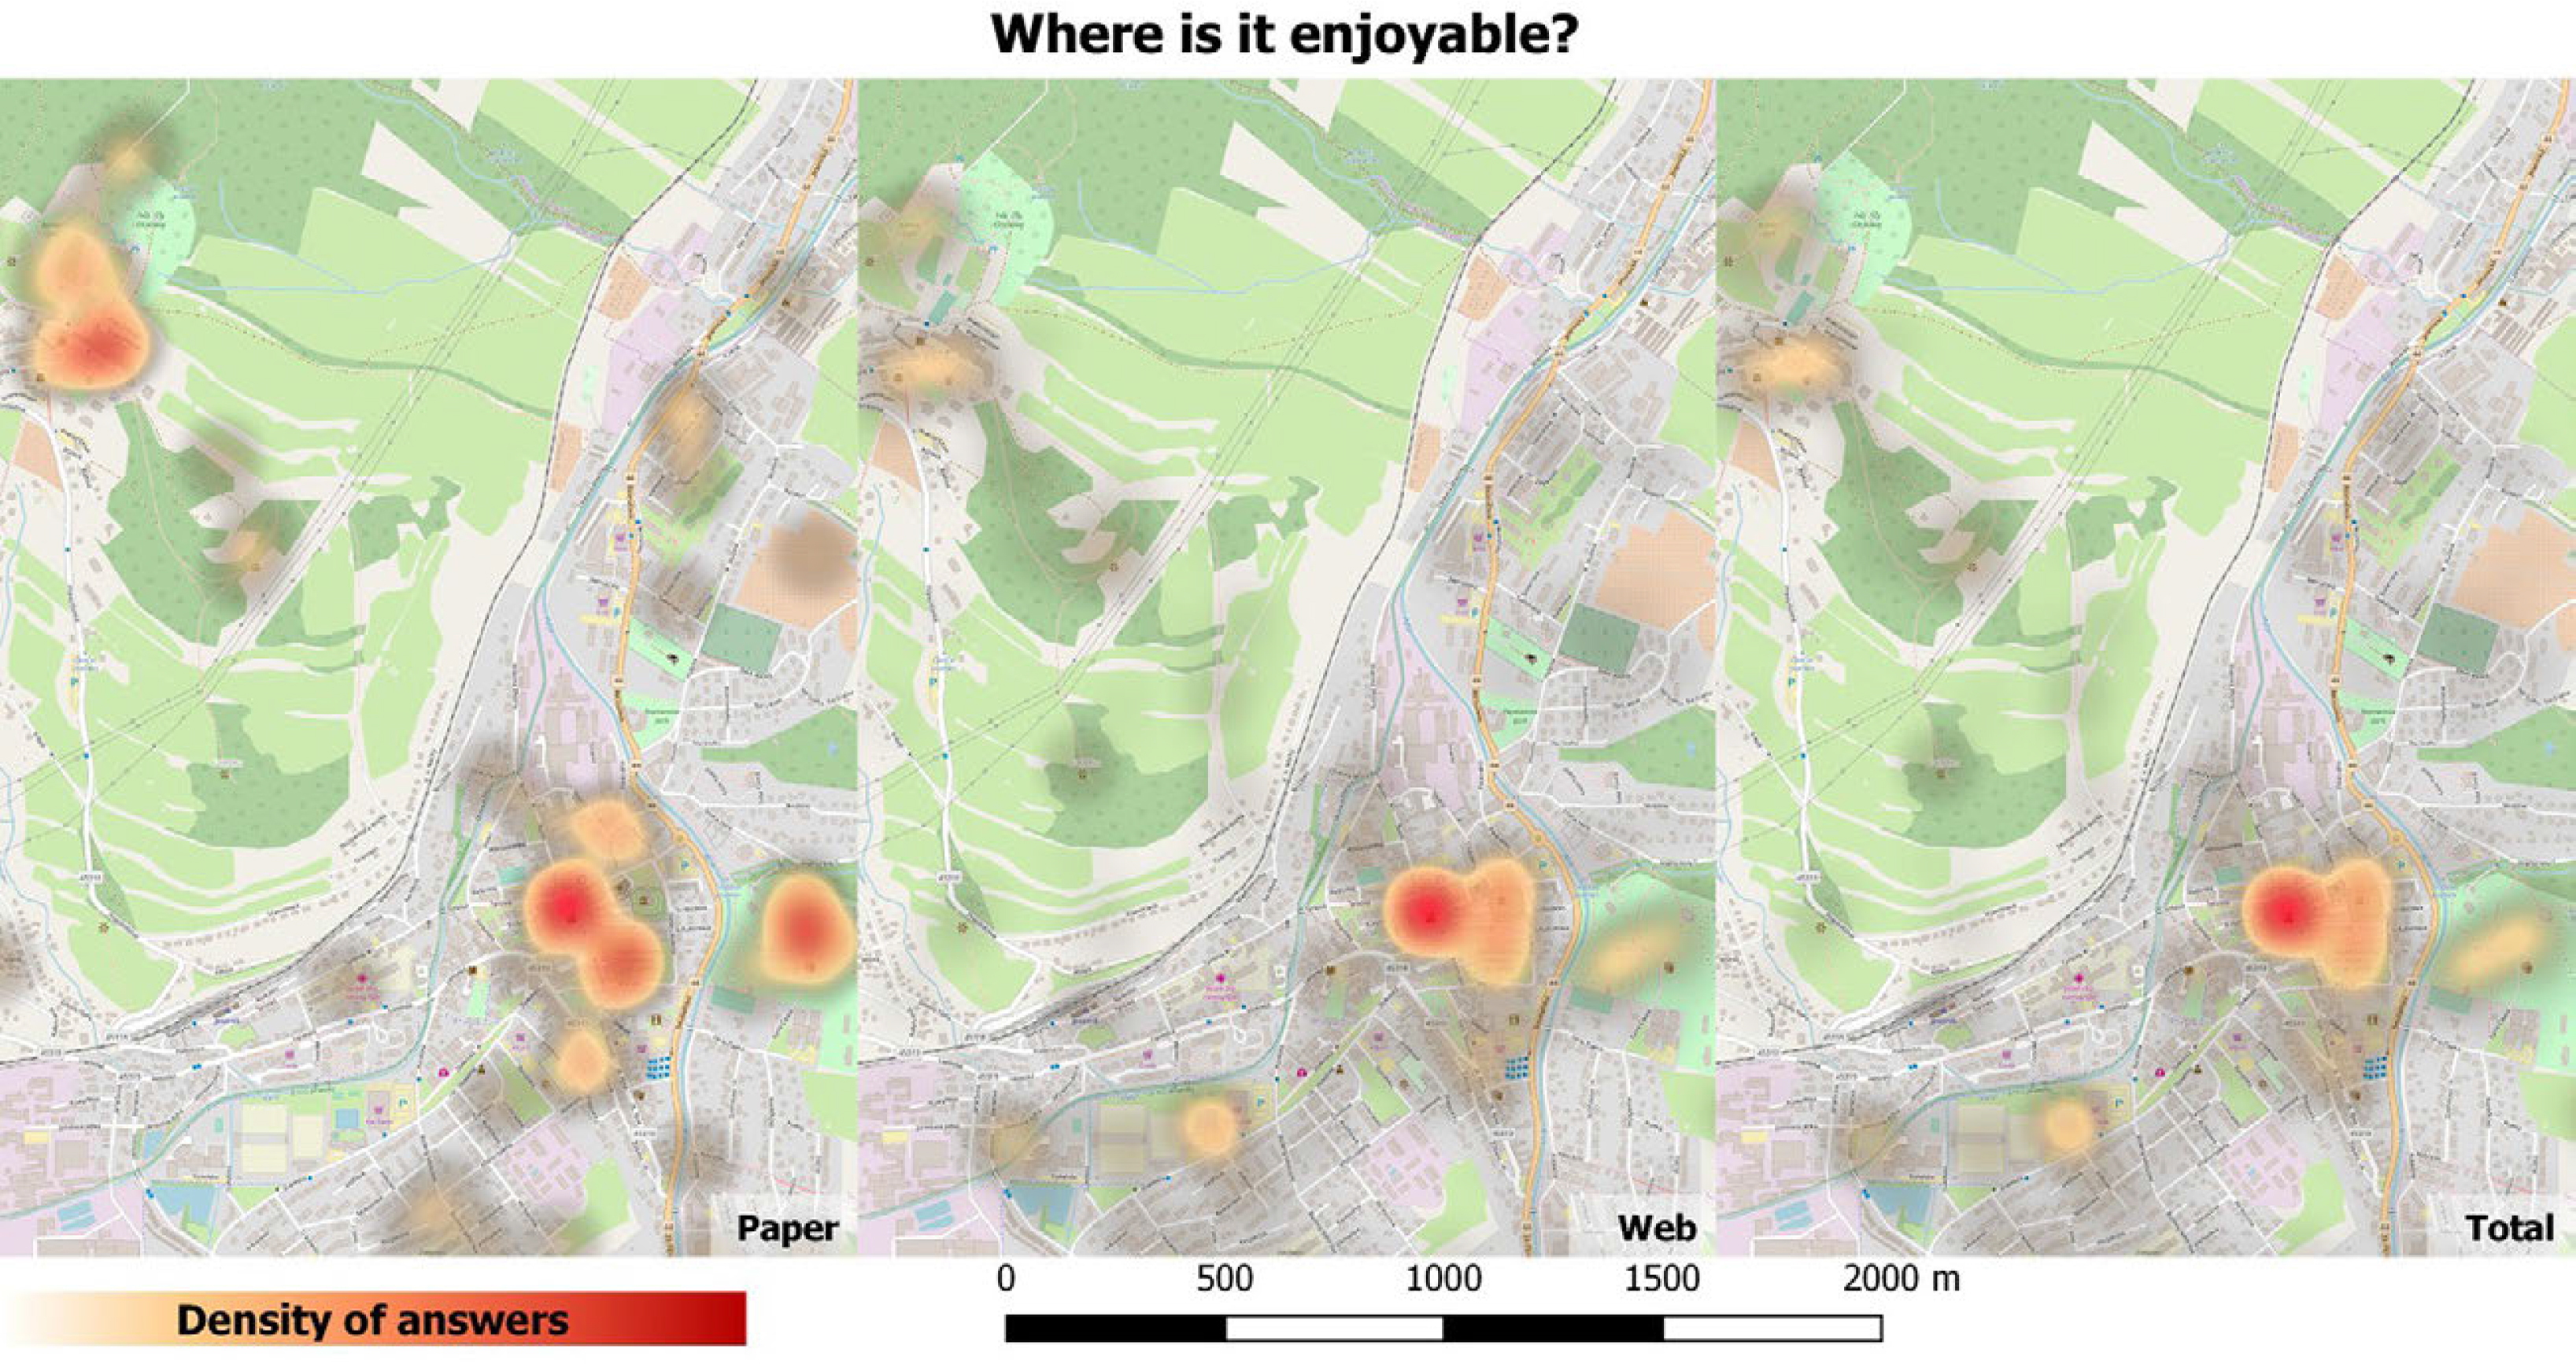
Fig. 4
Where do respondents think it is enjoyable in Jeseník?
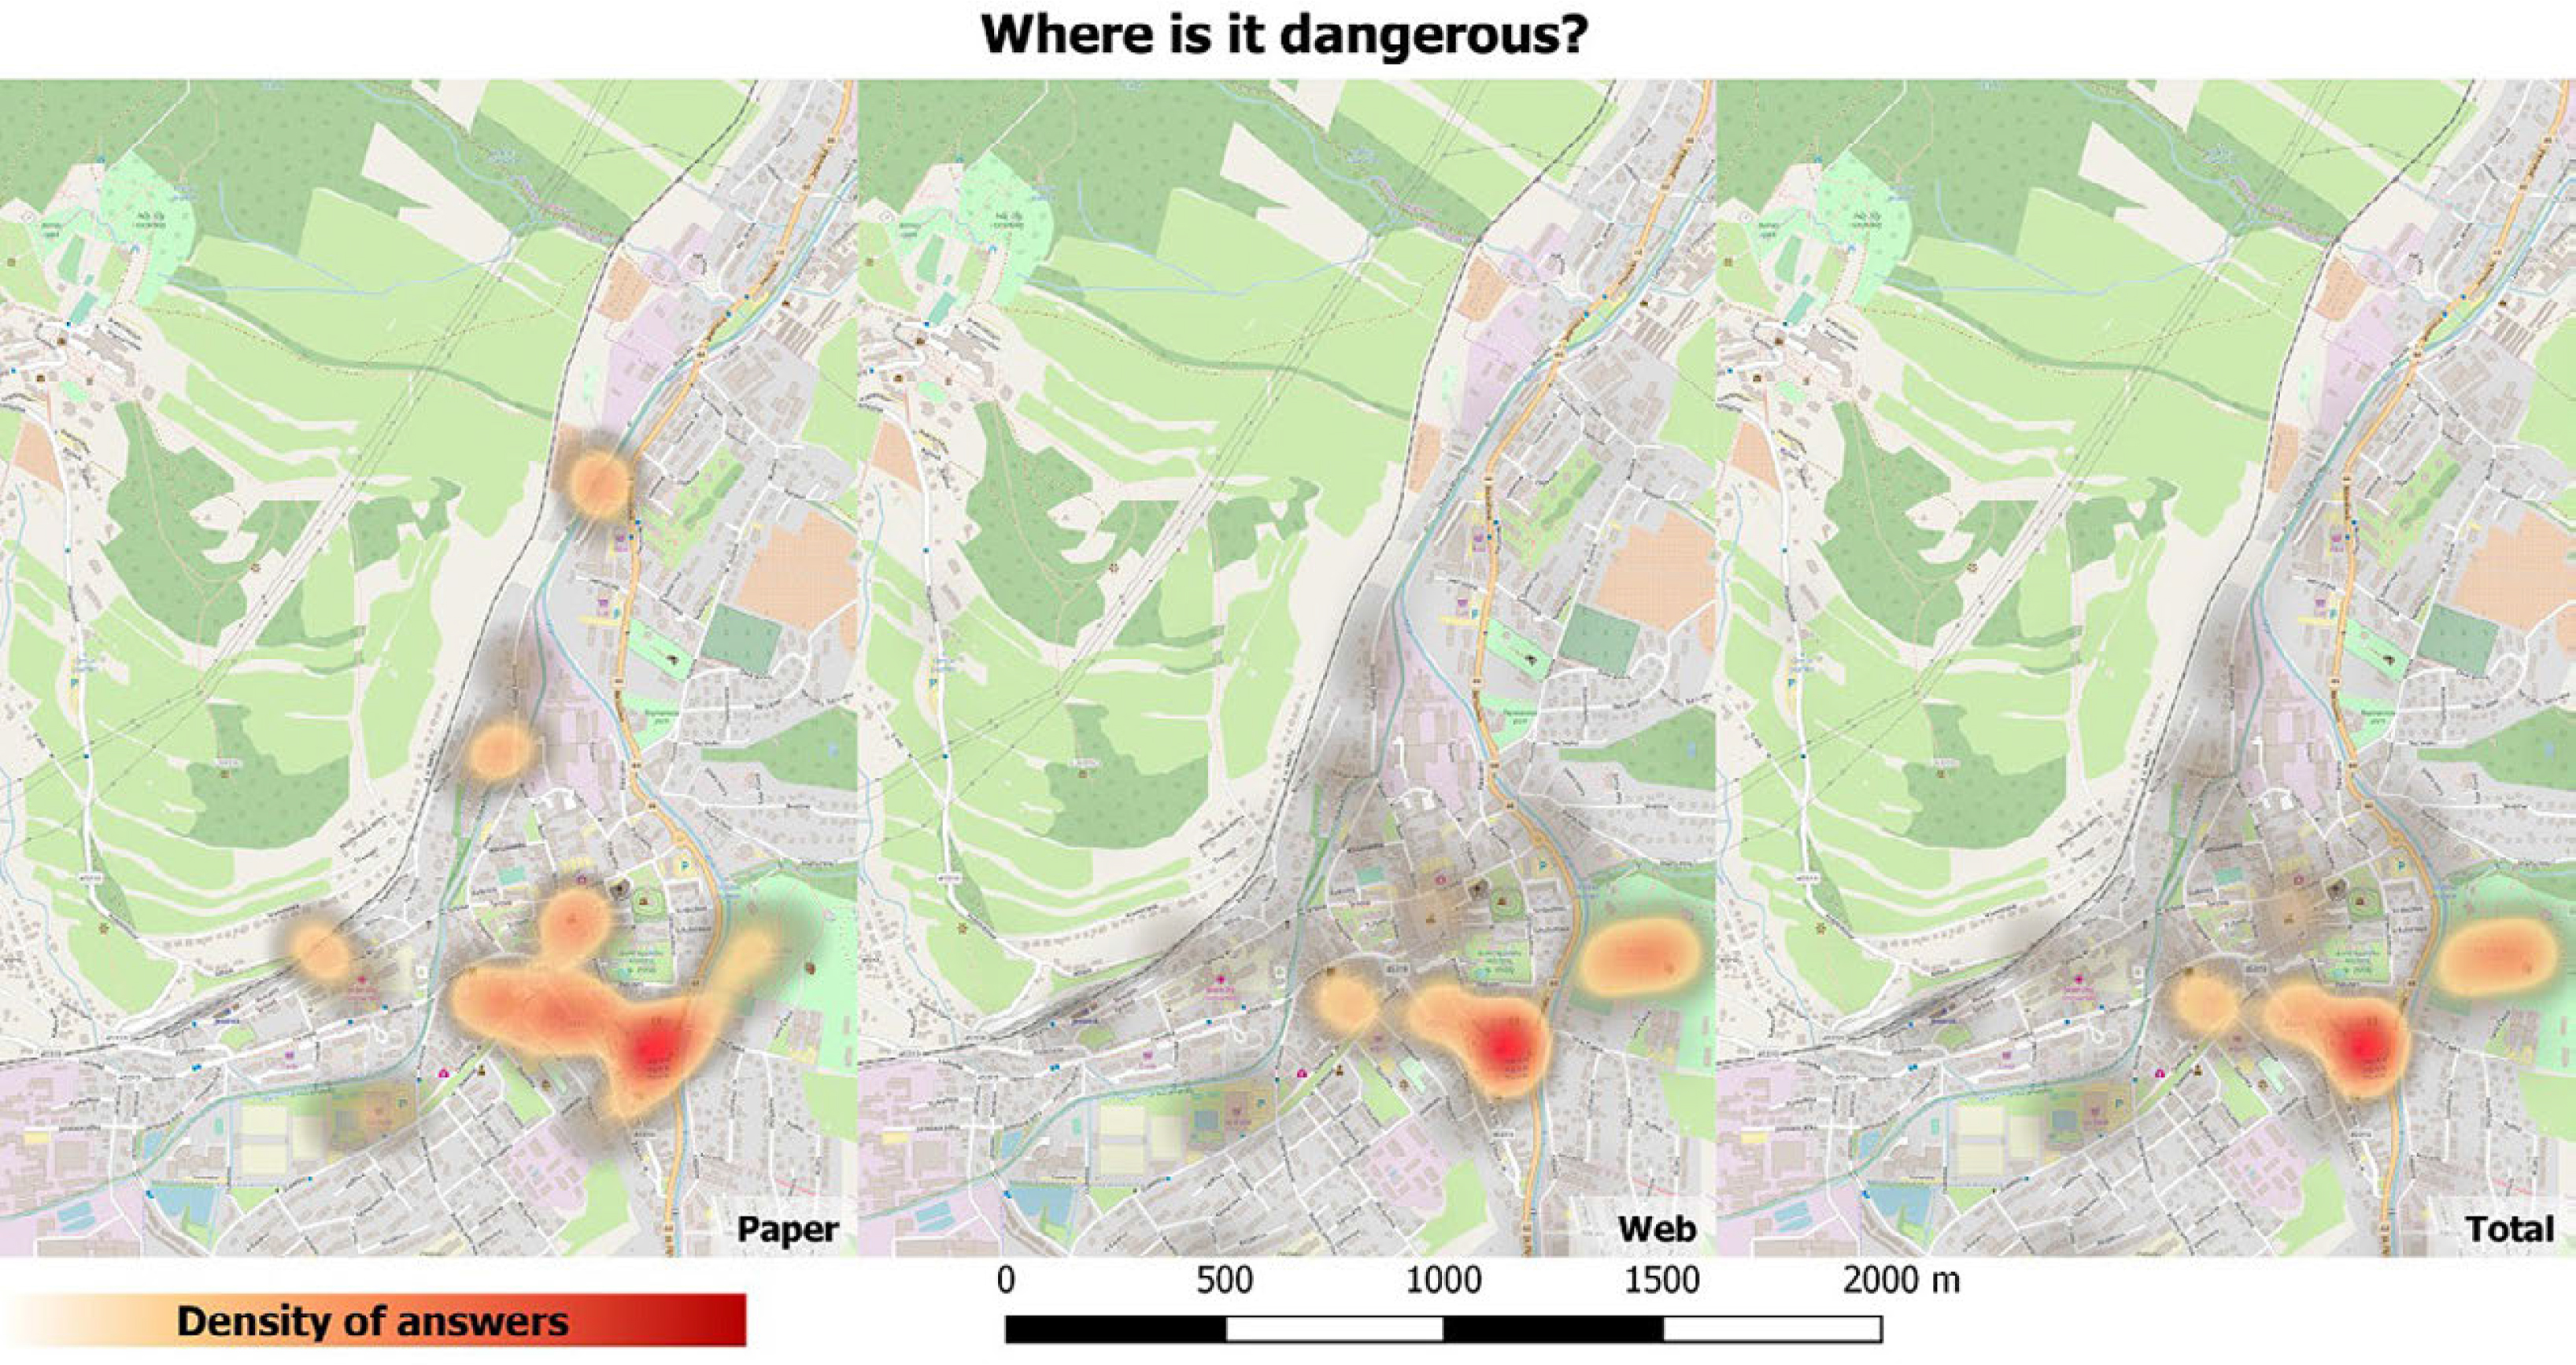
Fig. 5
Where do respondents think it is dangerous in Jeseník?
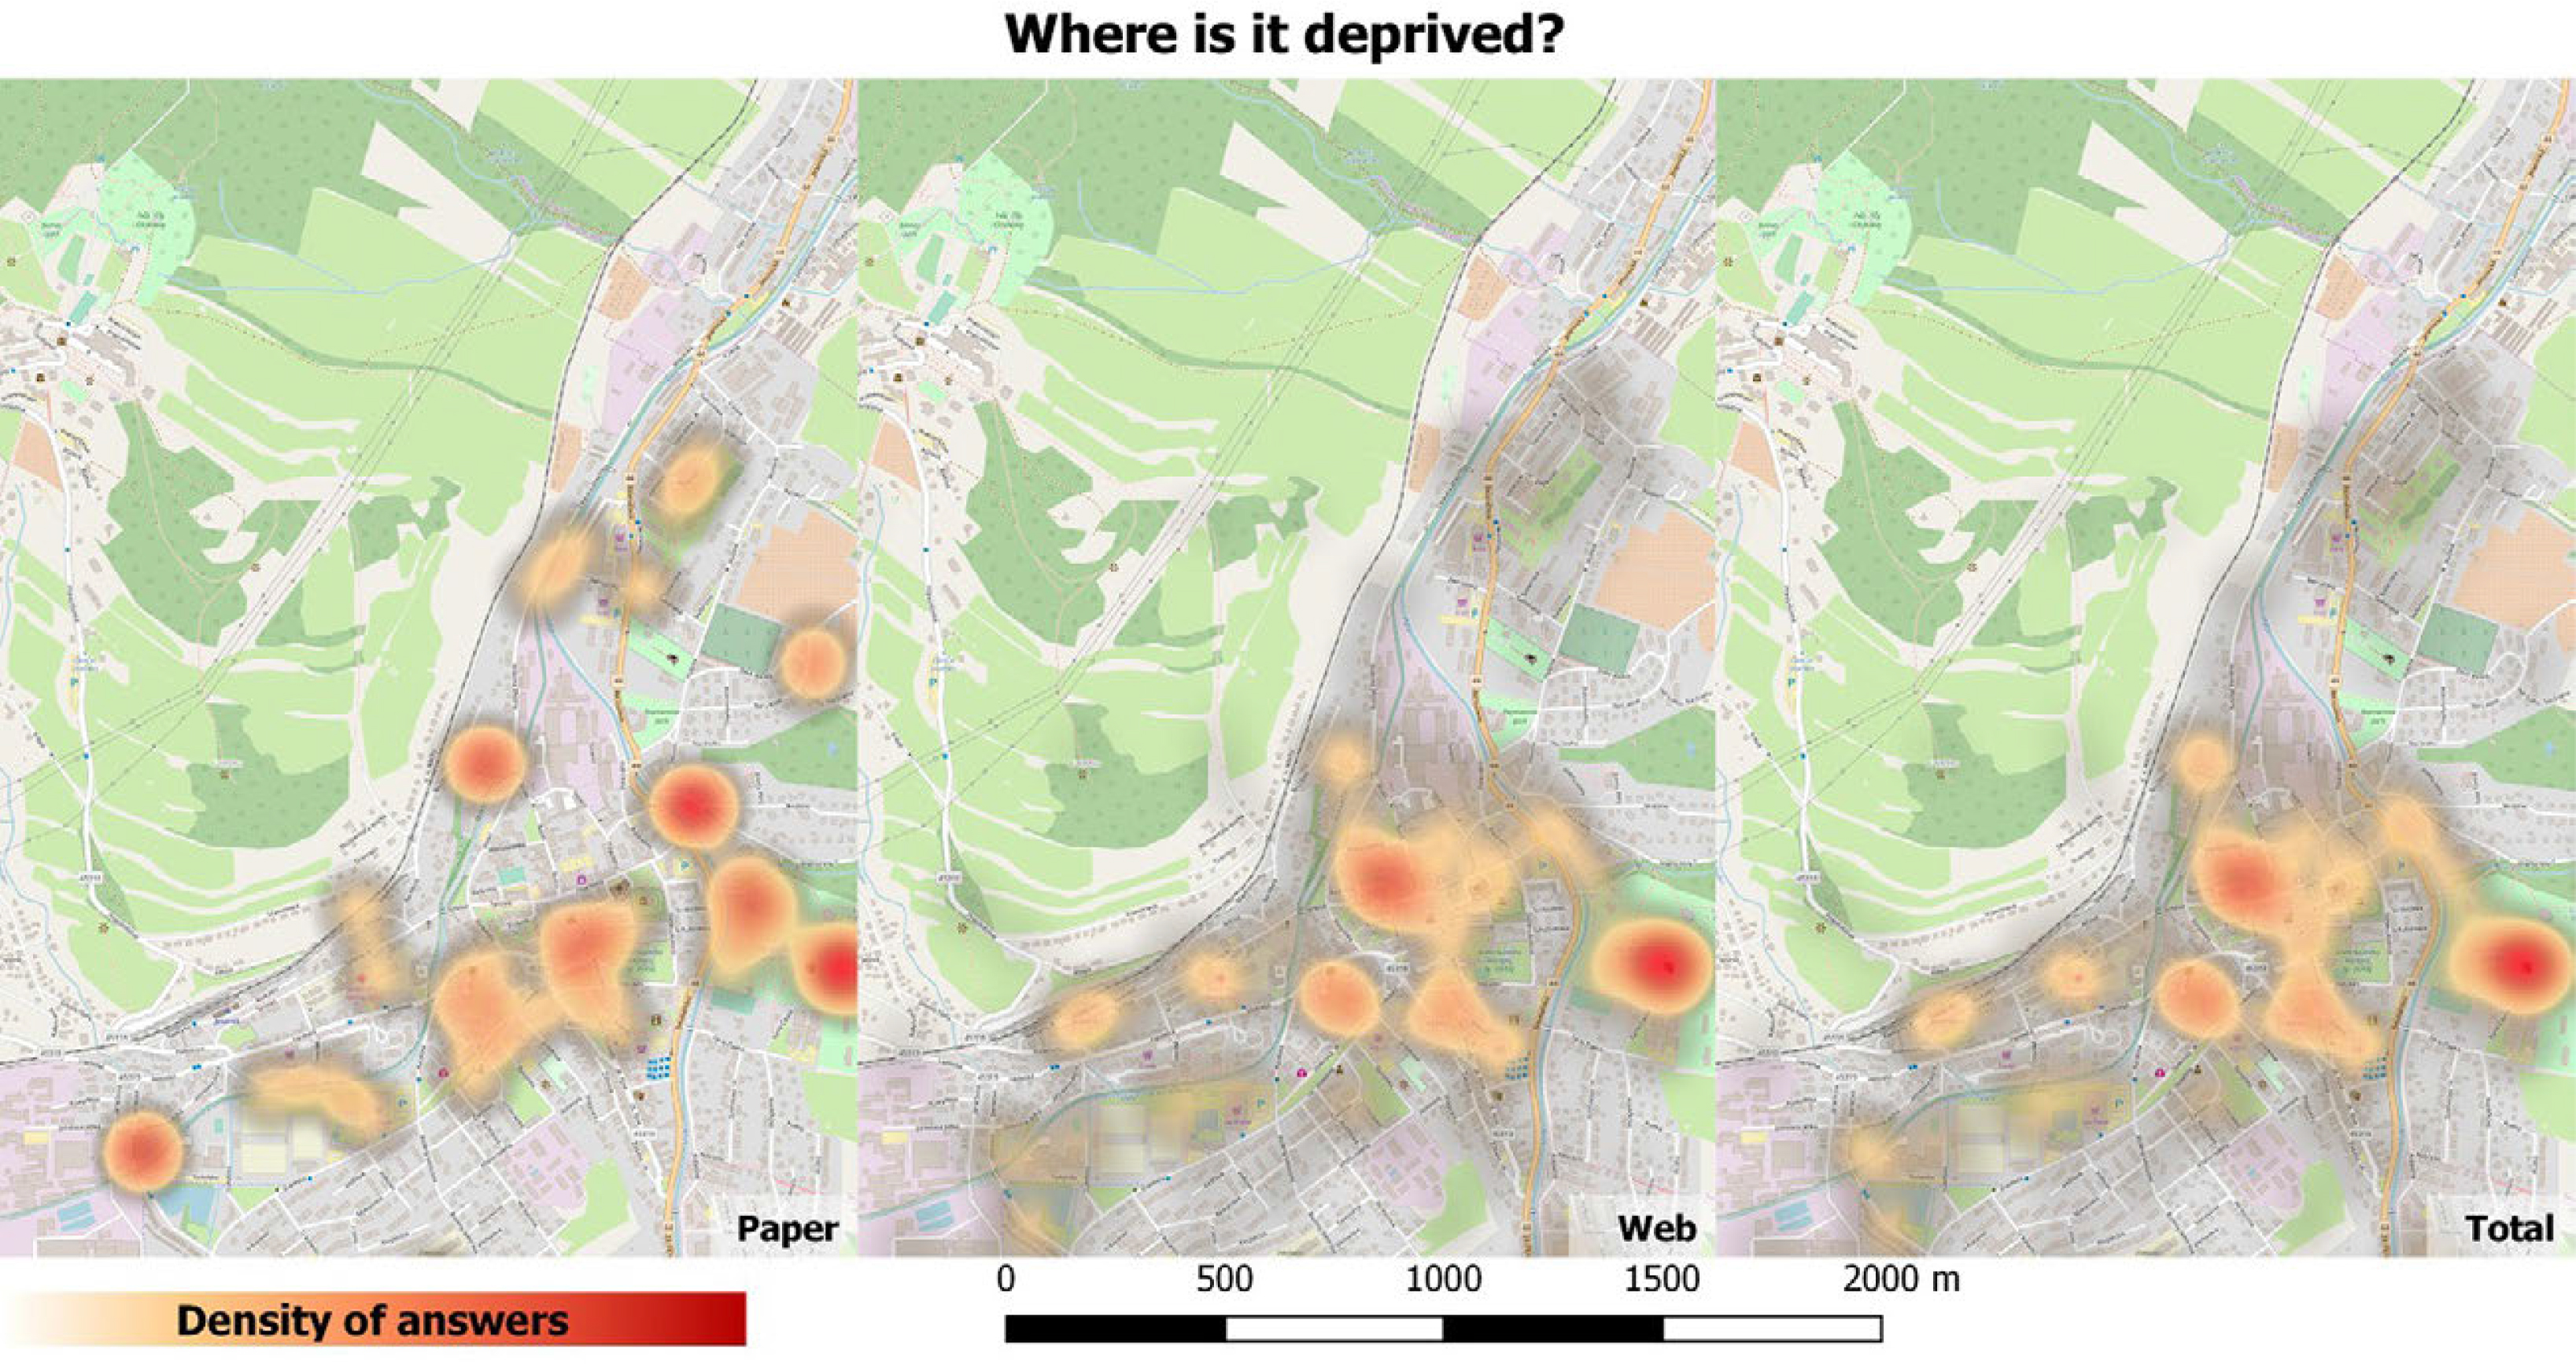
Fig. 6
Where do respondents think it is deprived in Jeseník?
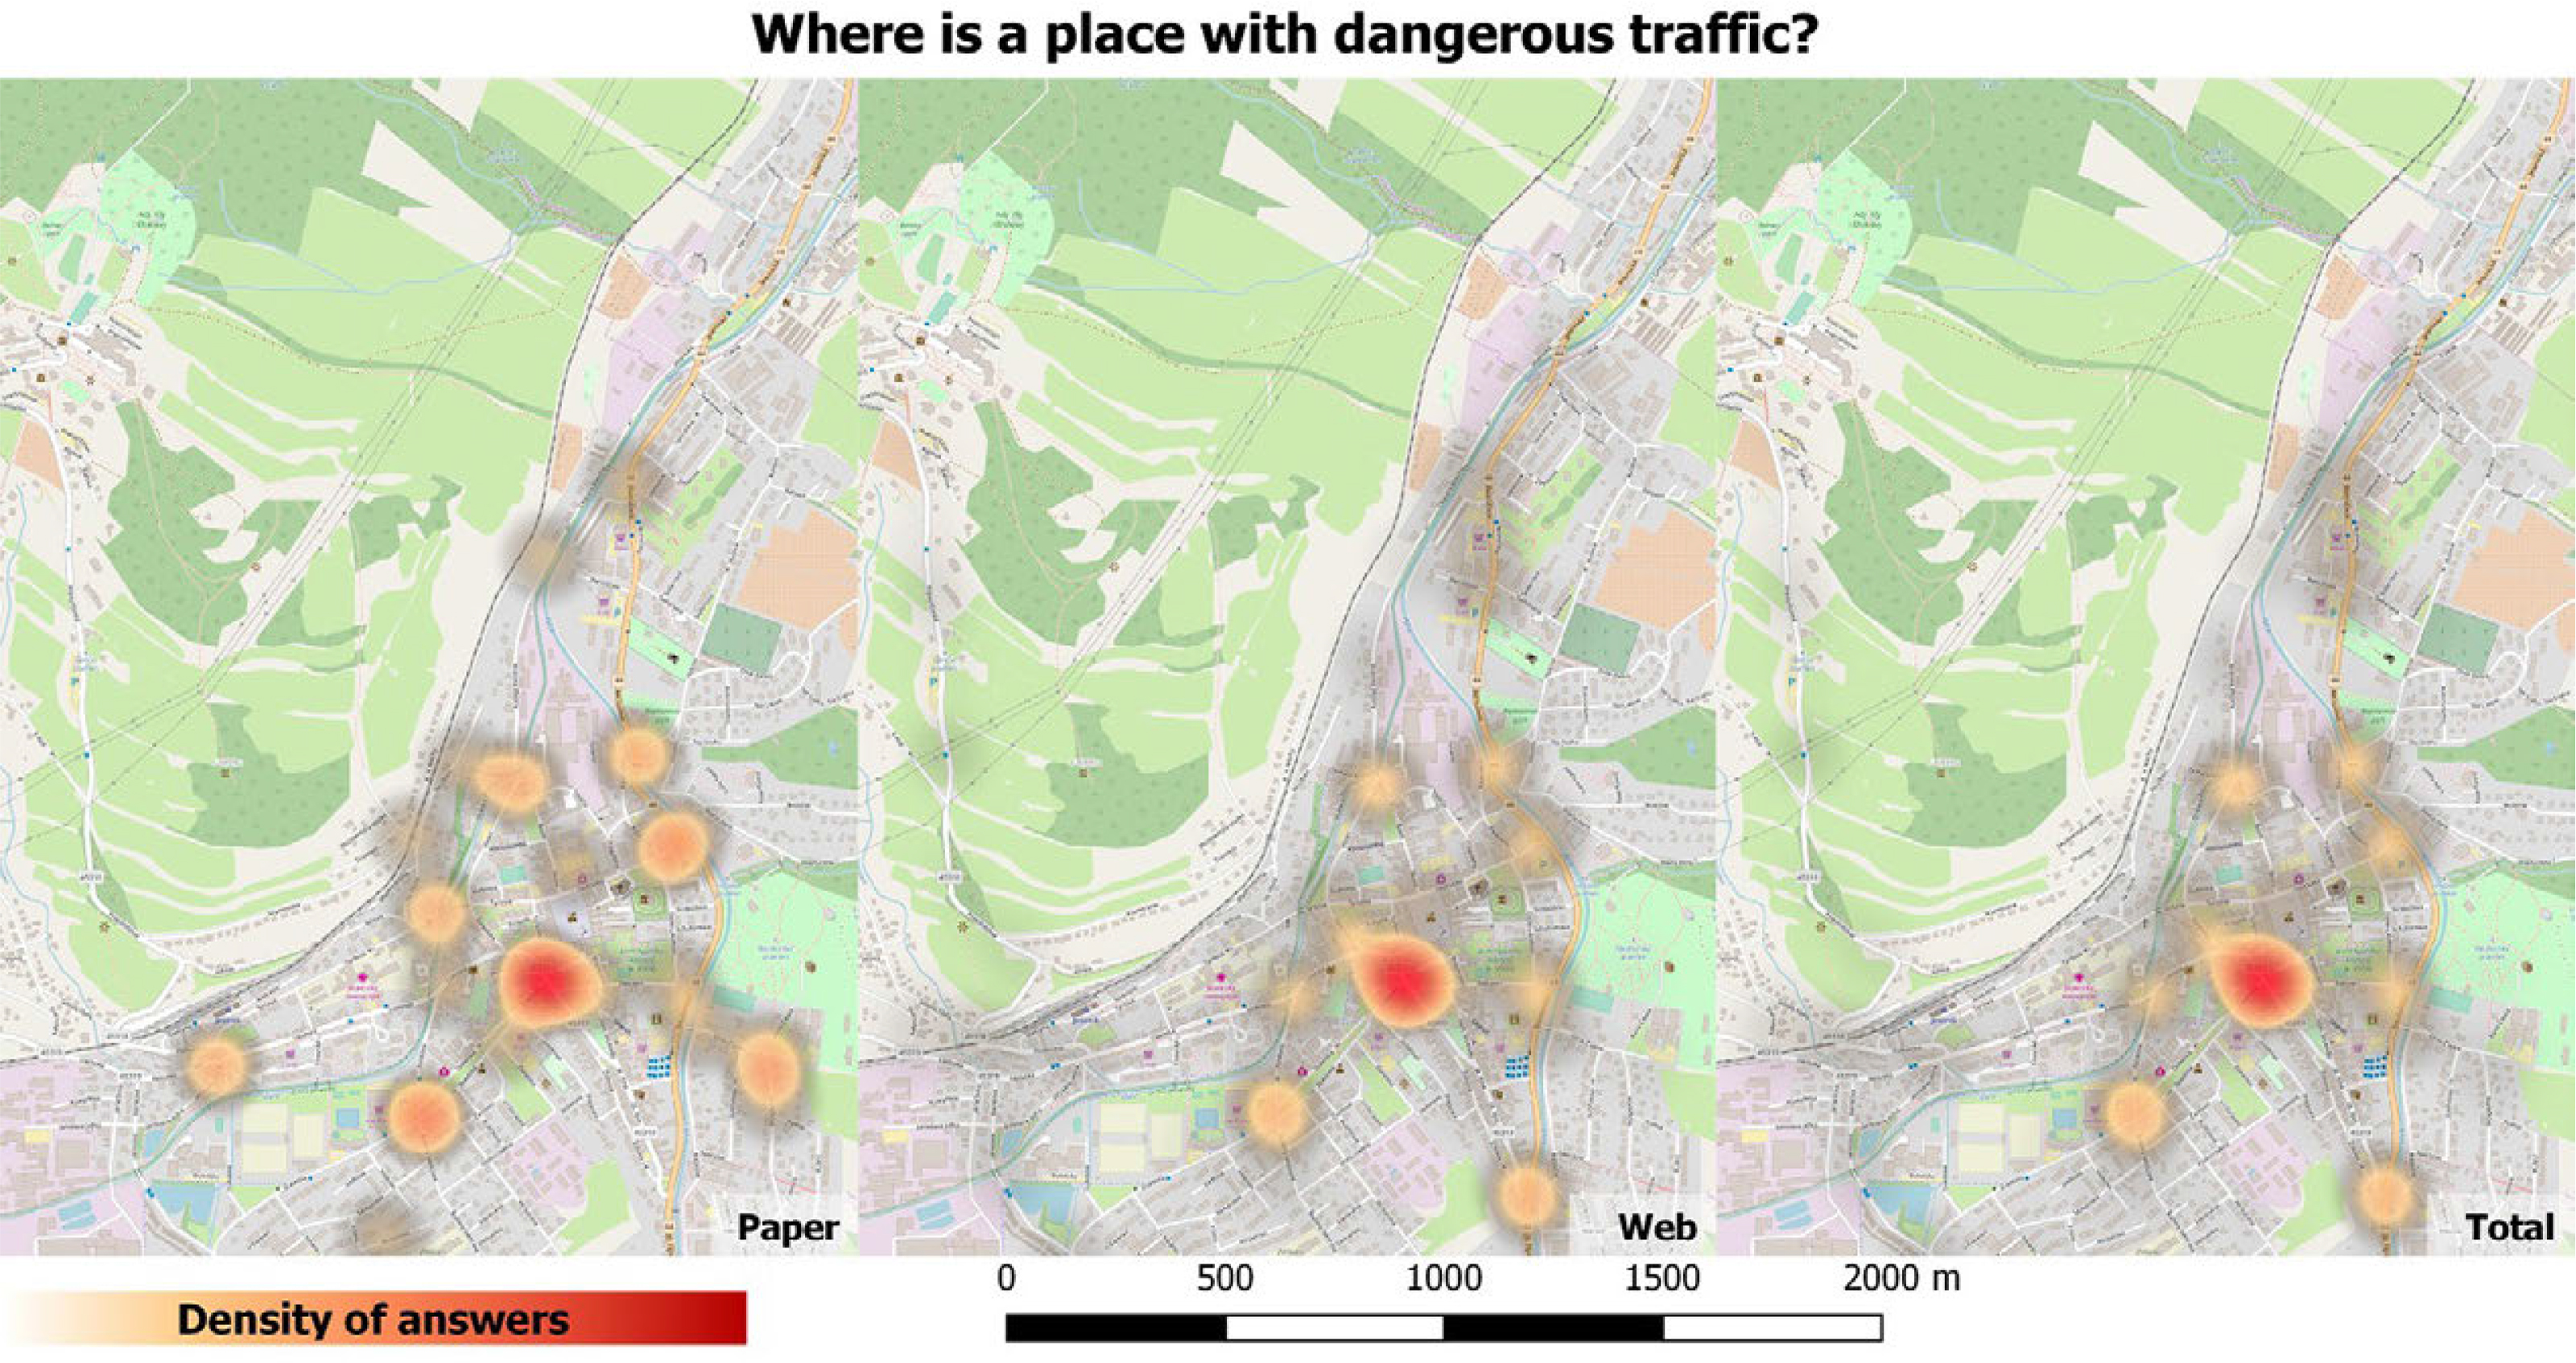
Fig. 7
Where do respondents think it is dangerous, traffic-wise, in Jeseník?
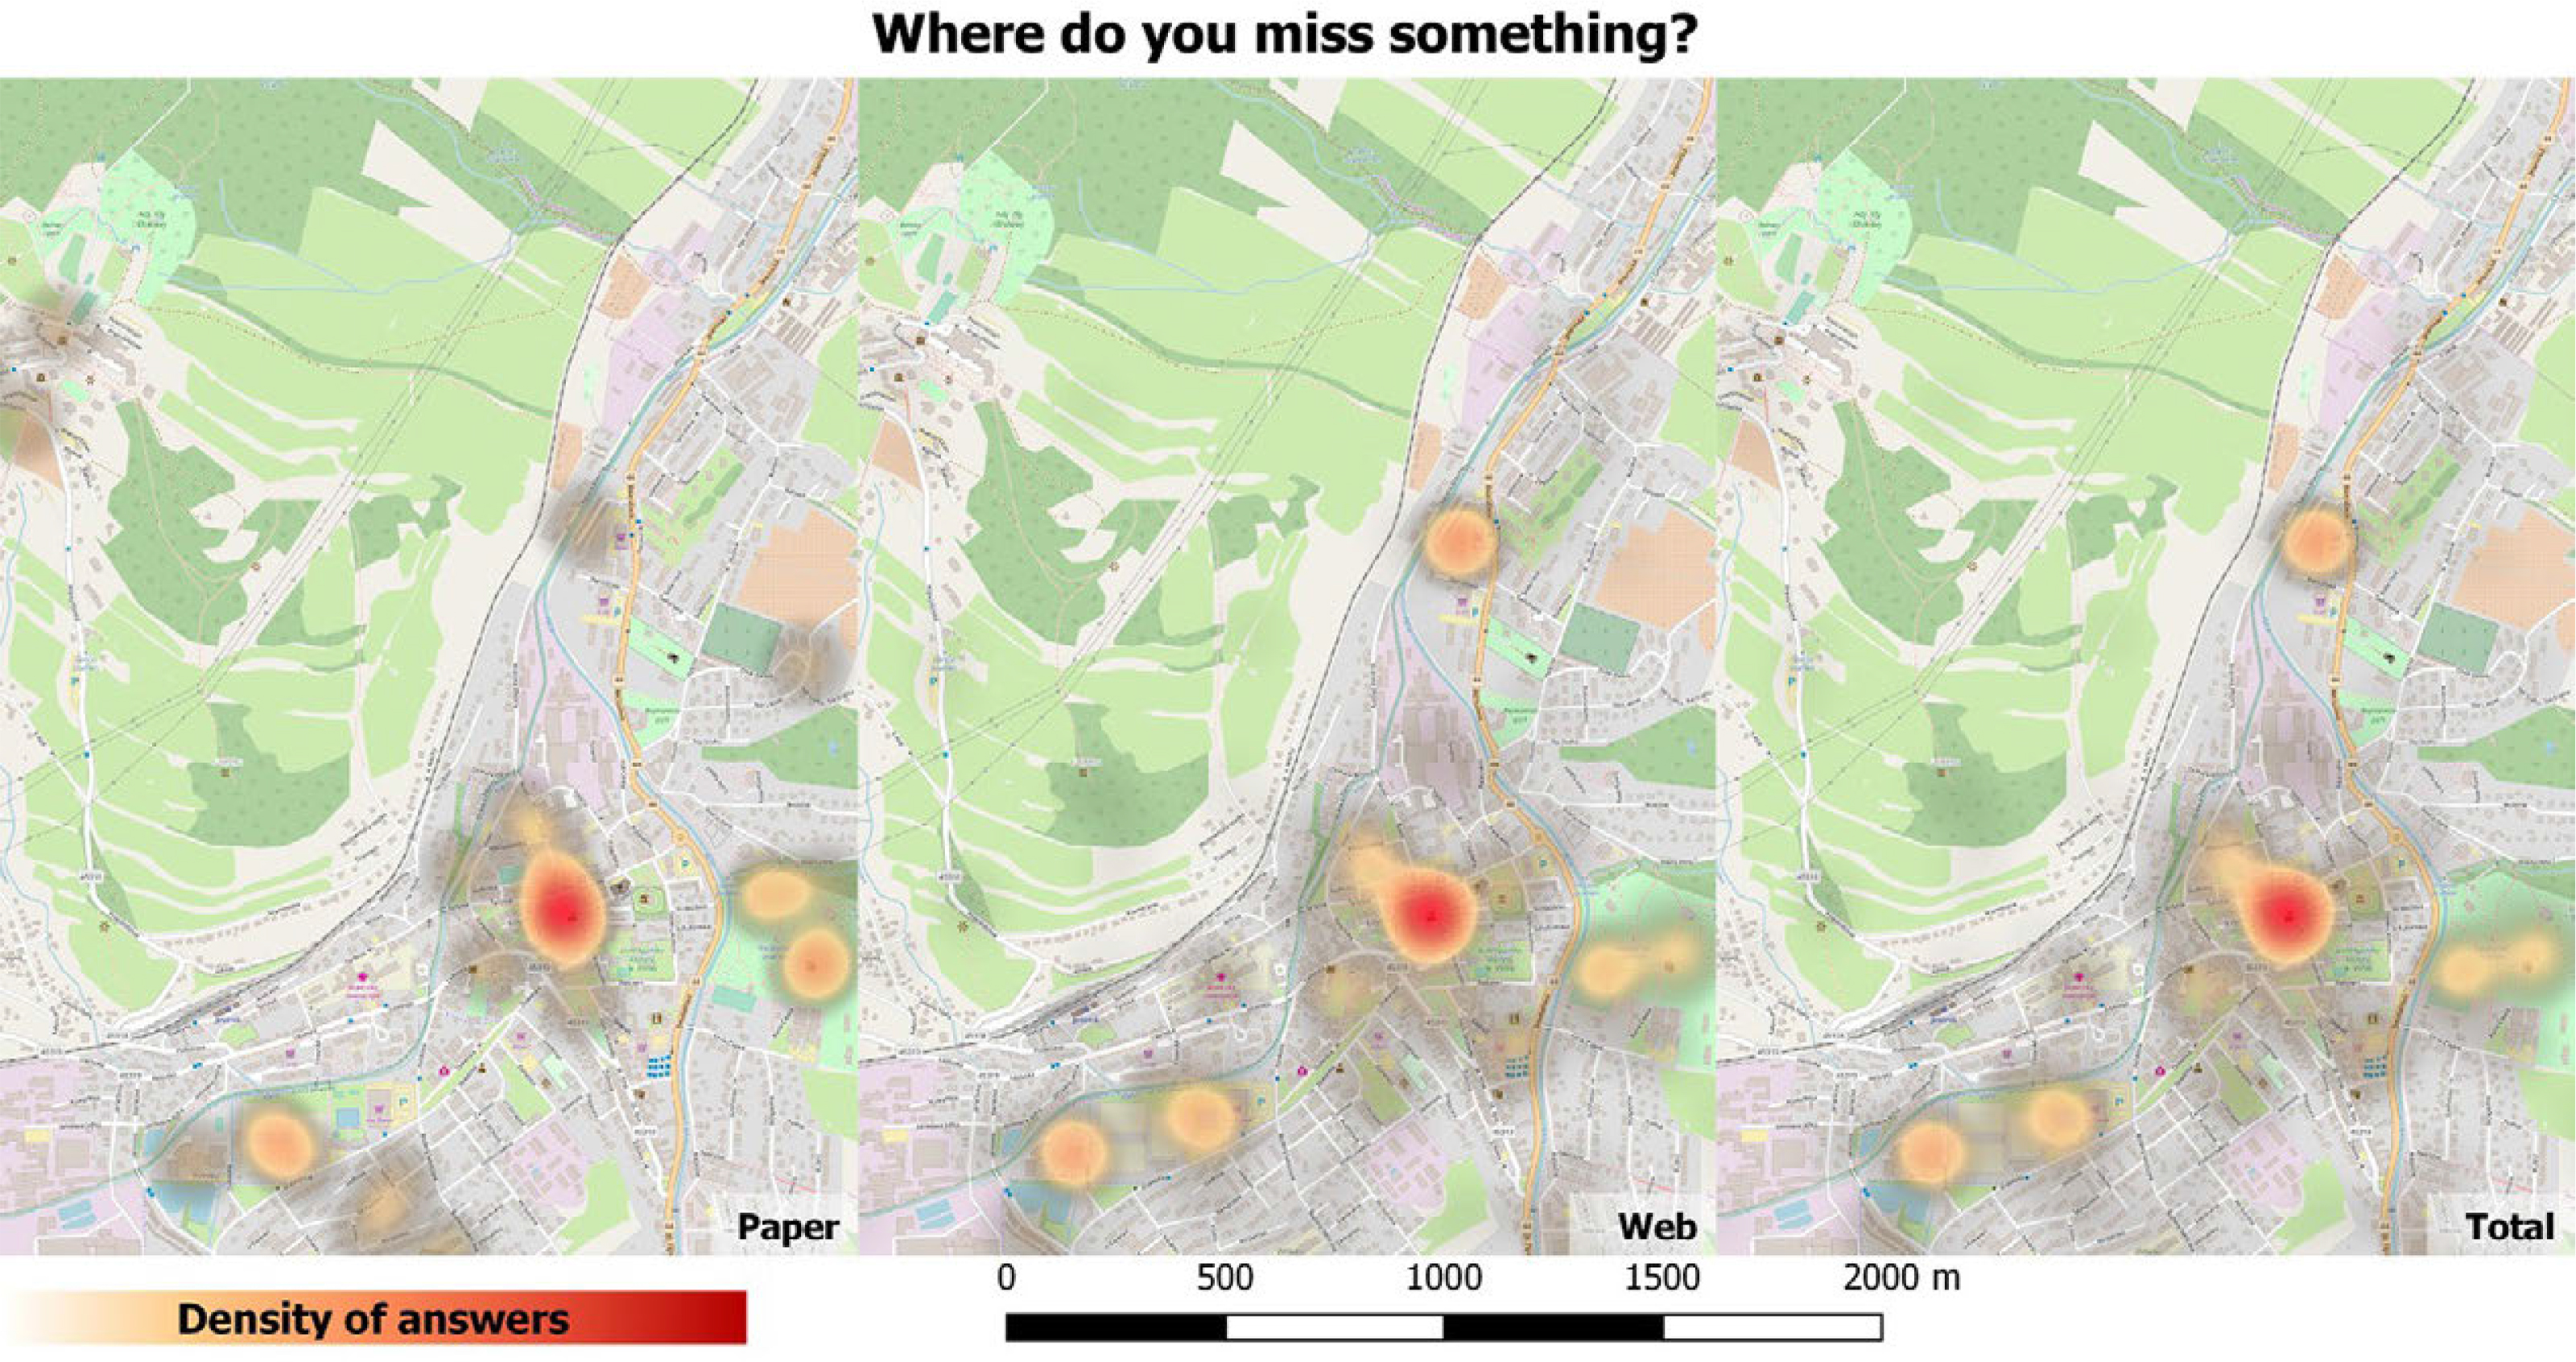
Fig. 8
Where do respondents miss something in Jeseník?
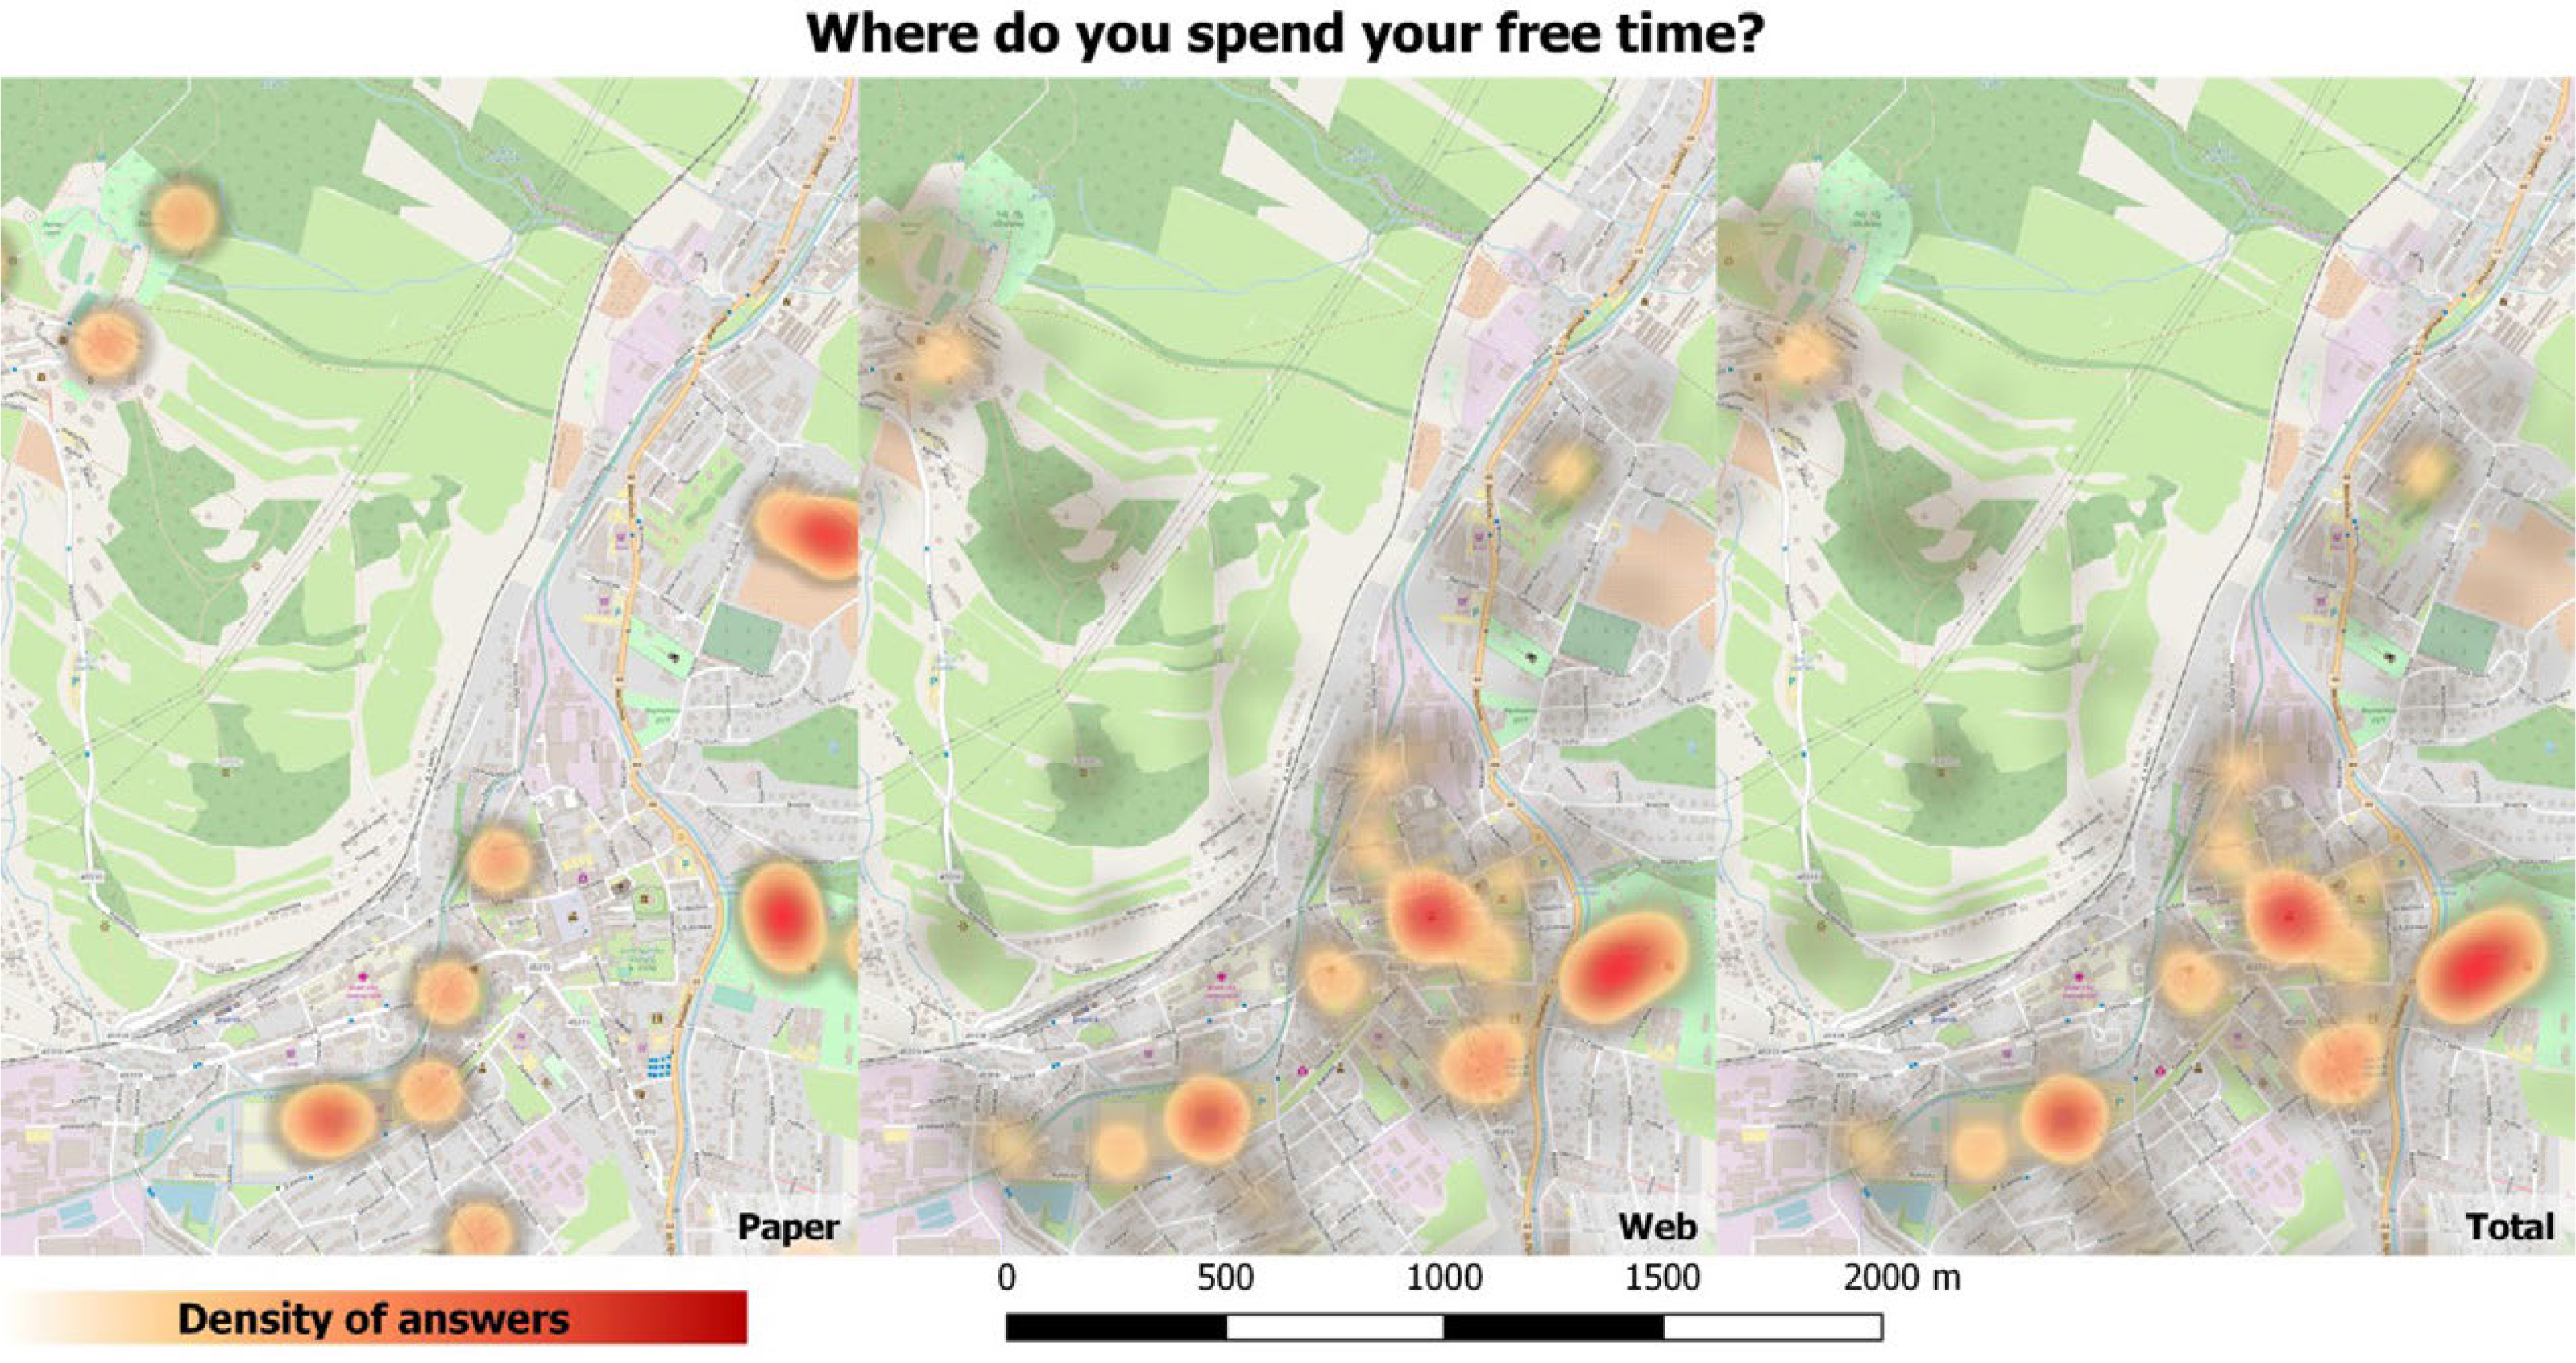
Fig. 9
Where do respondents spend their free time in Jeseník?
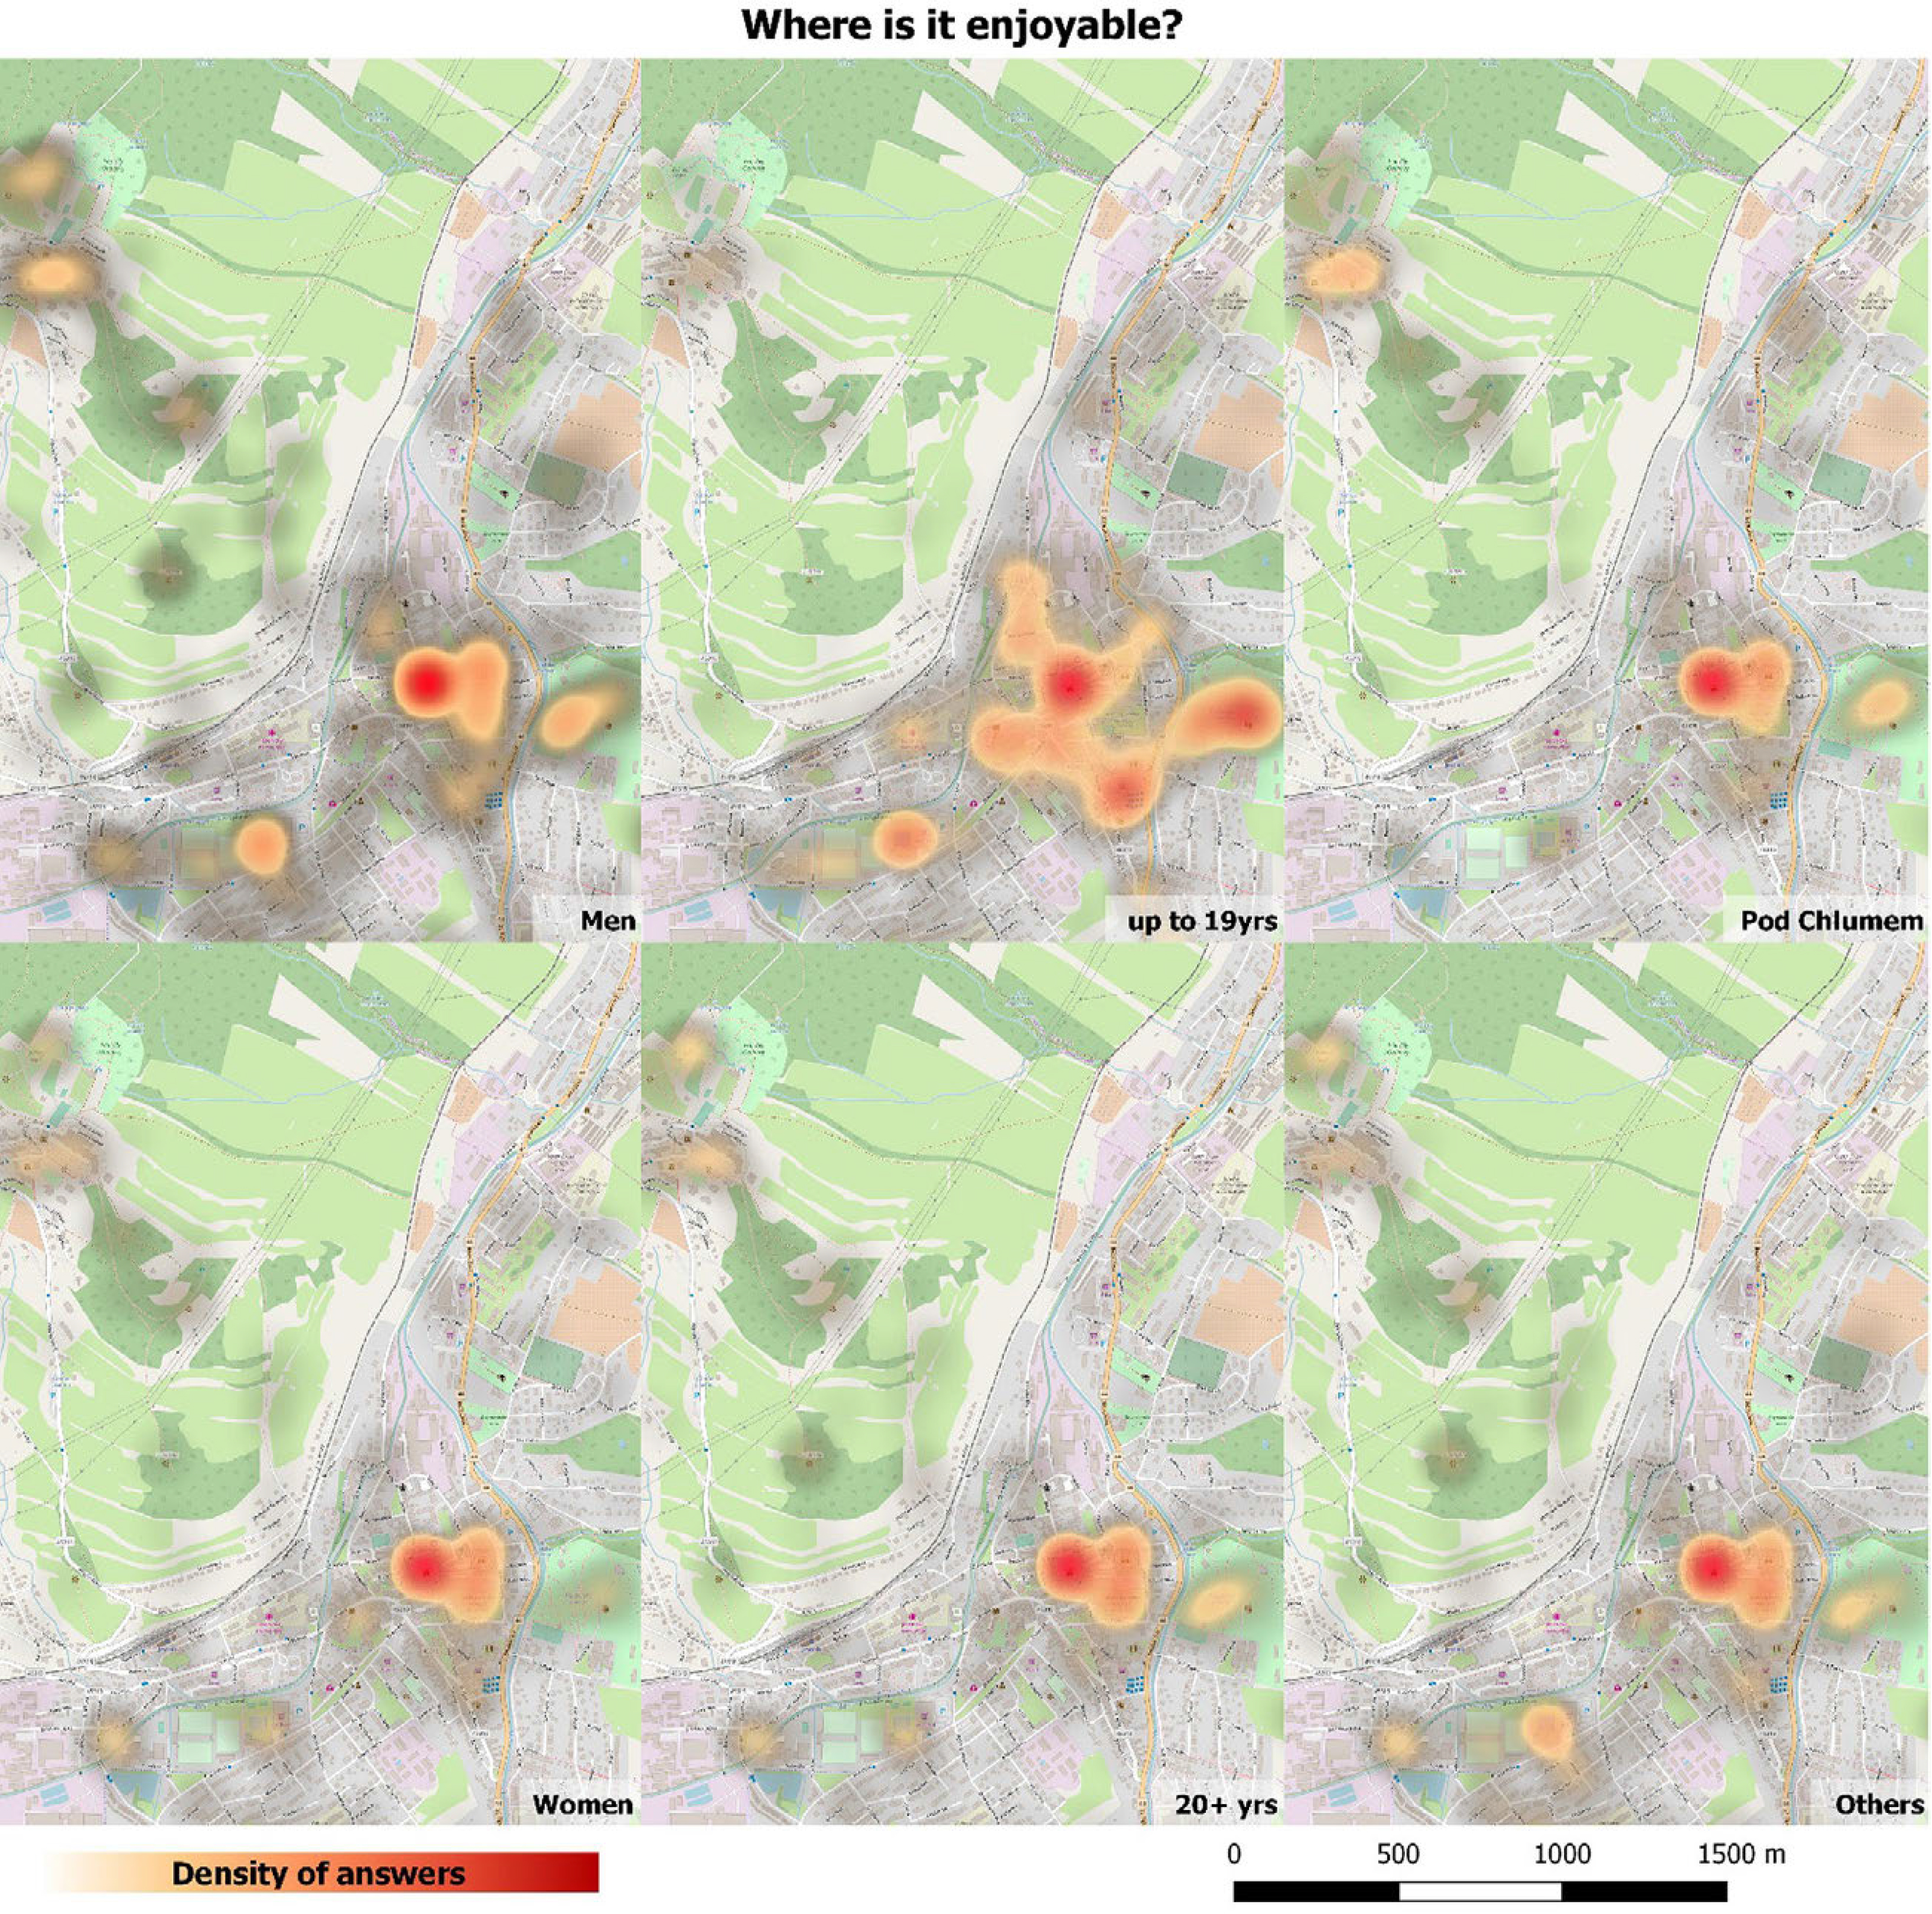
Fig. 10
Differences among selected groups' answers to the question Where is it enjoyable in Jeseník?