
Table 1.
Comparison of the main results of the NISQ factoring in the current work with previous studies.
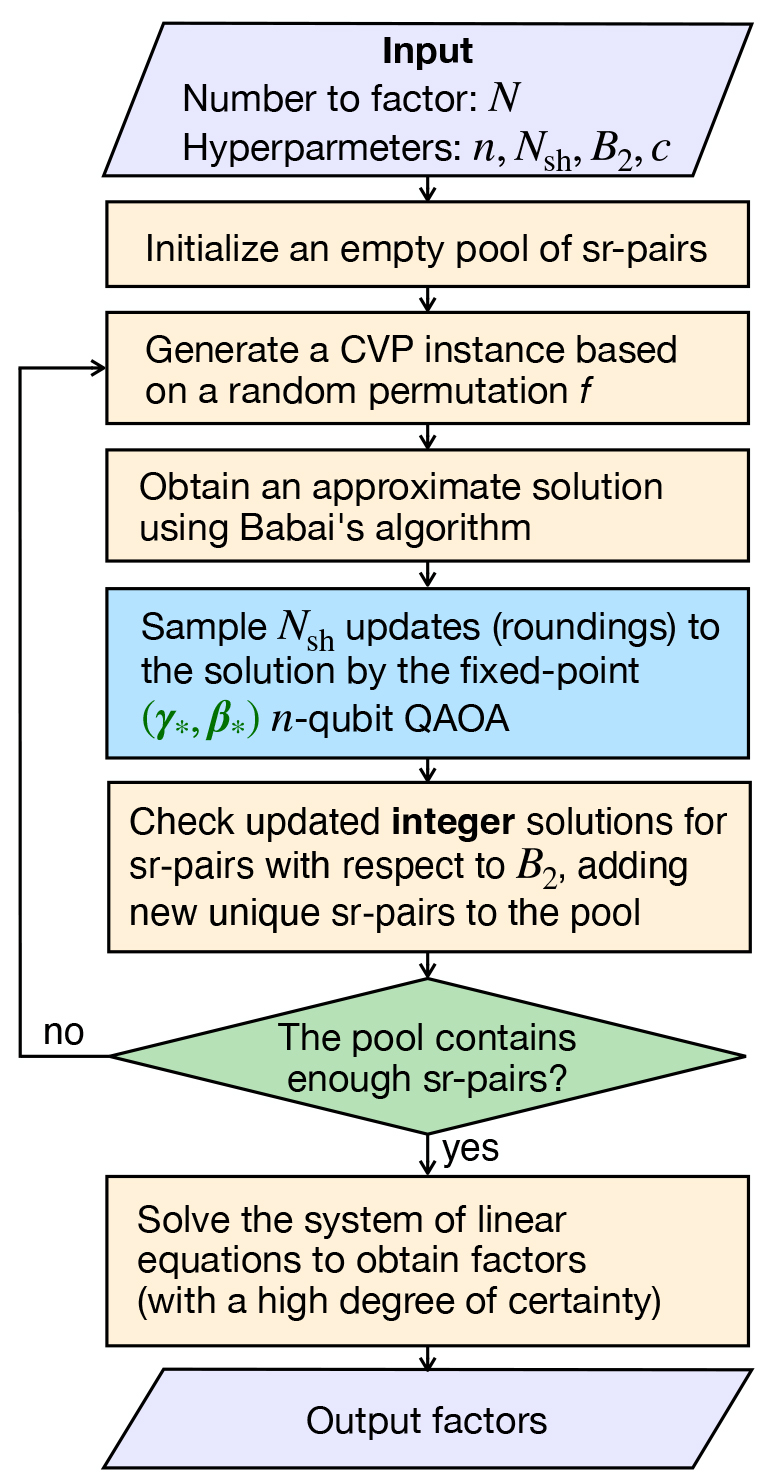
Figure 1.
General scheme of the QAOA-based Schnorr factoring algorithm.
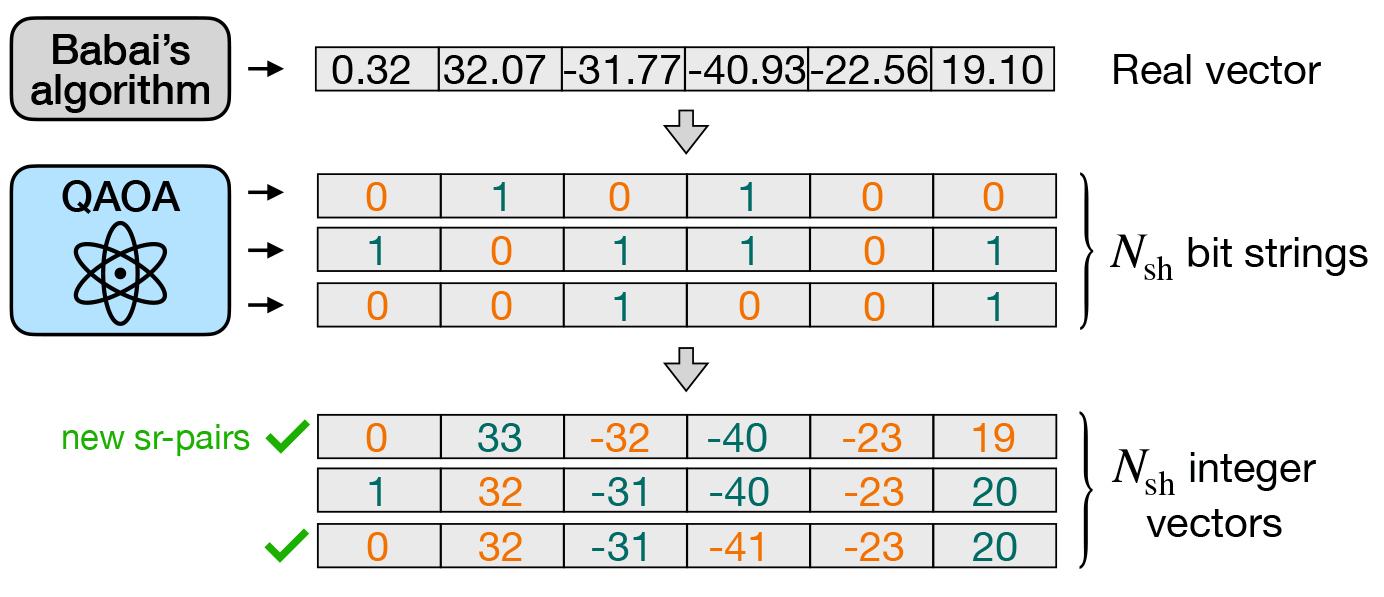
Figure 2.
The example of the rounding refinement in the QAOA-based Schnorr factoring algorithm.
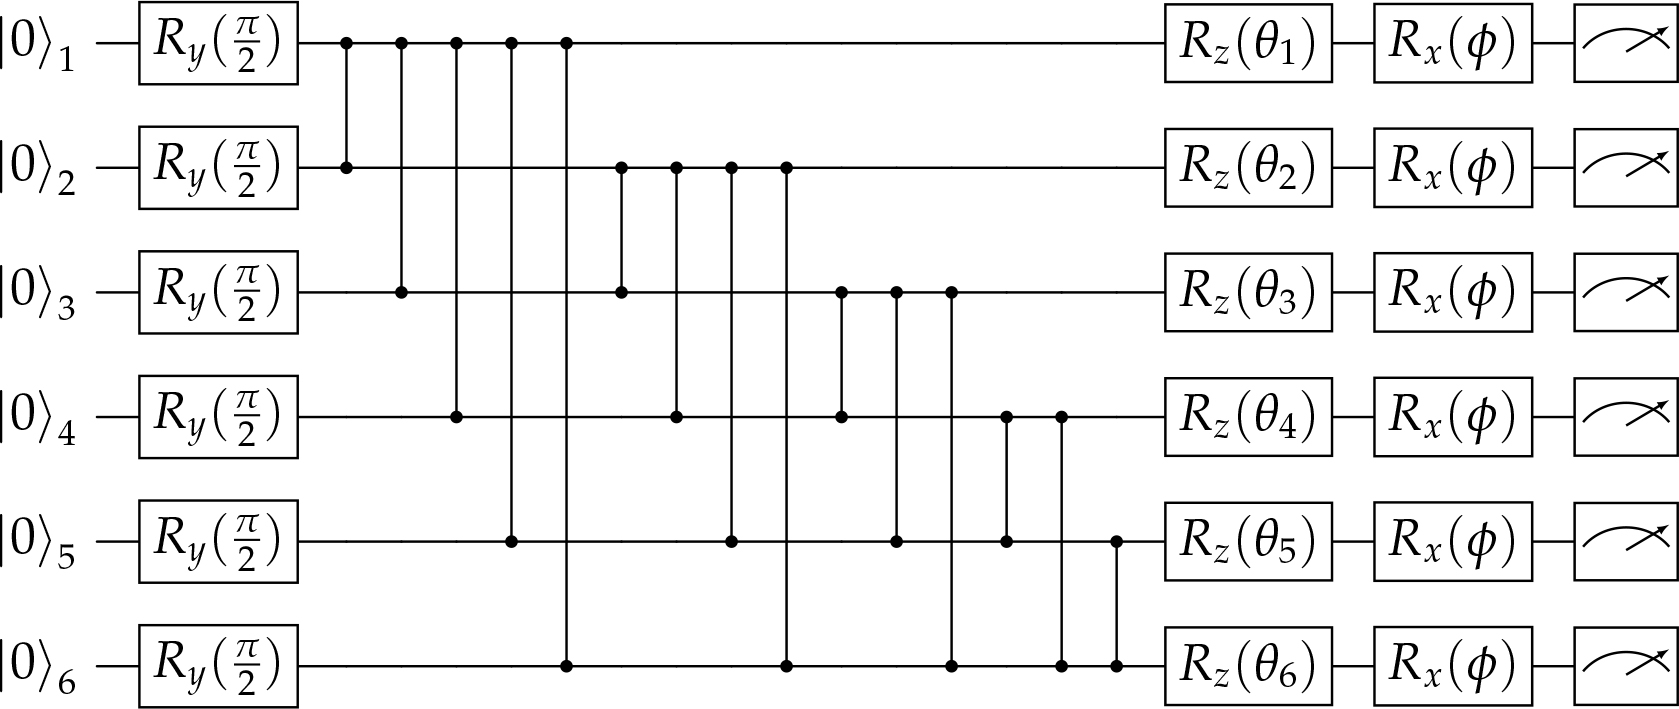
Figure 3.
Architecture of the executed quantum circuits in fixed-point-QAOA algorithm. Each pair of connected black circles corresponds to ZZ (χij) gate acting on i-th and j-th qubits, where for each involved qubit pair χij is unique. Angles θi in Rz (θi) gates are also different for each i-th qubit in each circuit. β in Rx (φ) is equal to 2.64. For each of the 9 executed circuits parameters of these gates are given in Table 5 of Supplementary Materials.
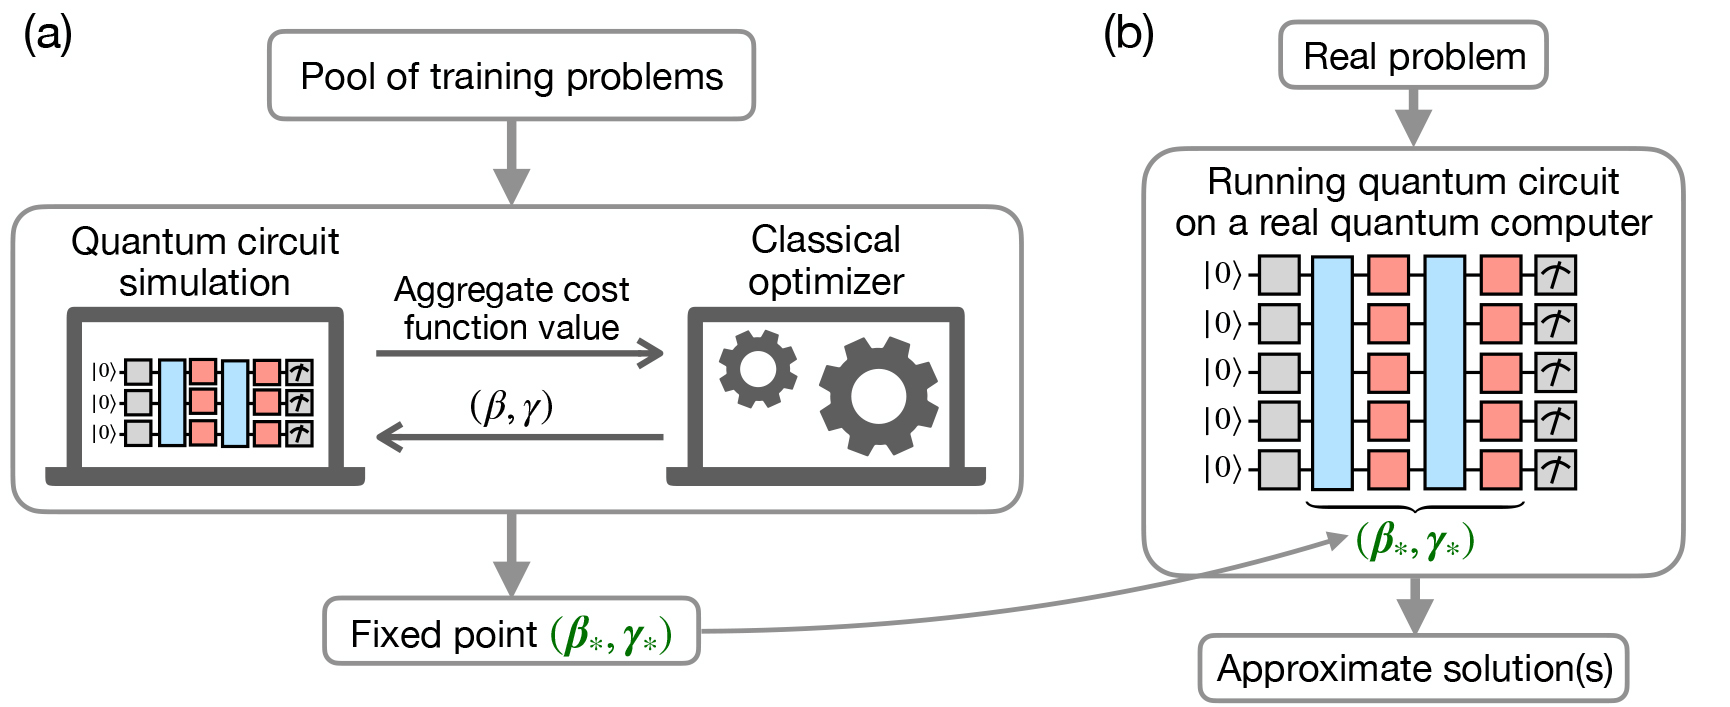
Figure 4.
Scheme of the fixed-parameters QAOA algorithm: (a) training—search for fixed parameters; (b) using for real problems.
Table 2.
Parameters of the experimental setup.
| Parameter | Value |
|---|---|
| Number of qubits | 10 |
| Single-qubit gate fidelity | 99.946(6)% |
| Two-qubit gate fidelity1 | 96.3(3)% |
| 30(2) ms | |
| Connectivity | Full |
| Single-qubit gate duration | 20 μs |
| Two-qubit gate duration | 1.14 ms |
| Secular frequencies (ωx, ωy, ωz) | 2π × (3.7, 3.6, 0.13) MHz |
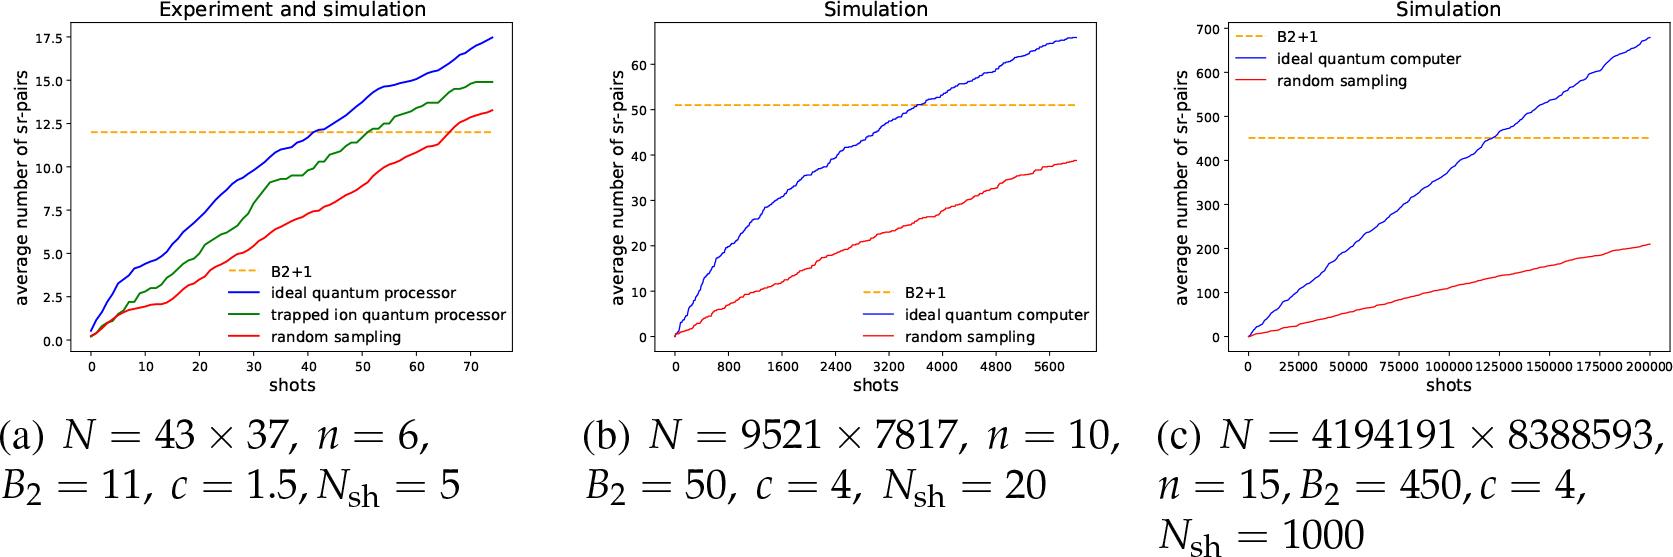
Figure 5.
A comparison of sr-pairs collection rates between cases where QUBO-subproblems samples are generated with a random sampling (red lines), a noiseless quantum emulator (blue), and a real trapped-ion quantum processor (green) for different number of qubits. The left sub-figure shows both experimental (averaged over 10 runs) and simulation data (averaged over 30 runs), while other figures contain only simulation results (averaged over 10 trajectories). Here N stands for the factorized number, n is for the number of qubits, and Nsh is for the number of shots per circuit. The dashed horizontal line shows a B2 + 1 sr-pairs threshold which guarantees the factorization.
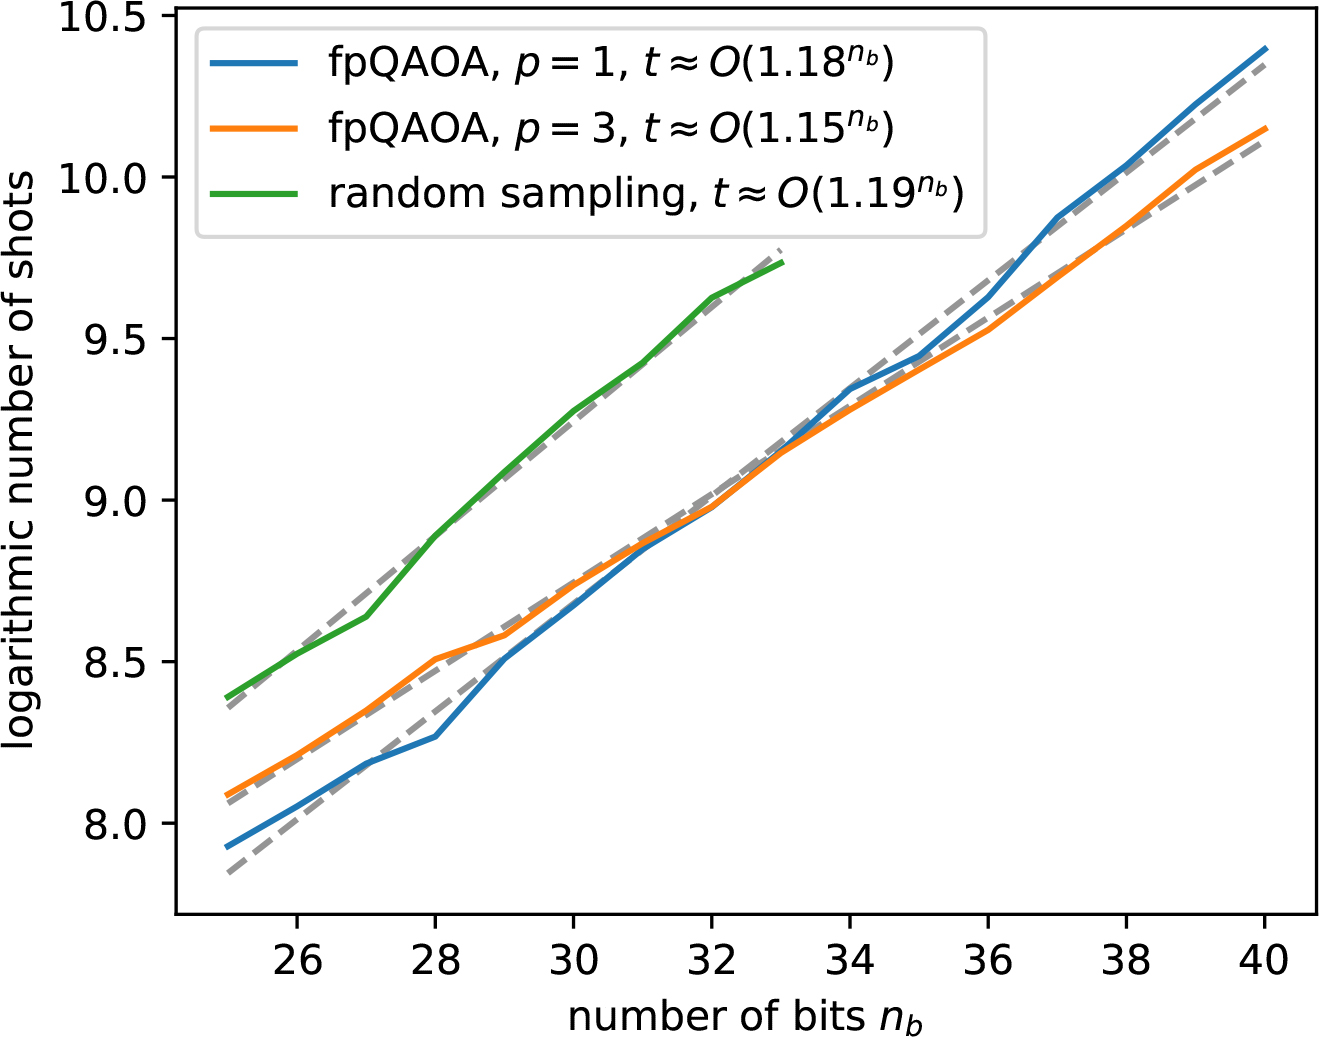
Figure 6.
Dependency of computational complexity (number of shots) on the number of bits.
Table 3.
Optimal n for different bit-lengths and QUBO-solving methods.
| method / nb | 25 | 26 | 27 | 28 | 29 | 30 | 31 | 32 | 33 | 34 | 35 | 36 | 37 | 38 | 39 | 40 |
| fpQAOA, p = 1 | 11 | 10 | 11 | 11 | 11 | 12 | 12 | 11 | 12 | 12 | 12 | 13 | 12 | 14 | 12 | 13 |
| fpQAOA, p = 3 | 12 | 14 | 12 | 14 | 15 | 14 | 14 | 14 | 14 | 14 | 15 | 15 | 15 | 15 | 16 | 16 |
| random sampling | 9 | 9 | 9 | 9 | 9 | 10 | 10 | 10 | 10 |
Table 4.
Steps of the factoring.
| Step | Permutation | Circuit | Measurement Result | sr-pair | #sr-pairs | Factoring |
|---|---|---|---|---|---|---|
| 1 | (1, 3, 2, 5, 6, 4) | 1 | 010001 | 0 | ||
| 2 | (1, 3, 2, 5, 6, 4) | 1 | 101000 | 0 | ||
| 3 | (1, 3, 2, 5, 6, 4) | 1 | 000100 | 0 | ||
| 4 | (1, 3, 2, 5, 6, 4) | 1 | 001010 | 0 | ||
| 5 | (1, 3, 2, 5, 6, 4) | 1 | 000001 | 0 | ||
| 6 | (4, 1, 3, 6,5, 2) | 2 | 000010 | 0 | ||
| 7 | (4, 1, 3, 6, 5, 2) | 2 | 001101 | 0 | ||
| 8 | (4, 1, 3, 6, 5, 2) | 2 | 000000 | (1521, 1) | 1 | |
| 9 | (4, 1, 3, 6, 5, 2) | 2 | 000000 | 1 | ||
| 10 | (4, 1, 3, 6, 5, 2) | 2 | 100000 | (1690, 1) | 2 | |
| 11 | (3, 5, 2, 6, 4, 1) | 3 | 001000 | (5005, 3) | 3 | |
| 12 | (3, 5, 2, 6, 4, 1) | 3 | 101000 | 3 | ||
| 13 | (3, 5, 2, 6, 4, 1) | 3 | 100001 | 3 | ||
| 14 | (3, 5, 2, 6, 4, 1) | 3 | 001100 | 3 | ||
| 15 | (3, 5, 2, 6, 4, 1) | 3 | 000001 | 3 | ||
| 16 | (1, 4, 2, 6, 5, 3) | 4 | 000010 | 3 | ||
| 17 | (1, 4, 2, 6, 5,3) | 4 | 000000 | (1625, 1) | 4 | |
| 18 | (1, 4, 2, 6, 5, 3) | 4 | 001000 | 4 | ||
| 19 | (1, 4, 2, 6, 5, 3) | 4 | 001000 | 4 | ||
| 20 | (1, 4, 2, 6, 5, 3) | 4 | 100000 | 4 | ||
| 21 | (1, 5, 4, 2, 3, 6) | 5 | 000000 | (1540, 1) | 5 | |
| 22 | (1, 5, 4, 2, 3, 6) | 5 | 000000 | 5 | ||
| 23 | (1, 5, 4, 2, 3, 6) | 5 | 100000 | 5 | ||
| 24 | (1, 5, 4, 2, 3, 6) | 5 | 010000 | 5 | ||
| 25 | (1, 5, 4, 2, 3, 6) | 5 | 100000 | 5 | ||
| 26 | (6, 5, 1, 2, 3, 4) | 6 | 000001 | 5 | ||
| 27 | (6, 5, 1, 2, 3, 4) | 6 | 101101 | (41503, 25) | 6 | |
| 28 | (6, 5, 1, 2, 3, 4) | 6 | 000011 | 6 | ||
| 29 | (6, 5, 1, 2, 3, 4) | 6 | 100110 | (5775, 4) | 7 | |
| 30 | (6, 5, 1, 2, 3, 4) | 6 | 010011 | 7 | ||
| 31 | (5, 4, 2, 3, 1, 6) | 7 | 000100 | 7 | ||
| 32 | (5, 4, 2, 3, 1, 6) | 7 | 001010 | (1375, 1) | 8 | |
| 33 | (5, 4, 2, 3, 1, 6) | 7 | 000000 | (1573, 1) | 9 | |
| 34 | (5, 4, 2, 3, 1, 6) | 7 | 110000 | 9 | ||
| 35 | (5, 4, 2, 3, 1, 6) | 7 | 100100 | (3185, 2) | 10 | ✓ |
| 36 | (5, 6, 2, 4, 1, 3) | 8 | 010100 | 10 | ✓ | |
| 37 | (5, 6, 2, 4, 1, 3) | 8 | 100000 | 10 | ✓ | |
| 38 | (5, 6, 2, 4, 1, 3) | 8 | 100010 | (3125, 2) | 11 | ✓ |
| 39 | (5, 6, 2, 4, 1, 3) | 8 | 011000 | 11 | ✓ | |
| 40 | (5, 6, 2, 4, 1, 3) | 8 | 011000 | 11 | ✓ | |
| 41 | (5, 4, 3, 1, 2, 6) | 9 | 011010 | 11 | ✓ | |
| 42 | (5, 4, 3, 1, 2, 6) | 9 | 001000 | 11 | ✓ | |
| 43 | (5, 4, 3, 1, 2, 6) | 9 | 000000 | (1617, 1) | 12 | ✓ |
Table 5.
Rz and ZZ gates rotation angles of quantum circuits used in the factorization of 1591.
| Circuit1 | Circuit2 | Circuit3 | Circuit4 | Circuit5 | Circuit6 | Circuit7 | Circuit8 | Circuit9 | |
|---|---|---|---|---|---|---|---|---|---|
| θ1 | – 0.619 | 0.190 | –0.513 | – 0.619 | – 0.867 | –1.667 | 0.400 | –1.133 | 0.476 |
| θ2 | 0.667 | –1.429 | –0.308 | 0.667 | 0.133 | – 0.444 | –1.067 | – 3.000 | – 0.857 |
| θ3 | –1.095 | – 0.714 | –1.436 | –1.095 | 0.667 | – 0.556 | – 0.867 | –1.267 | –1.143 |
| θ4 | – 0.095 | –1.381 | –0.205 | – 0.095 | 0.067 | 0.333 | – 0.933 | – 2.067 | – 0.095 |
| θ5 | –1.714 | –1.571 | –1.026 | –1.714 | – 0.267 | –1.444 | -0.867 | –1.200 | – 0.190 |
| θ6 | – 0.952 | – 2.095 | –0.308 | – 0.952 | – 0.733 | 0.444 | -0.067 | –1.067 | – 0.190 |
| χ12 | – 0.095 | -0.190 | –0.026 | – 0.095 | 0.300 | 0.333 | – 0.233 | 0.233 | – 0.286 |
| χ13 | 0.048 | 0.095 | 0.128 | 0.048 | – 0.233 | 0.333 | – 0.133 | 0.067 | – 0.190 |
| χ14 | 0.024 | – 0.048 | 0.128 | 0.024 | – 0.200 | 0 | – 0.033 | 0.033 | – 0.238 |
| χ15 | 0.048 | – 0.024 | 0.103 | 0.048 | – 0.067 | 0.278 | 0 | 0.167 | – 0.238 |
| χ16 | 0.095 | –0.095 | –0.128 | 0.095 | 0.067 | –0.389 | –0.133 | –0.133 | 0.238 |
| χ23 | –0.095 | –0.167 | –0.231 | –0.095 | 0.100 | –0.167 | 0.200 | 0.200 | 0.333 |
| χ24 | 0.048 | 0.190 | –0.205 | 0.048 | –0.233 | 0.056 | 0.067 | 0.233 | –0.286 |
| χ25 | –0.095 | 0.167 | 0.077 | –0.095 | –0.200 | 0.056 | 0.167 | 0.167 | 0.048 |
| χ26 | –0.190 | 0.190 | 0.077 | –0.190 | –0.200 | –0.389 | 0 | 0.167 | 0.048 |
| χ34 | –0.095 | –0.048 | 0.333 | –0.095 | –0.033 | –0.333 | –0.167 | –0.167 | –0.095 |
| χ35 | 0.214 | 0.071 | 0.179 | 0.214 | –0.167 | –0.278 | –0.133 | –0.133 | –0.190 |
| χ36 | 0.024 | 0.071 | –0.128 | 0.024 | –0.200 | 0.222 | 0.133 | 0.133 | 0.143 |
| χ45 | 0 | –0.119 | –0.128 | 0 | –0.167 | 0 | 0.333 | 0.333 | –0.286 |
| χ46 | –0.143 | 0.333 | –0.179 | –0.143 | –0.100 | –0.389 | –0.233 | –0.067 | –0.048 |
| χ56 | 0.214 | 0.119 | –0.128 | 0.214 | 0 | –0.444 | –0.100 | –0.267 | –0.286 |
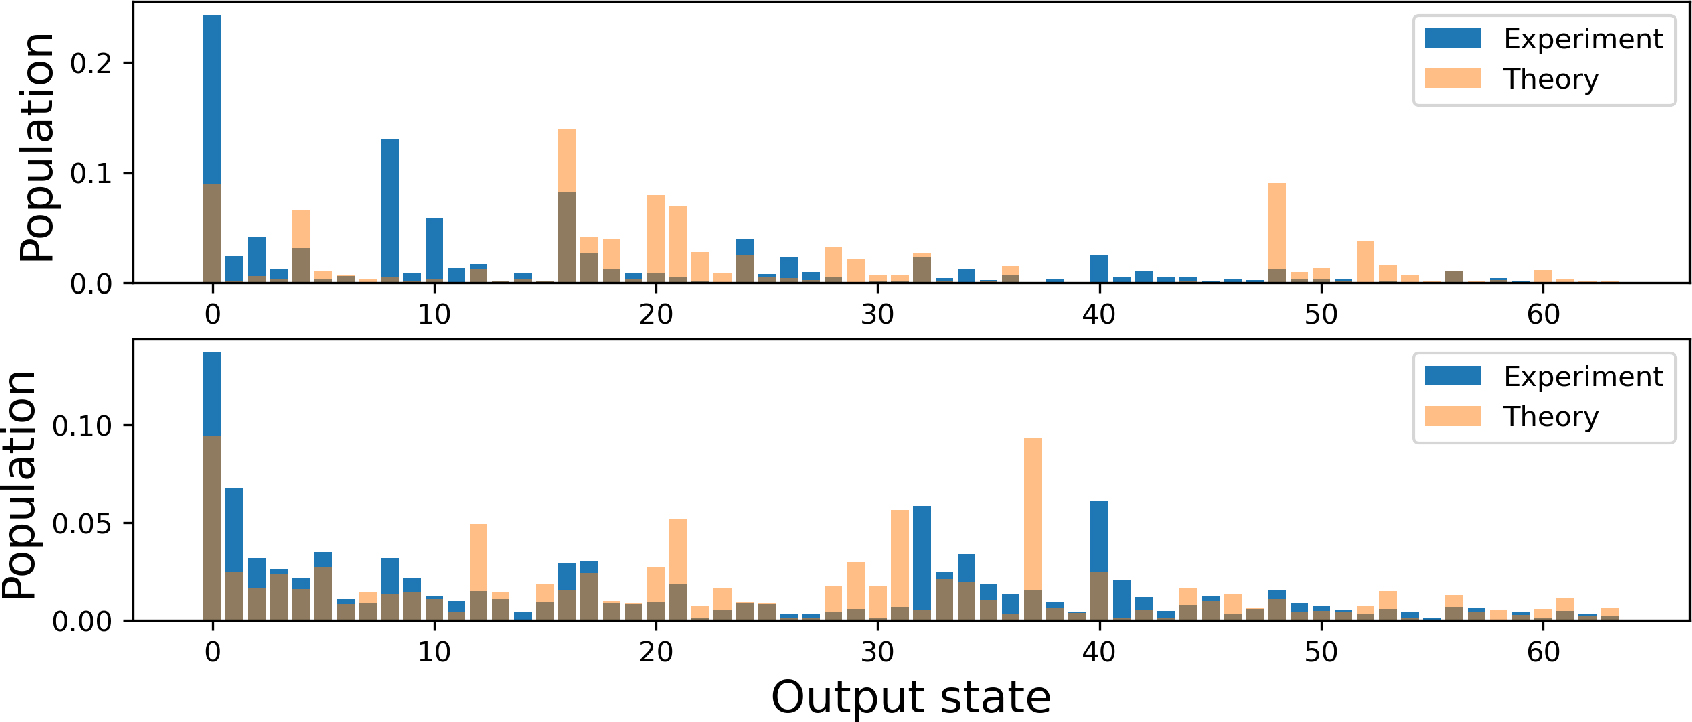
Figure 7.
Output states probabilities for circuits 1 and 6 from Table 5 sampled by the quantum processor and the noiseless emulator. Output states are numbered as a decimal representation of the output bitstrings. The first qubit corresponds to the high-order digit in the bitstrings. Each histogram is an average of 2000 shots.
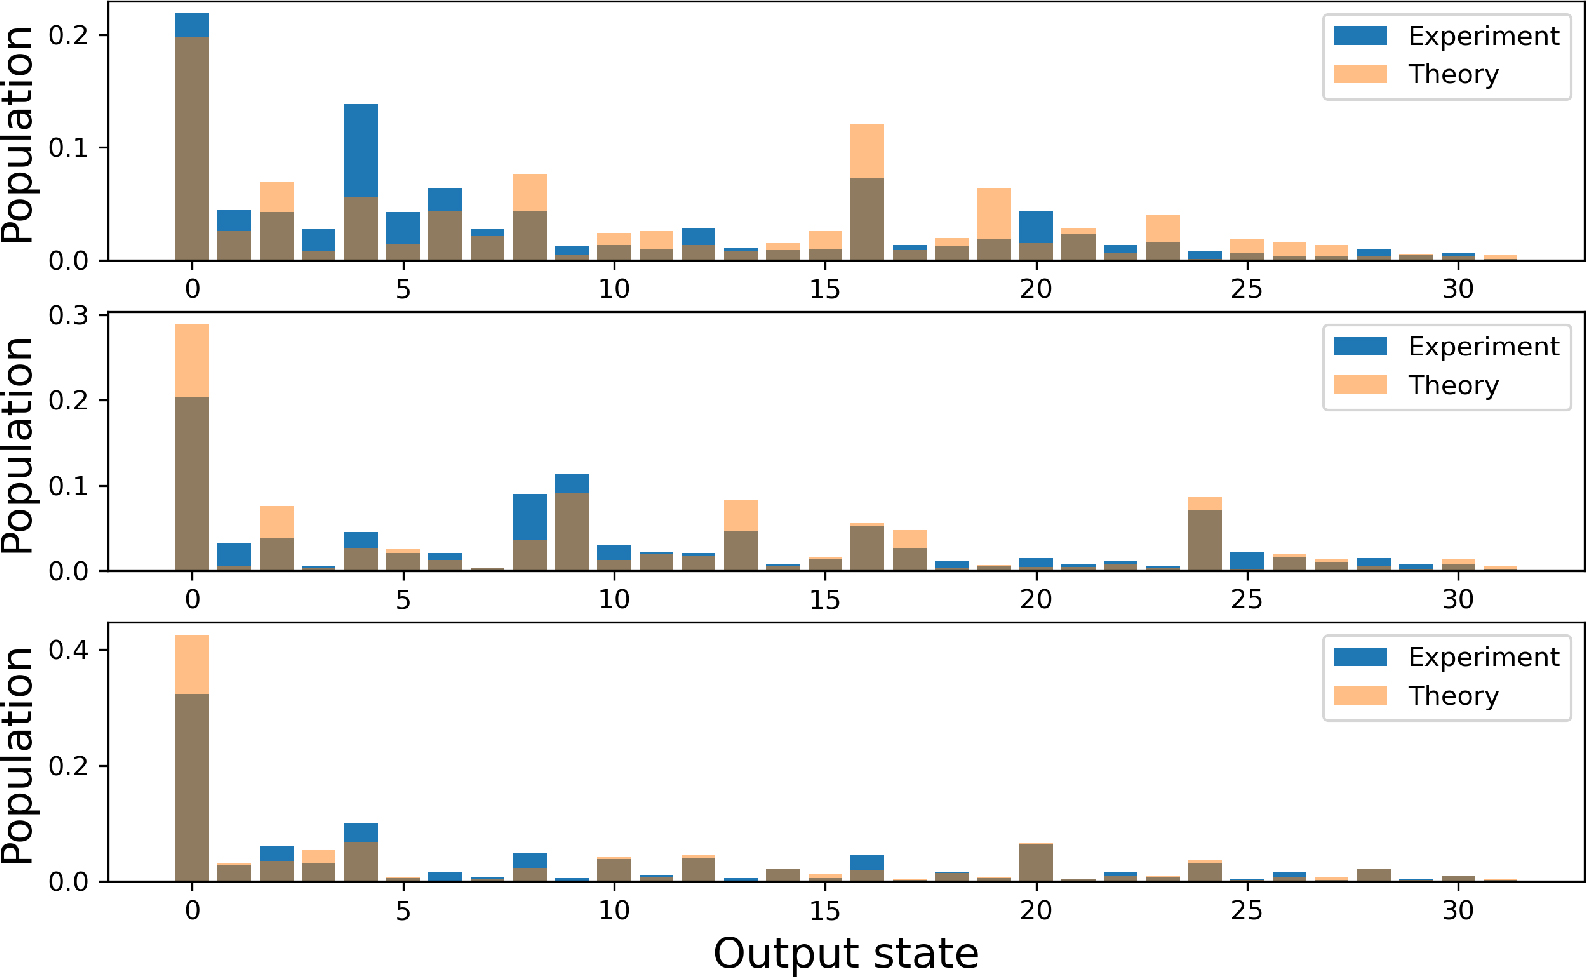
Figure 8.
Output states probabilities sampled by the quantum processor and the noiseless emulator for a set of circuits used to factorize number 437 using 5 qubits. Output states are numbered as a decimal representation of the output bitstrings. The first qubit corresponds to the high-order digit in the bitstrings. Each histogram is an average of 2000 shots.