
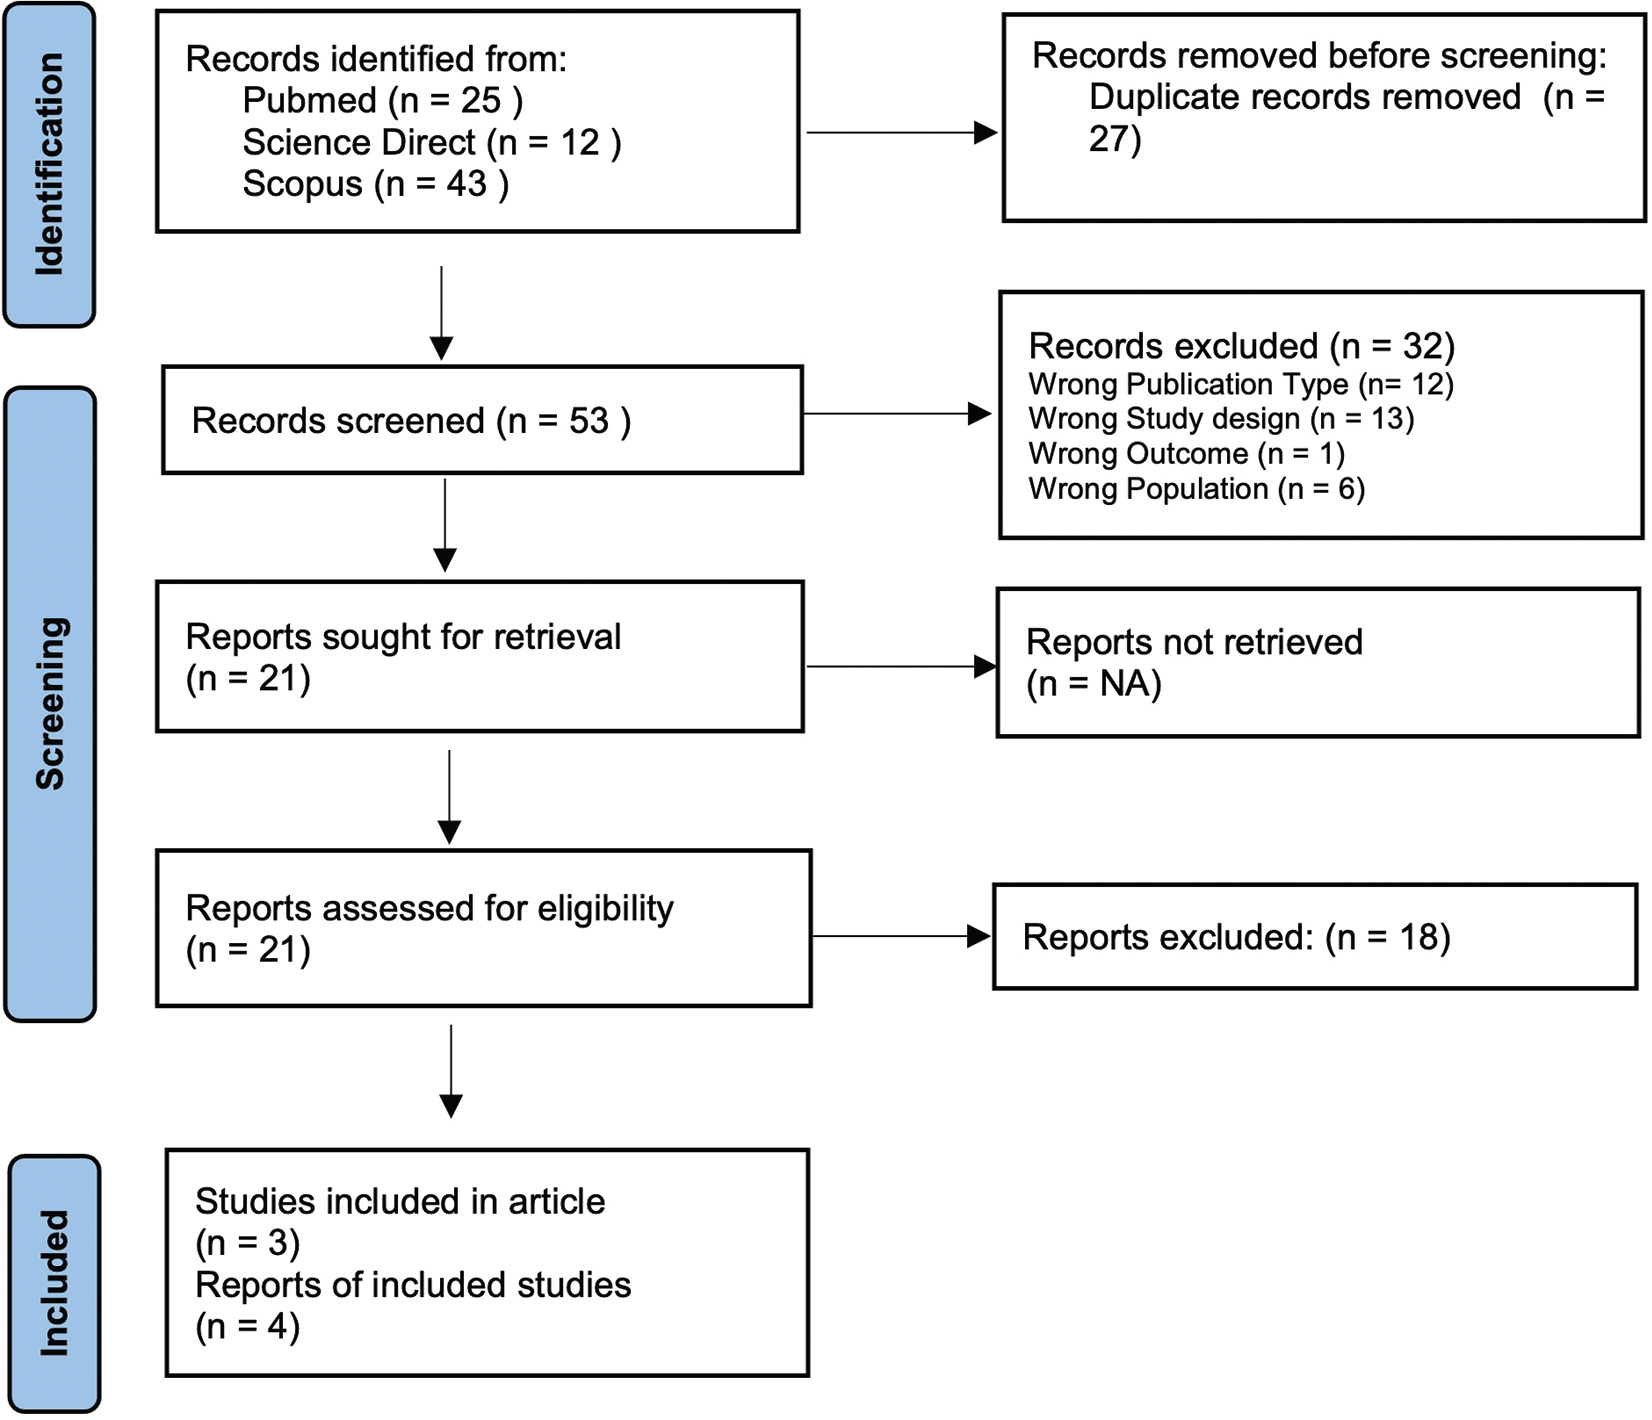
Figure 1.
Flowchart Illustrating the Search Strategy.
Table 1.
Characteristics of studies included in the meta-analysis
| Study or subgroup | Study design | Sample size | Age (mean) | Male (%) | Diagnosis of OSA | OSA severity/AHI (events/h) | Endotypes measured | NOS score |
|---|---|---|---|---|---|---|---|---|
| Brooker 2023 (13) | Cross-sectional | 34 | 49.9 | 61 | PSG | 22.3 | Upper airway collapsibility, muscle compensation, loop gain, arousal threshold | 9 |
| Brooker 2024 (14) | Cross-sectional | 27 | 71.7 | 100 | PSG | 23.6 | Upper airway collapsibility, muscle compensation, loop gain, arousal threshold | 9 |
| Wang 2024a (9) | Cross-sectional | 562 | 41.0 | 84 | PSG | 57.2 | Upper airway collapsibility, muscle compensation, loop gain, arousal threshold | 6 |
| Wang 2024b (9) | Cross-sectional | 474 | 40.0 | 83 | PSG | 26.3 | Upper airway collapsibility, muscle compensation, loop gain, arousal threshold | 6 |
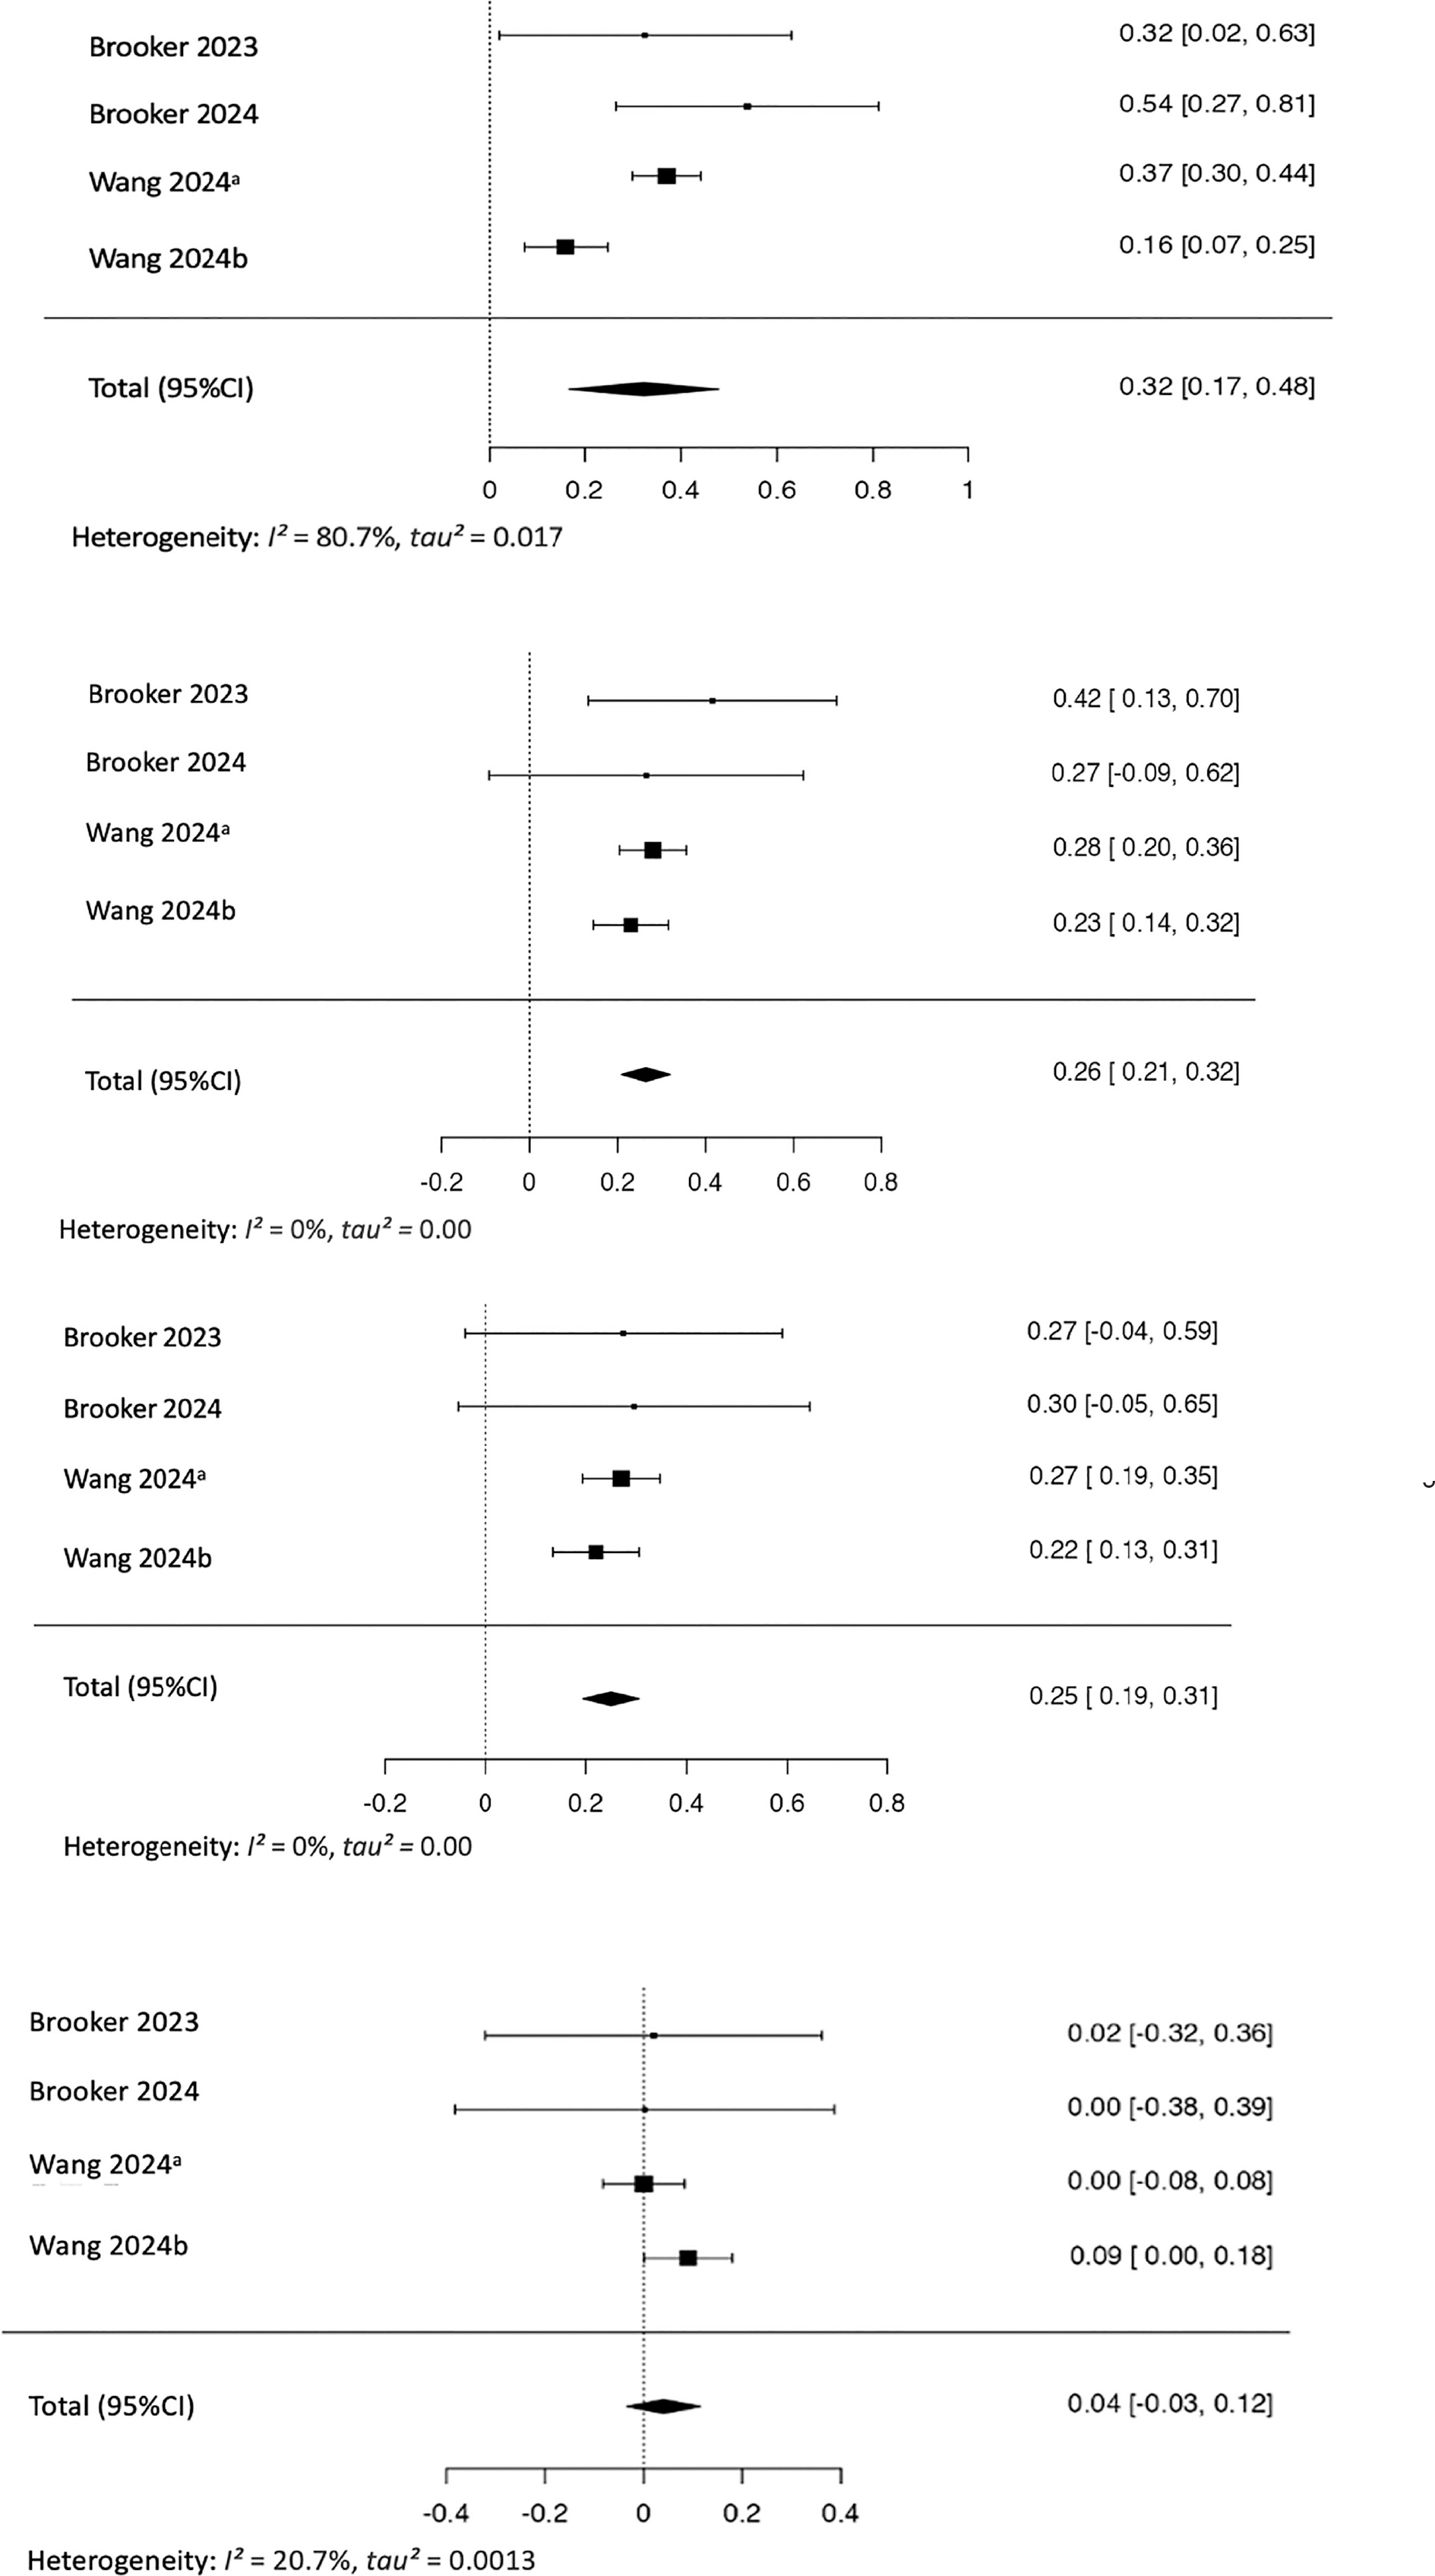
Figure 2.
Forest Plots Illustrating Correlation of OSA Severity with Endotypes.
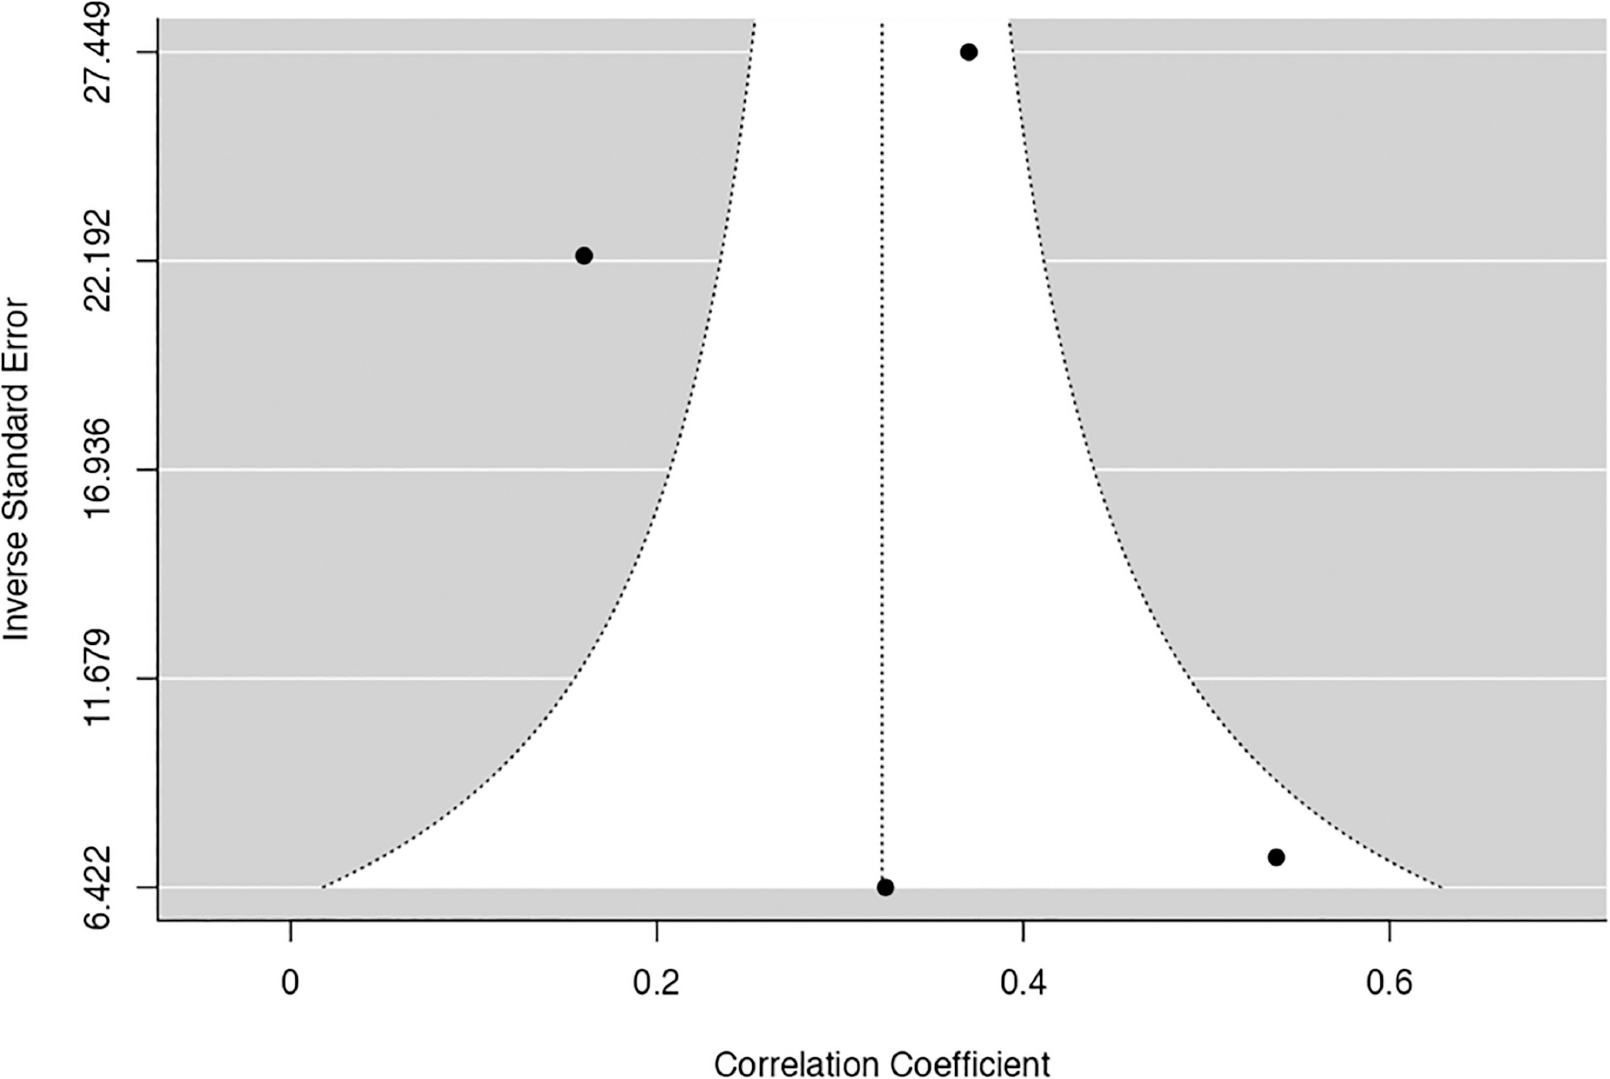
Figure S1.
Funnel plot for upper airway collapse and OSA severity. OSA, obstructive sleep apnoea.
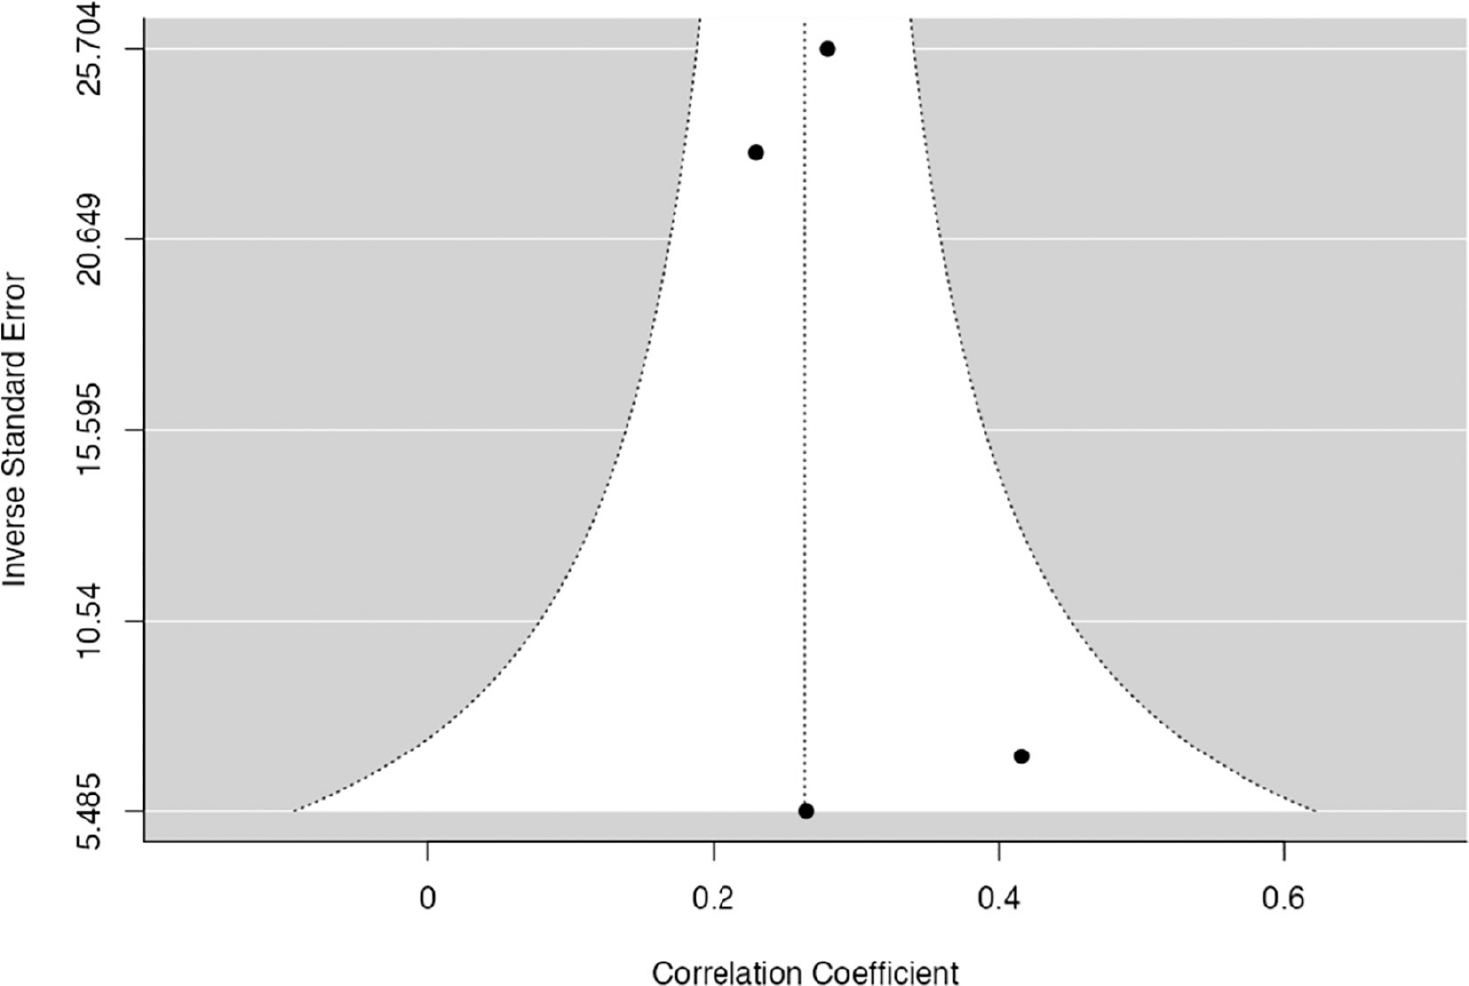
Figure S2.
Funnel plot for loop gain and OSA severity. OSA, obstructive sleep apnoea.
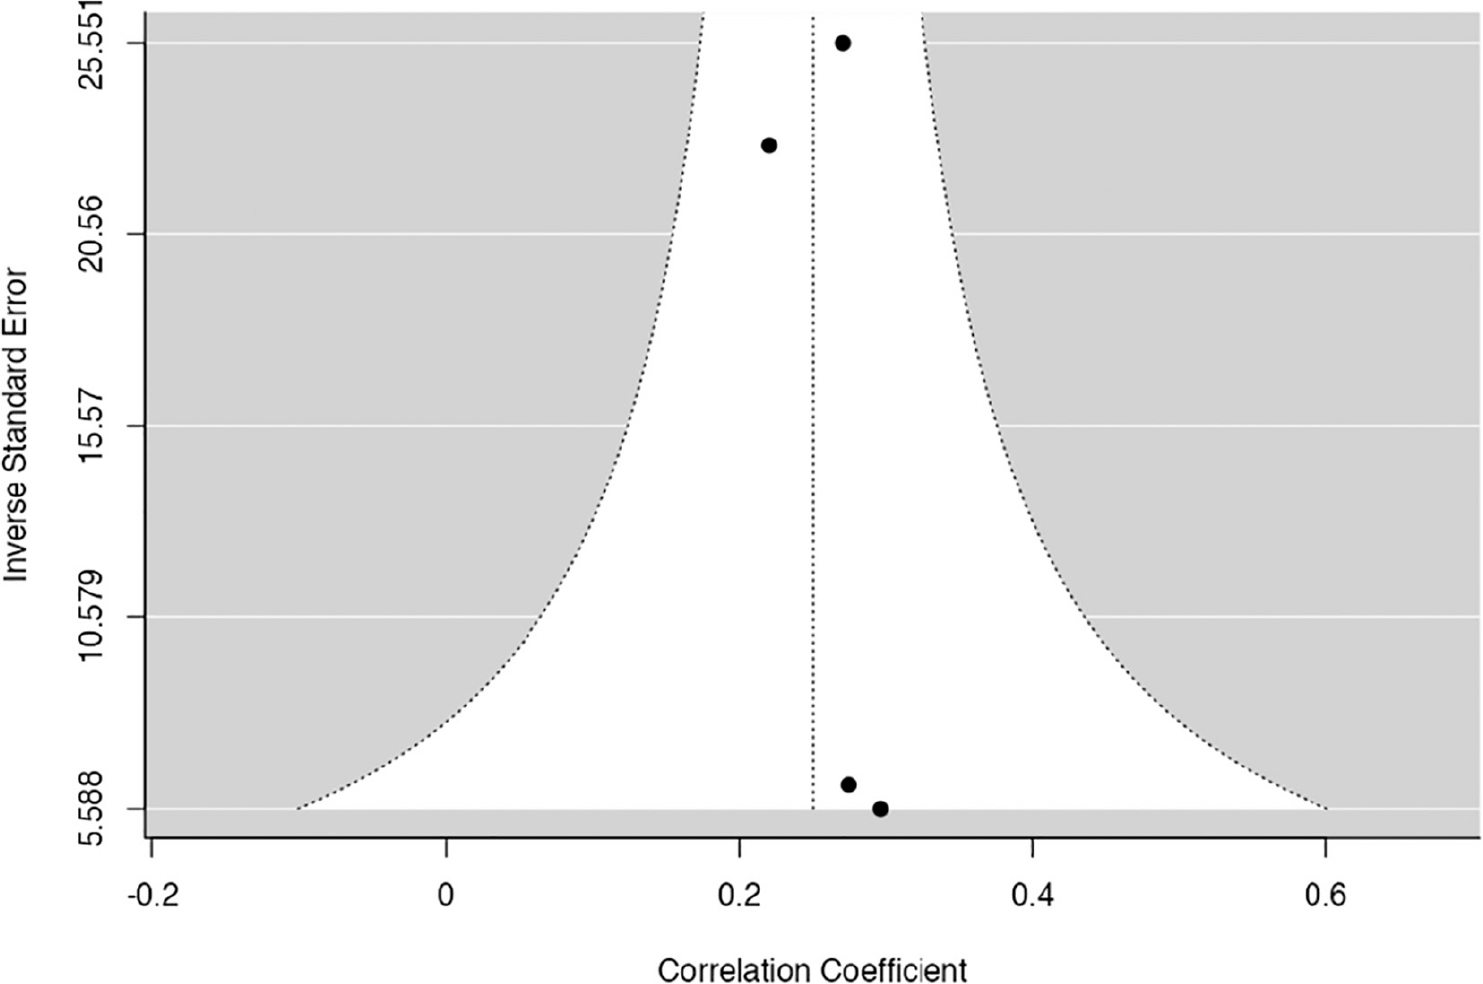
Figure S3.
Funnel plot for arousal threshold and OSA severity. OSA, obstructive sleep apnoea.
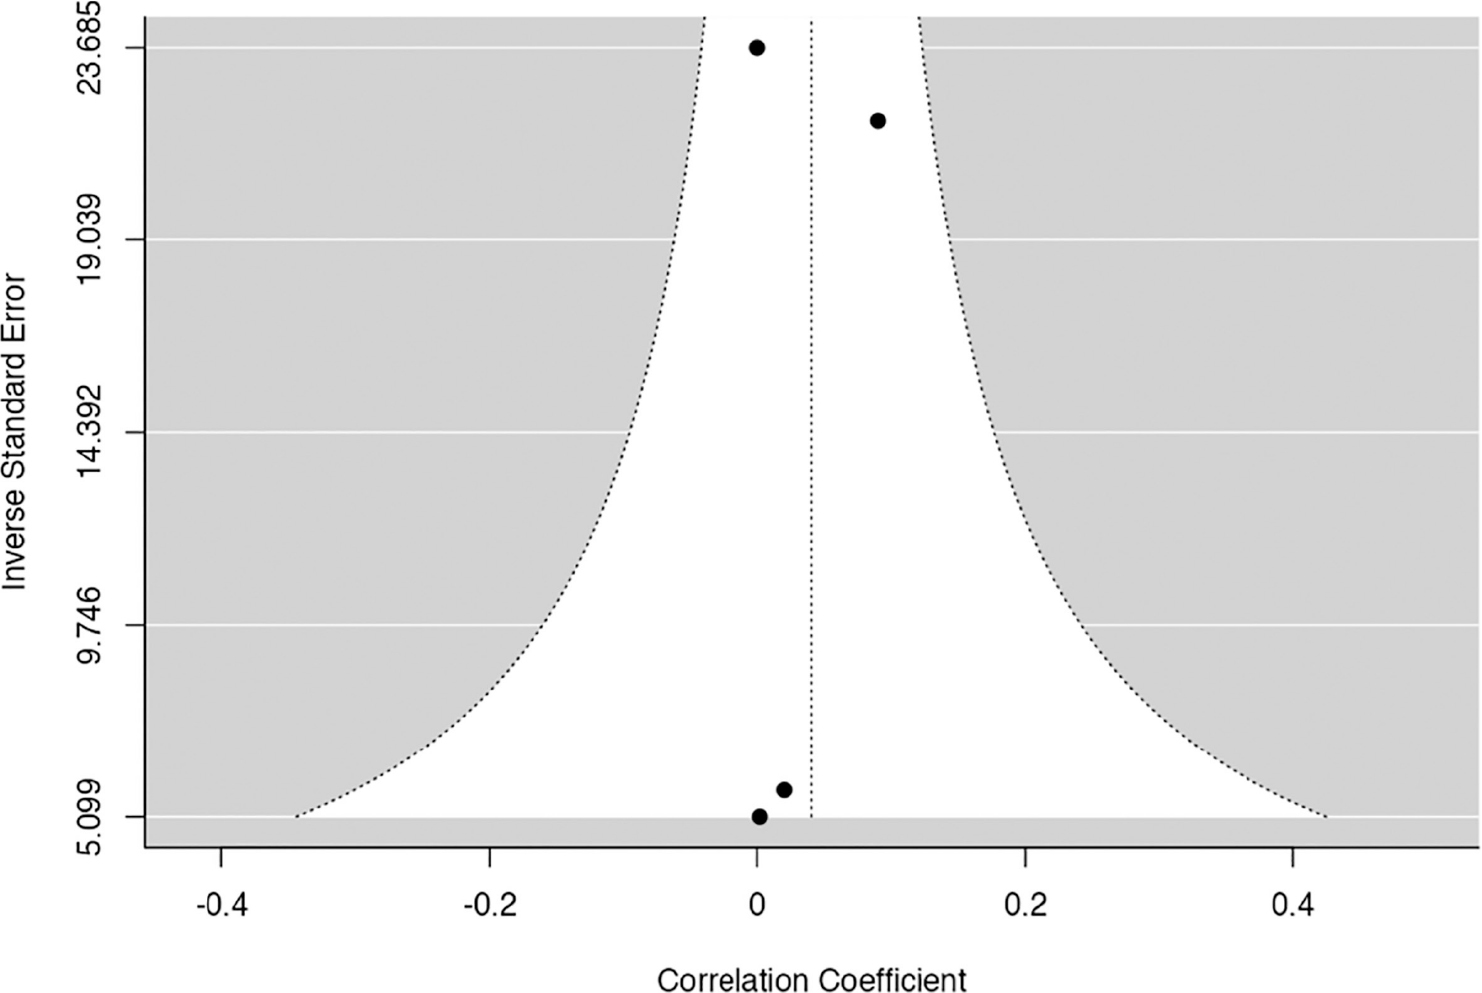
Figure S4.
Funnel plot for muscle compensation and OSA severity. OSA, obstructive sleep apnoea.
Table S1.
Quality assessment of the studies based on NOS
Table S2.
Publication bias assessment for upper airway collapse and OSA severity
| Test Name | Value | P |
|---|---|---|
| Fail-Safe N | 140.000 | <0.001 |
| Begg and Mazumdar Rank Correlation | –0.333 | 0.750 |
| Egger’s Regression | 0.822 | 0.411 |
| Trim and Fill Number of Studies | 1.000 |
Table S3.
Publication bias assessment for loop gain and OSA severity
| Test Name | Value | P |
|---|---|---|
| Fail-Safe N | 101.000 | <0.001 |
| Begg and Mazumdar Rank Correlation | 0.000 | 1.000 |
| Egger’s Regression | 0.672 | 0.502 |
| Trim and Fill Number of Studies | 1.000 |
Table S4.
Publication bias assessment for arousal threshold and OSA severity
| Test Name | Value | P |
|---|---|---|
| Fail-Safe N | 83.000 | <0.001 |
| Begg and Mazumdar Rank Correlation | 0.000 | 1.000 |
| Egger’s Regression | 0.232 | 0.817 |
| Trim and Fill Number of Studies | 1.000 |