
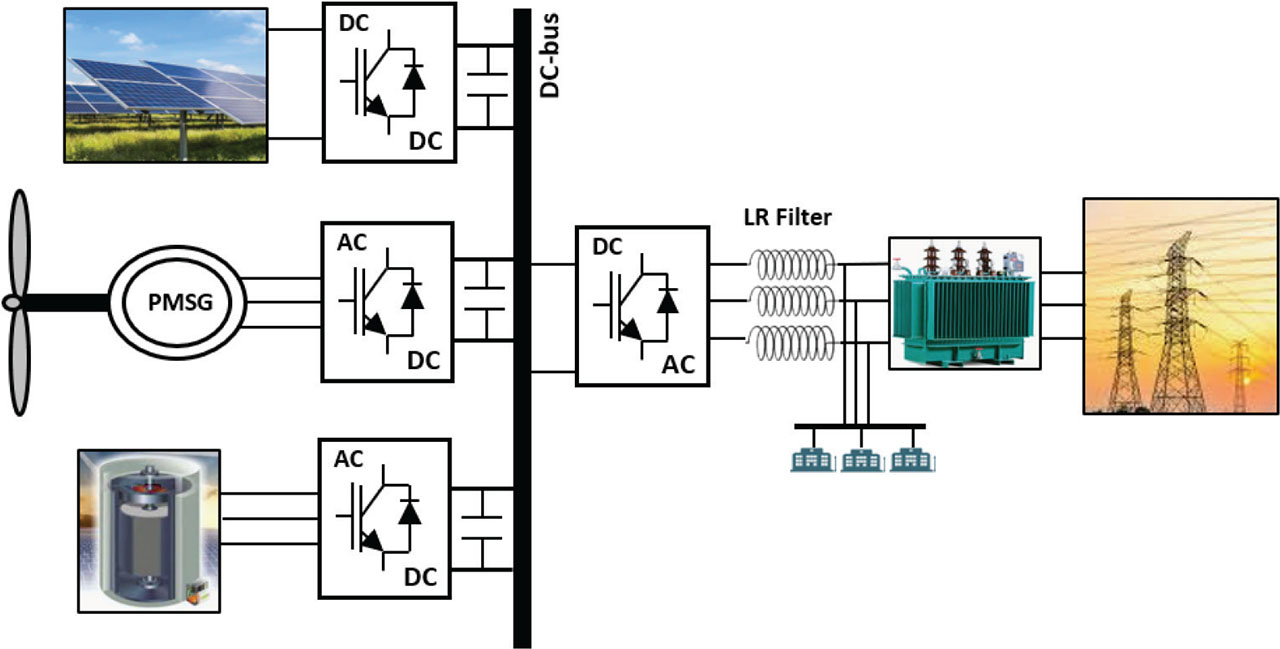
Fig. 1.
The architecture of the proposed OG-HRG. OG-HRG, on-grid hybrid renewable generation.
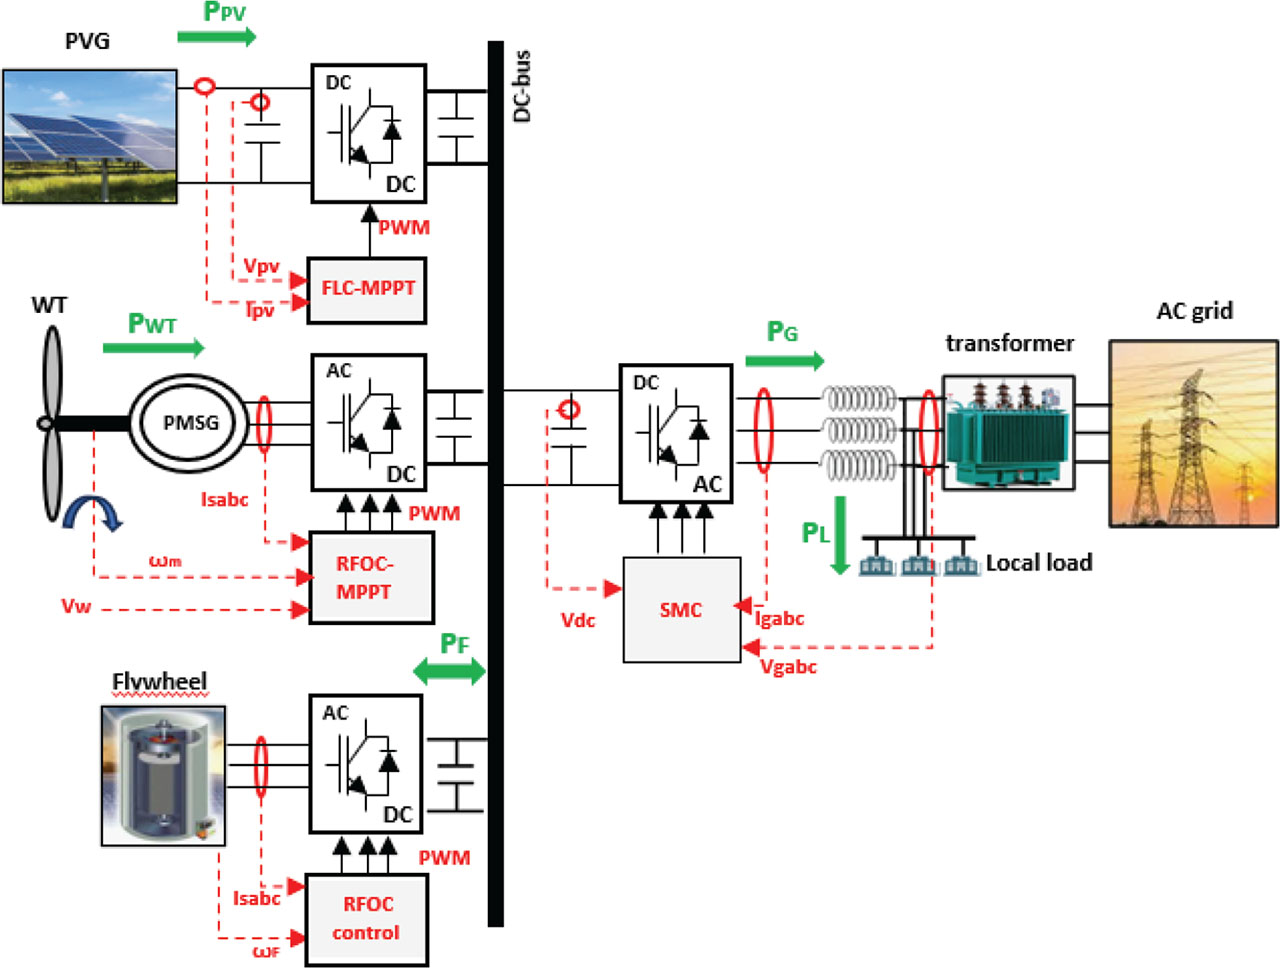
Fig. 2.
The control strategy of the OG-HRG. OG-HRG, on-grid hybrid renewable generation; PMSG, permanent magnet synchronous generator; PVG, photovoltaic generator; RFOC, rotor field oriented control; SMC, sliding mode control.
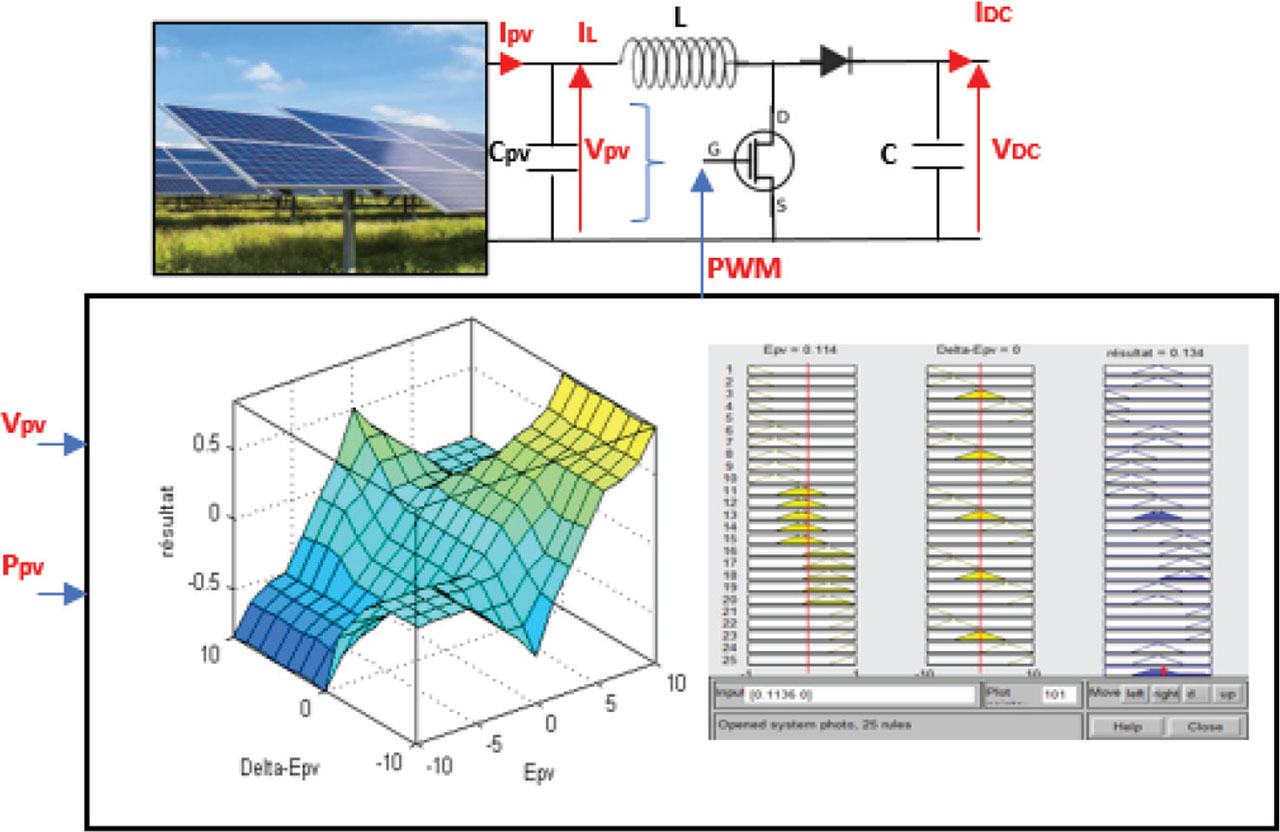
Fig. 3.
The configuration of the FLC-based MPPT.
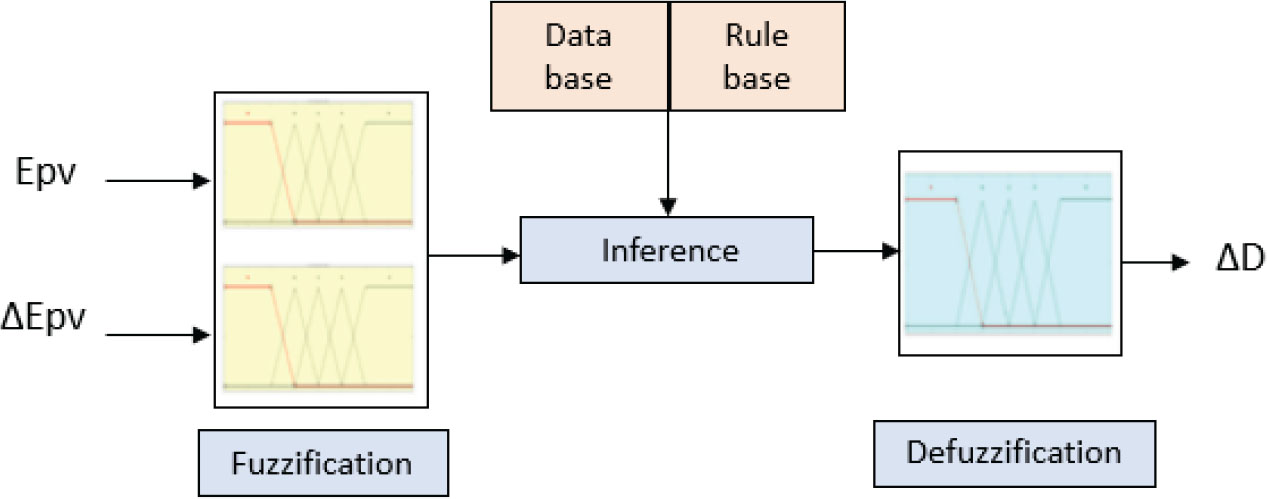
Fig. 4.
Structure of the FLC-based MPPT controller.
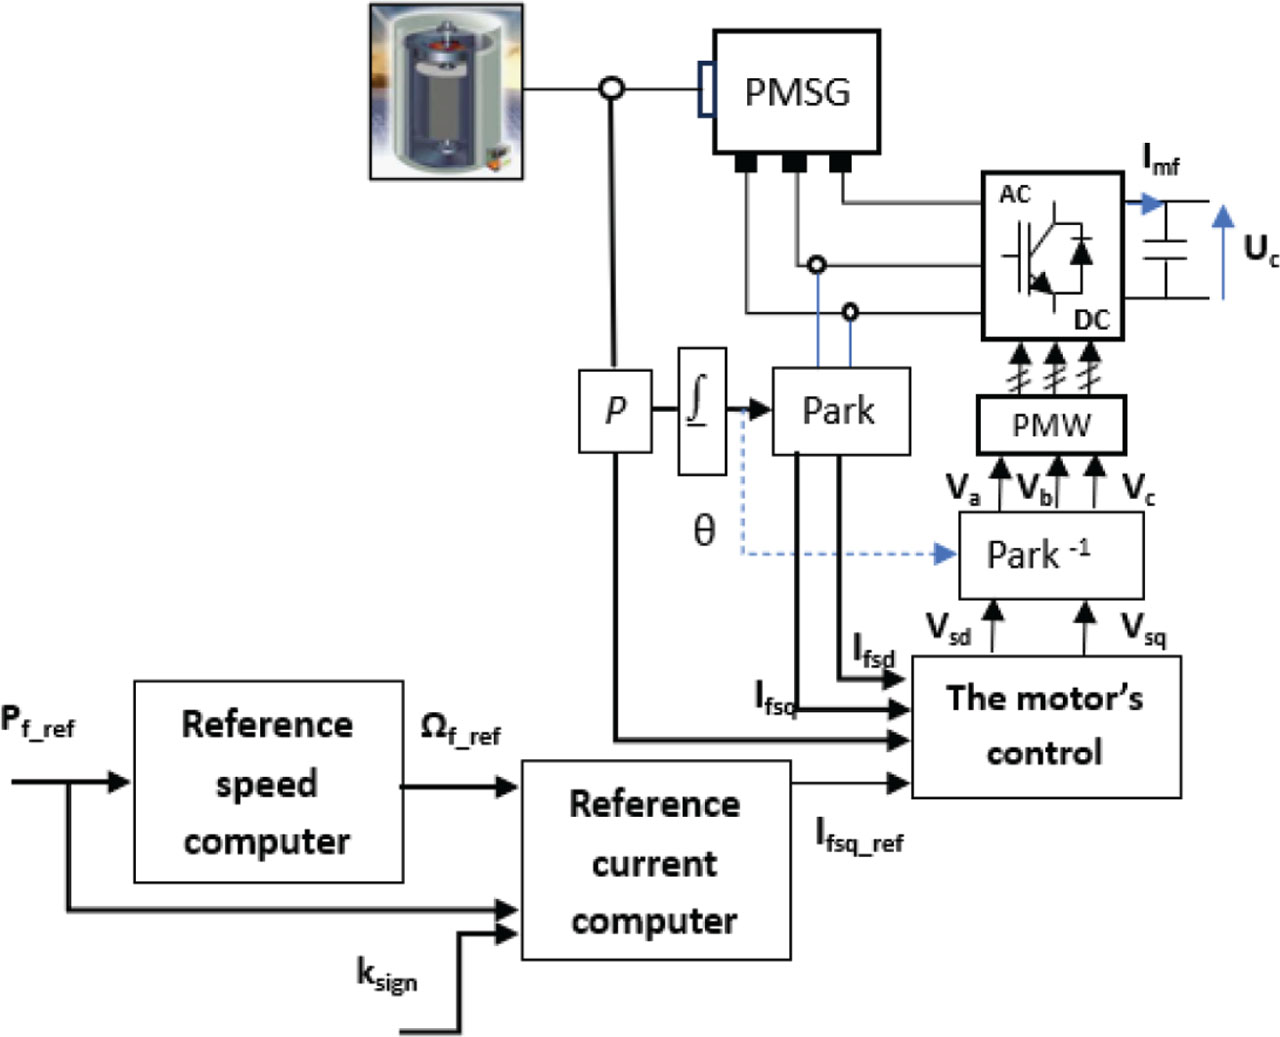
Fig. 5.
The control scheme for the inertia-driven energy storage unit. PMSG, permanent magnet synchronous generator.
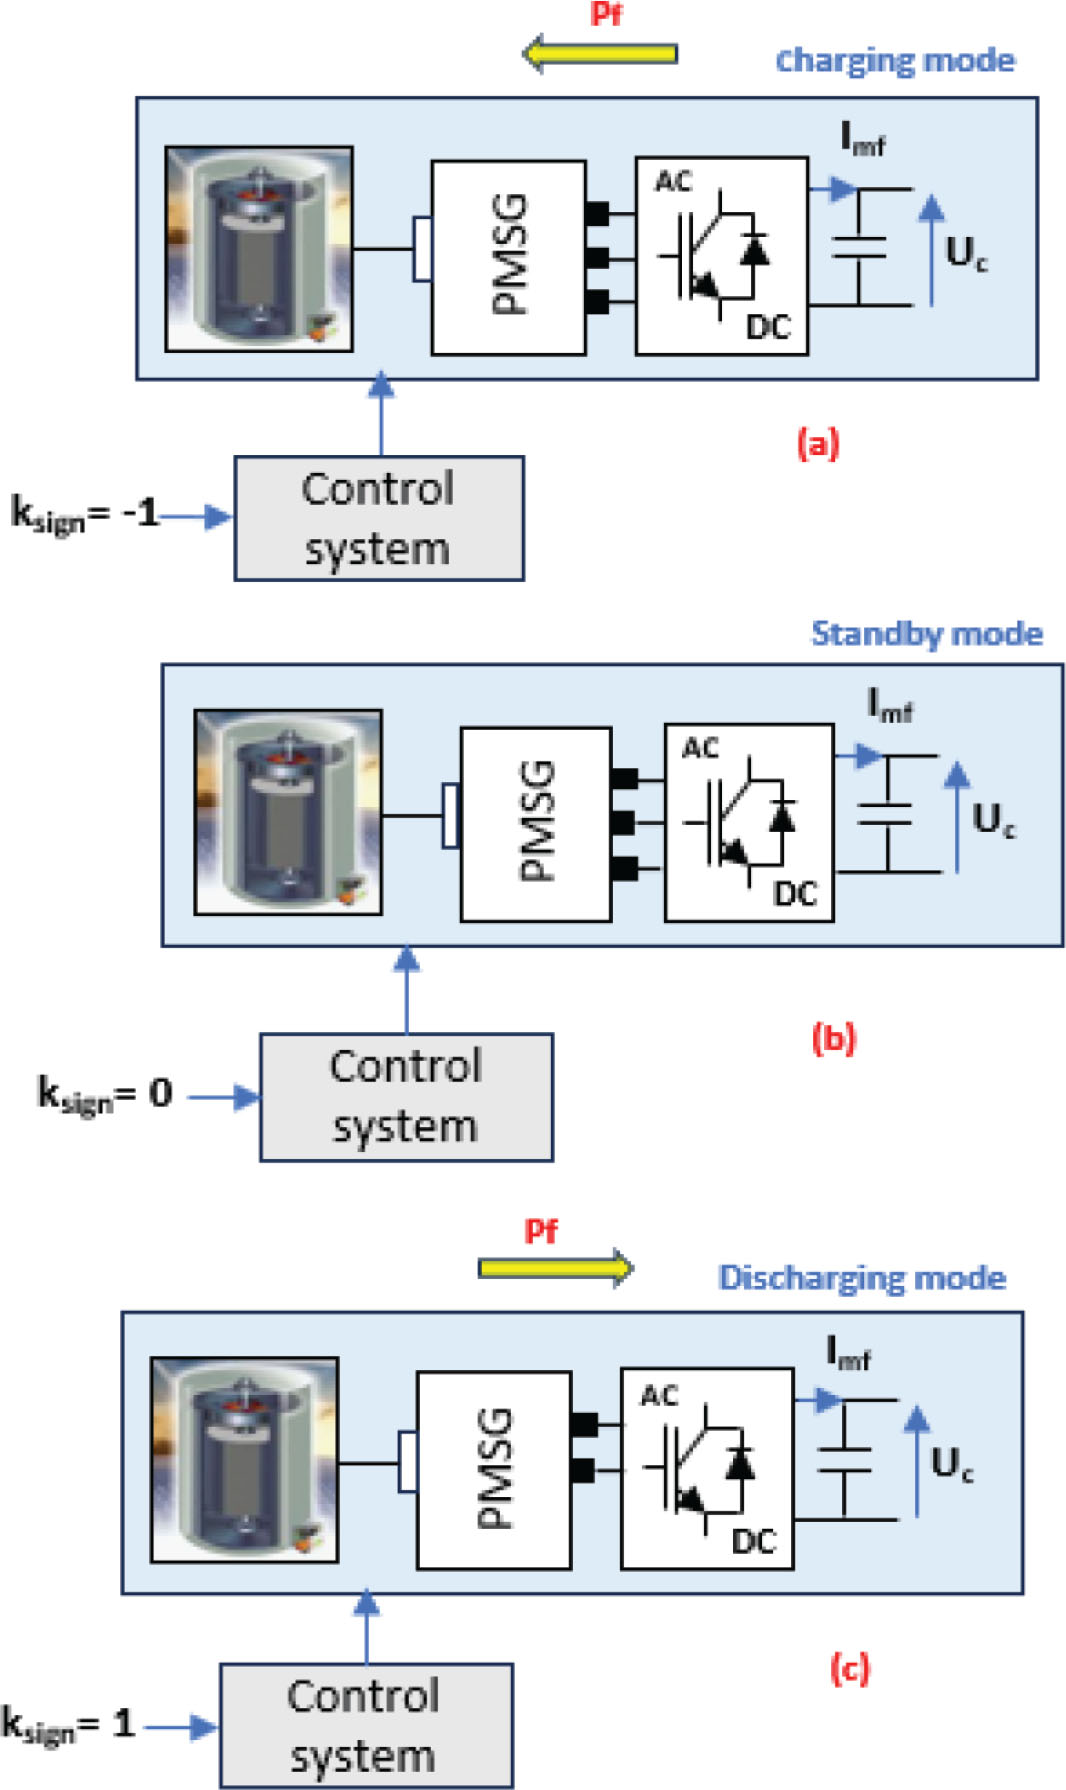
Fig. 6.
The FESS operating modes. FESS, flywheel energy storage system; PMSG, permanent magnet synchronous generator.
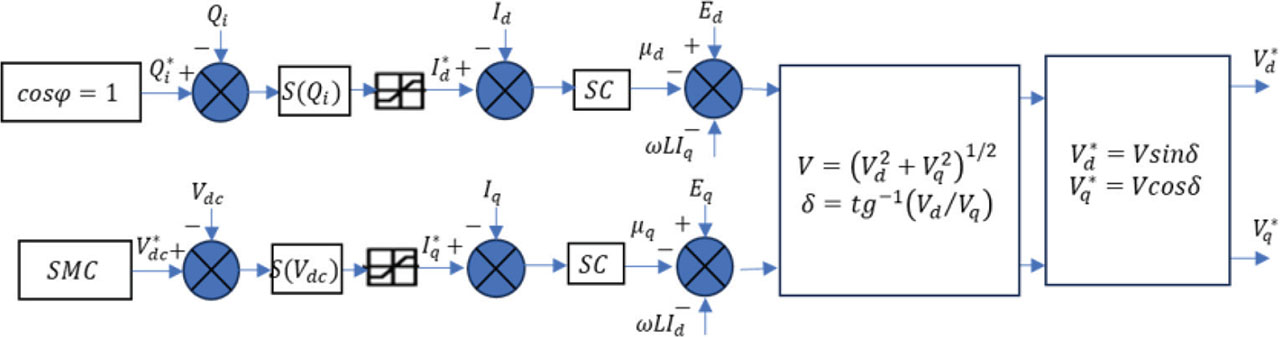
Fig. 7.
The architecture of the SMC controller. SMC, sliding mode control.
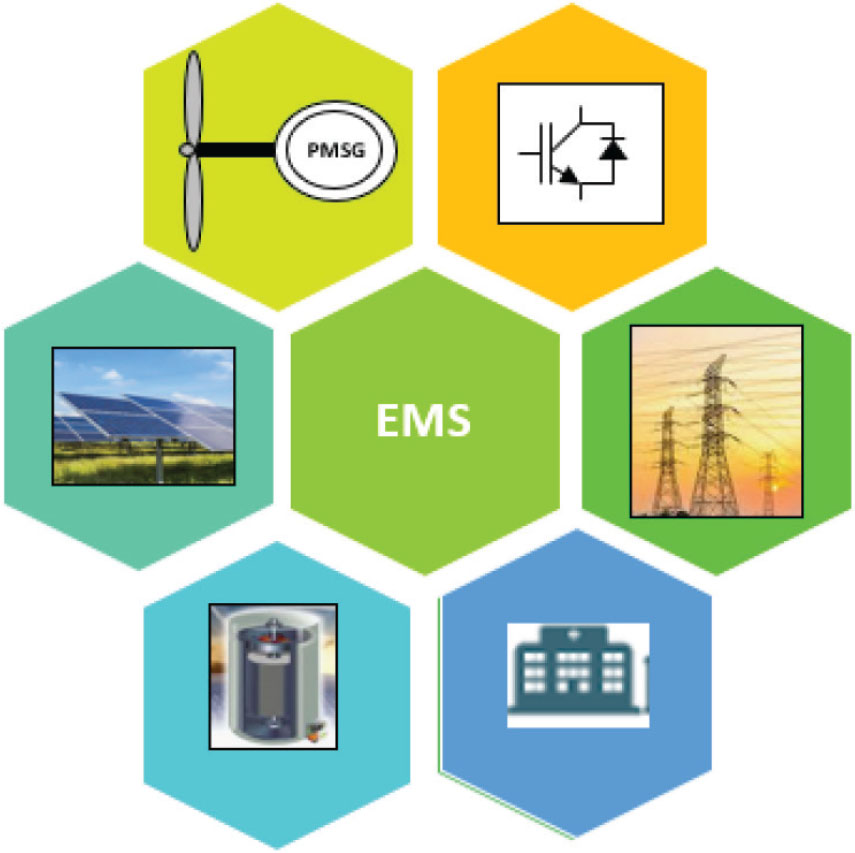
Fig. 8.
The EMS of the OG-HRG. EMS, energy management system; OG-HRG, on-grid hybrid renewable generation.
Table 1.
The power flow operating modes.
| No. | Operating mode | Keys state | Energy movement | Power balance | ||||||
|---|---|---|---|---|---|---|---|---|---|---|
| K1 | K2 | K3 | EREN | EG | EL | EF | Composition | System state | ||
| 1 | M1 | 0 | 0 | 0 | 0 | 0 | 0 | 0 | Maintenance | – – – – – – – – – – |
| 2 | M2 | 0 | 1 | 1 | 0 | <0 | >0 | 0 | Grid-load | PG = PL |
| 3 | M3.1 | 0 | 1 | 0 | <0 | - | >0 | >0 | PV + WT—Fl—L (disconnected mode) | Storage: PREN = PL + PF |
| 4 | M3.2 | 1 | 0 | 1 | <0 | - | >0 | <0 | PV + WT—Fl—L | Discharge: PREN = PL − PF |
| 5 | M4 | 1 | 1 | 0 | <0 | 0 | 0 | 0 | PV + WT—grid | Direct injection to grid PREN = PG |
| 6 | M5.1 | 1 | 1 | 1 | <0 | >0 | >0 | 0 | PV + WT—grid-load | PREN > PL |
| PREN = PG + PL | ||||||||||
| 7 | M5.2 | 1 | 1 | 1 | <0 | <0 | 0 | 0 | PV + WT—grid-load | PREN < PL |
| PREN = PL − PG | ||||||||||
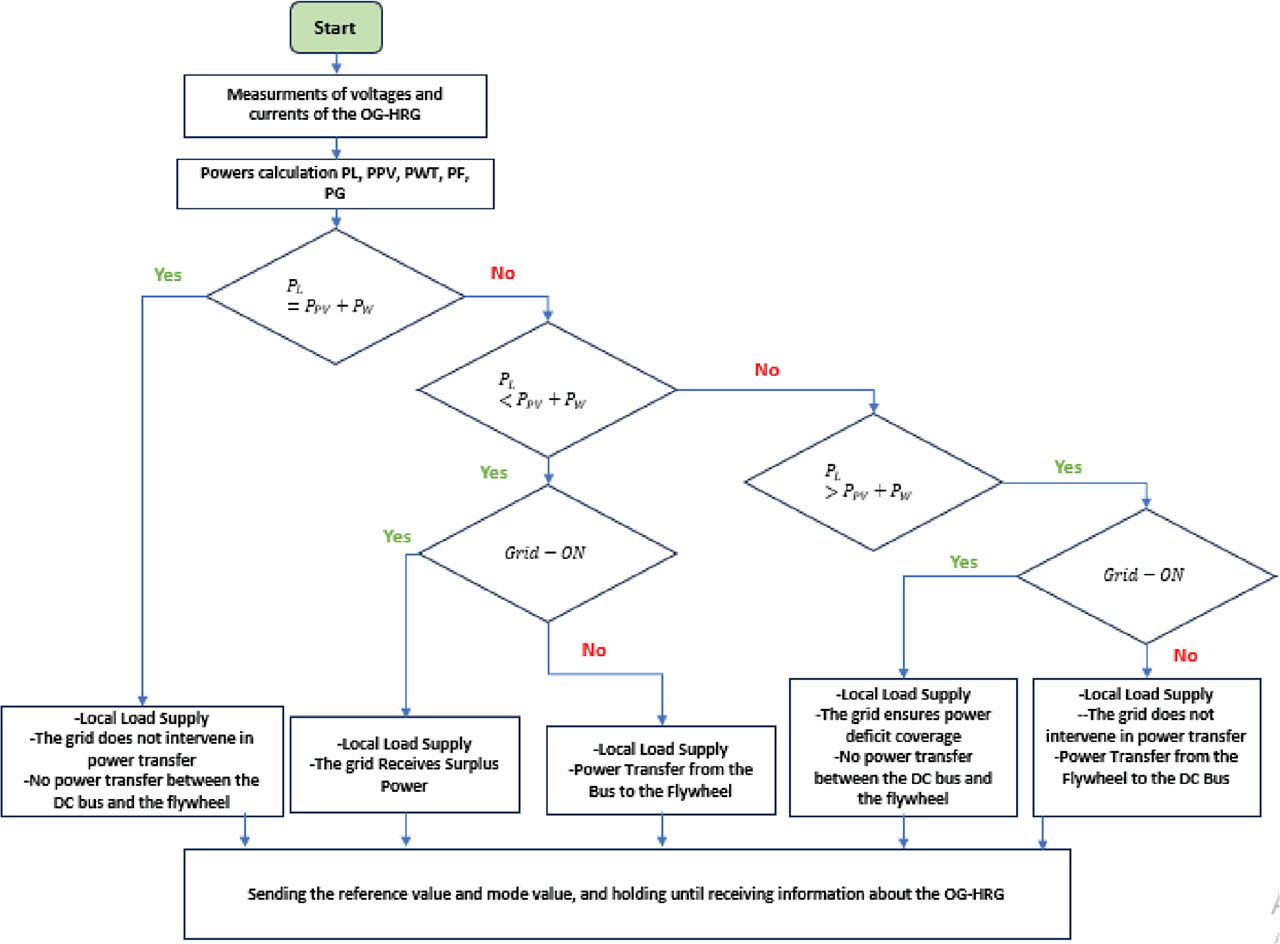
Fig. 9.
The flowchart of the EMS of the OG-HRG. EMS, energy management system; OG-HRG, on-grid hybrid renewable generation.
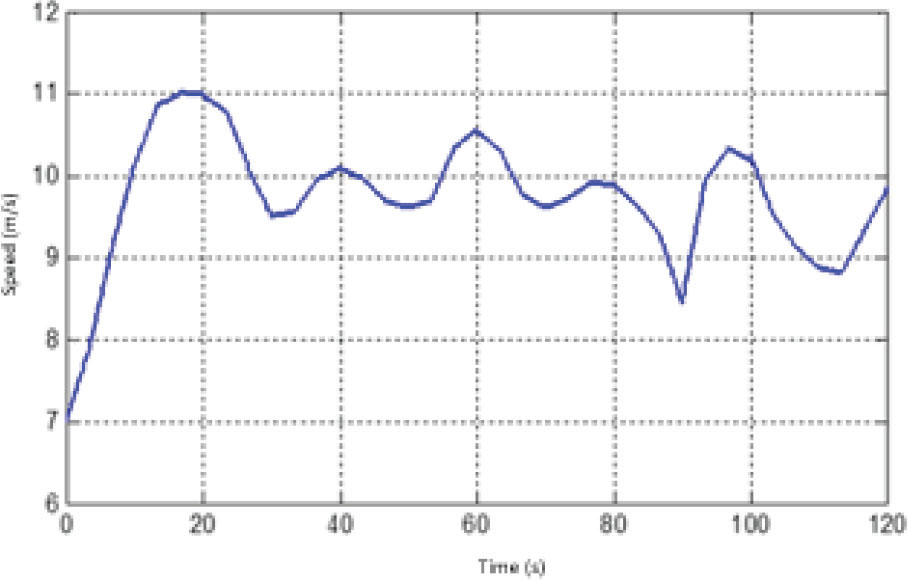
Fig. 10.
The wind profile.
Table 2.
The power balance for each operating mode.
| Operating mode | M3.1 | M3.2 | M3.1 | M5.1 | M5.2 | M4 | M5.1 |
|---|---|---|---|---|---|---|---|
| Time (s) | 13.5–14 | 14–14.5 | 14.5–15 | 15–15.5 | 15.5–16 | 16–16.5 | 16.5–17 |
| PL(W) | 960 | 2,750 | 960 | 960 | 3,960 | 0 | 960 |
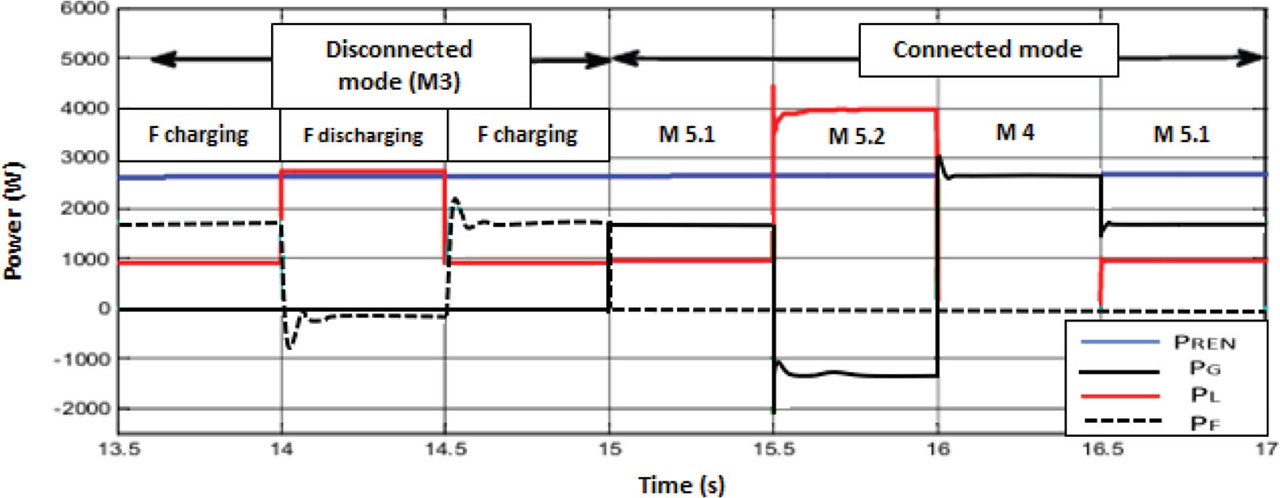
Fig. 11.
The powers supplied/absorbed by the subsystems for the different operating modes.
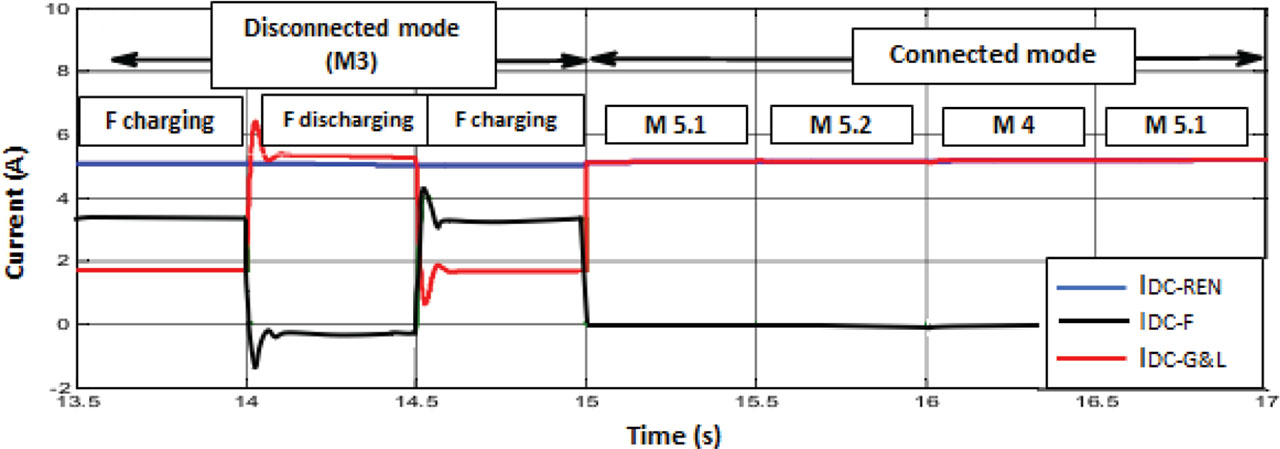
Fig. 12.
The variation of currents on the DC bus side.
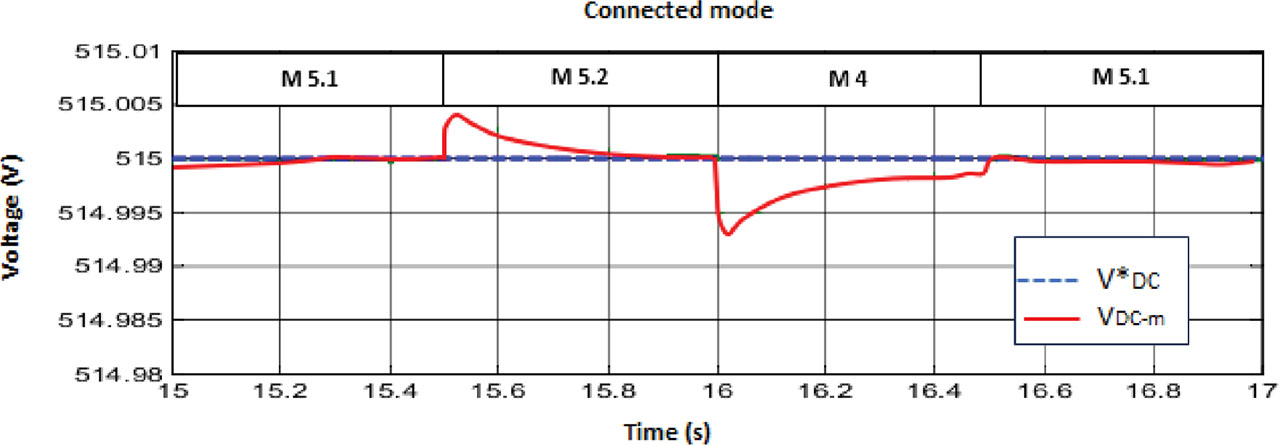
Fig. 13.
The variation of voltage on the DC bus side.
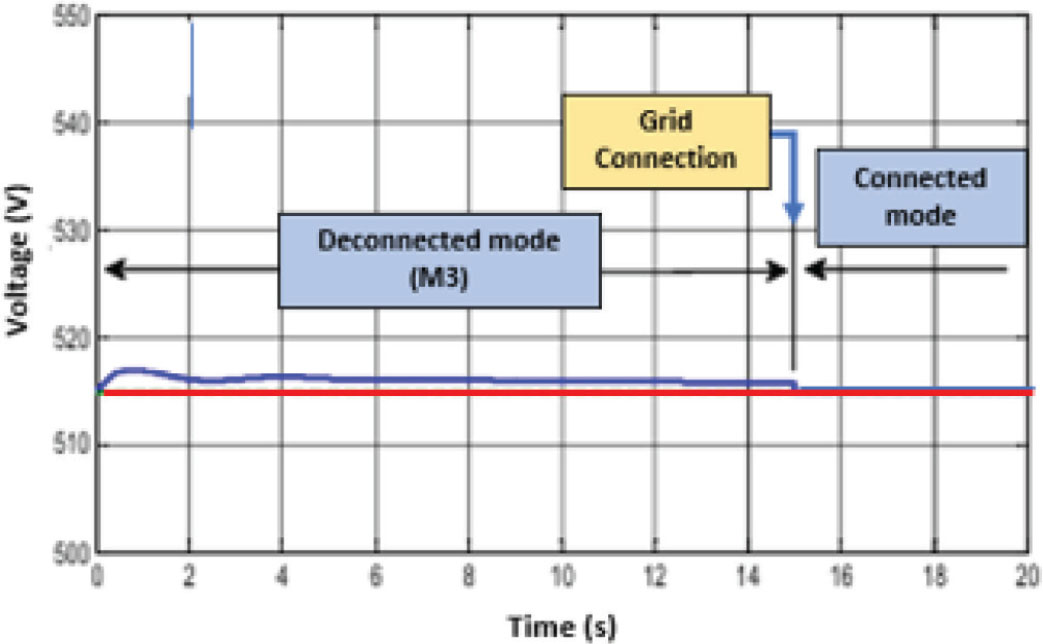
Fig. 14.
The DC-bus voltage waveform.
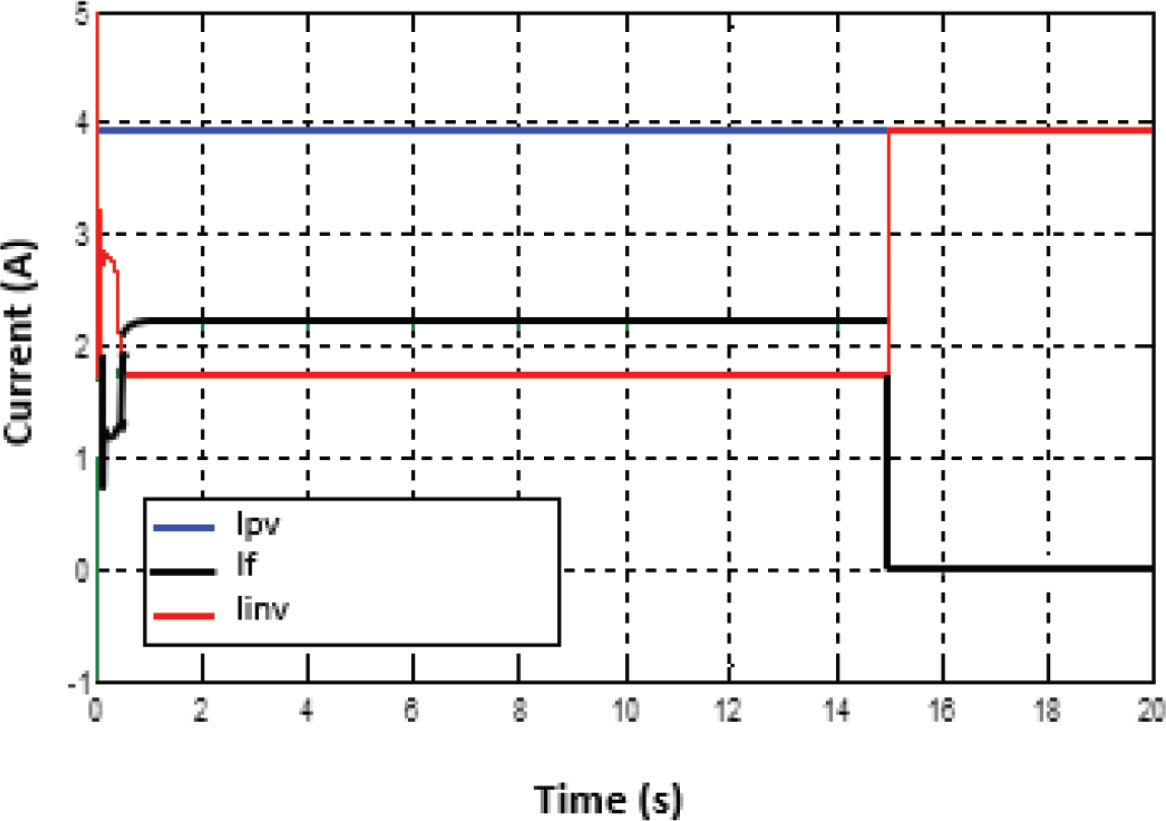
Fig. 15.
The PV, Flywheel and inverter current waveforms. PV, photovoltaic.
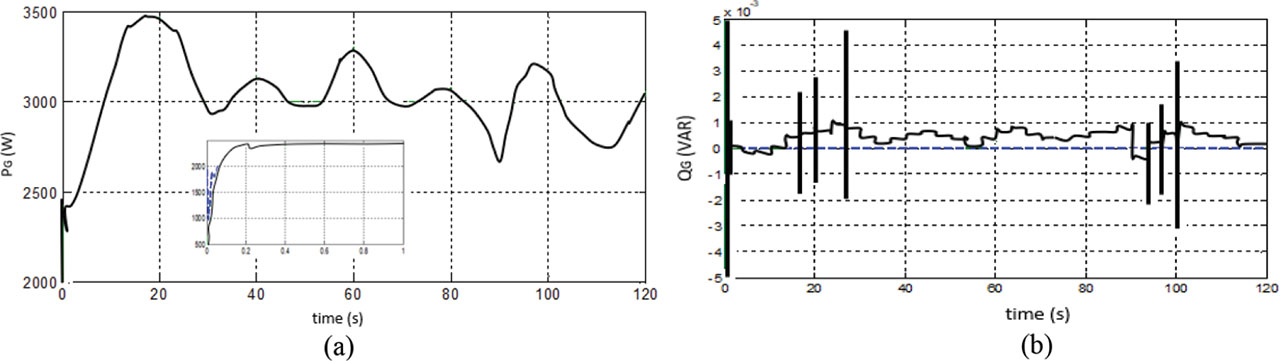
Fig. 16.
Profile of the active (a) and reactive (b) power injected into the grid.
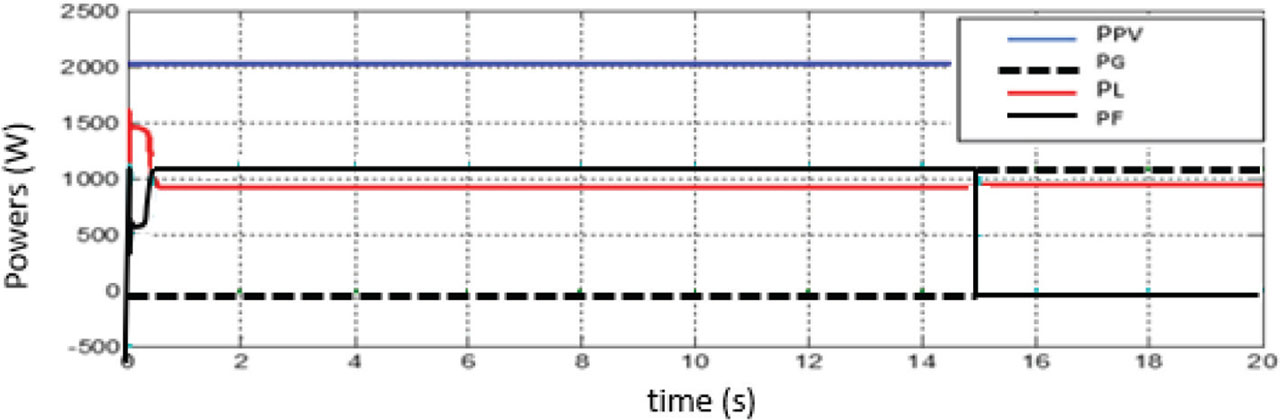
Fig. 17.
The power waveforms.
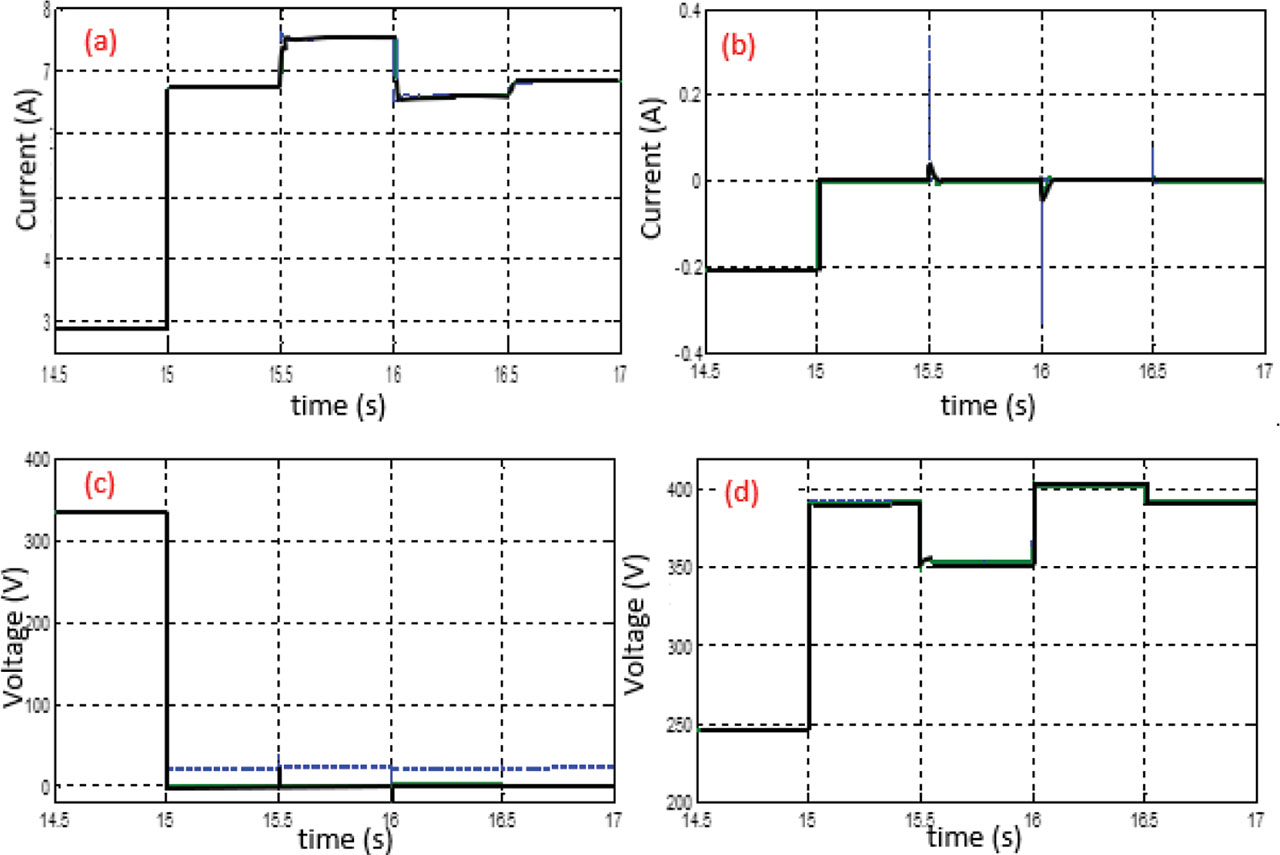
Fig. 18.
The direct and quadrature components of the currents and voltages Id (a), Iq (b), Vd (c) and Vq (d), (simulated and reference) waveforms.
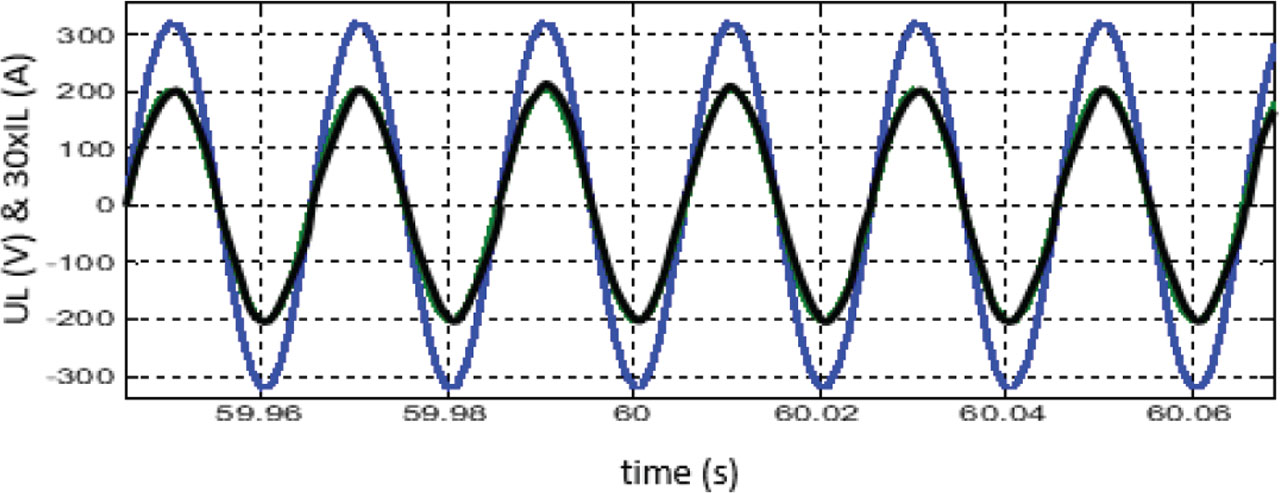
Fig. 19.
The load voltage and (30×) load current waveforms.
Table 3.
Comparison with other studies.
| Paper reference | Energy source and storage | Performance summary |
|---|---|---|
| Our paper | Grid-connected PV/wind/flywheel | This system features a multi-layered control approach that combines FLC, PID control and SMC into a unified EMS. |
| Reference Lata-García et al. (2024) | Stand-alone PV/biomass/diesel/battery | The system consists of a 22 kW solar PV generator, a 1.5 kW biomass generator and a 12 kW diesel generator. Additionally, the battery bank includes 58 units, each with a capacity of 111 Ah, and the dispatch strategy employed is load tracking. |
| Reference Younsi et al. (2023) | Grid-connected wind/flywheel | This control system includes primary and secondary controllers. The primary stage uses a droop controller to optimise power flow in the resistive network, while the secondary stage employs an improved method to manage voltage and frequency fluctuations during signal disturbances. |