
Construction scheduling is the process of planning, organising and coordinating tasks—usually including construction managers, contractors and project owners—to ensure a project’s timely and scope-compliant completion (Kubečková and Smugala 2021). The construction scheduling process is complex and requires extensive expertise and collaborative efforts. It is commonly supported by software tools such as Microsoft Project (Microsoft Corporation), ASTA Power Project (Elecosoft), and Primavera (Oracle Corporation) (Han et al. 2017). Despite these tools’ advantages, State Highway Agencies (SHAs) often reject the baseline schedules submitted by contractors due to issues such as unrealistic activity durations, illogical sequencing, excessive float and non-compliance with project specifications (O’Brien 1993; Carson 2013). The baseline schedule, established at the planning stage of projects, serves as a benchmark for assessing overall progress and functions as a legally binding document (Hinze 2008; GAO 2012). Ensuring an accurate and realistic schedule baseline increases the ability to control and monitor project schedules, hence increasing the probability of completing construction projects on time (Abdelaty and Jamal 2022; Jamal et al. 2022). The responsibility of evaluating and utilising schedules prepared by contractors to ensure reliable planning lies with the SHAs (GAO 2012). However, most schedules are flawed and impractical because they fail to consider various crucial factors, such as weather conditions, contractor capabilities, resource availability, relationship constraints, logic complexity, accurate duration estimation and the incorporation of different calendars (Fisher and Rajan 1996; Elnagar and Yates 1997; Street 2000; Ballast and Popescu 2001; Hegazy and Menesi 2010; Bragadin and Kähkönen 2016; Risan et al. 2024). Disregarding such variables leads to impractical schedule baselines and hampers tangible project tracking.
To guarantee the timely completion of construction projects, monitoring the actual progress of projects and assessing any deviations and their potential effects on baseline schedules is necessary. Construction companies and agencies use daily work reports (DWRs) to track the ongoing advancement of projects by documenting and analysing data from construction sites. Comprehensive documentation of the contractor’s activities, completed tasks and any unexpected events or delays are consistently recorded as a component of the DWR. While the data from DWR can be analysed systematically to derive valuable insights regarding project schedules, such as deviations, sequencing problems, potential causes of delay and the accuracy and reliability of schedule baseline, it is frequently not fully utilised.
This study aims to assist SHAs in evaluating the efficacy of construction schedules in transportation projects, ensuring their timely completion. Besides, it furnishes SHAs with actionable recommendations to improve the baseline schedule review process. The objectives of this study are outlined as follows:
Assess the quality of baseline schedules using widely recognised metrics and best practices (BPs), aiming to identify schedule deficiencies that may affect project delivery in transportation and similar large-scale infrastructure projects.
Create as-built schedules from documented project records, demonstrating an approach that can be adapted for other public and private sector projects to enhance schedule reliability and transparency.
Apply the as-planned vs. as-built delay analysis method to detect discrepancies in baseline schedules, showcasing a method relevant to any project where baseline accuracy impacts time and resource management.
Analyse inconsistencies in schedule quality across multiple metrics, underscoring the need for a cohesive evaluation framework applicable to various project environments.
Provide actionable recommendations that inform schedule baseline evaluation processes, contributing to improved project tracking, control and timely delivery across diverse sectors and organisations.
This study uniquely combines the application of IRMs and GAO BPs to evaluate baseline schedule quality in real-world transportation projects. Unlike prior research that often focuses solely on theoretical metrics or case-specific guidelines, this study bridges a crucial gap by empirically testing these established standards within an SHA context. The research aims to provide SHA engineers and decision-makers with practical recommendations that enhance existing review processes, which are essential for ensuring realistic schedules that are crucial to timely project delivery.
Project scheduling is vital for successful project execution within the intended timeline. It requires employing knowledge, expertise, and intuition to integrate and organise various project components, including activities, resources, and logical connections (GAO 2012). A comprehensive schedule plan illustrates the timing and delivery of specific products, services, and outcomes within the project’s scope. It is useful for managing stakeholders’ expectations, facilitating communication and reporting performance (PMI 2008).
Several organisations, such as the GAO, Project Management Institute (PMI), Office of Facilities Planning and Construction (OFPC), National Defense Industrial Association (NDIA) and Department of Defense (DOD), have established BPs for developing accurate baseline schedules. These organisations have also recommended monitoring and controlling the schedule throughout the project lifecycle (DOD, 2005; OFPC, 2011; PMI, 2011; GAO, 2012; NDIA, 2016). GAO (2012) has identified four key characteristics of an excellent and reliable schedule: comprehensiveness, sound construction, credibility and control. To incorporate these attributes, a project schedule should adhere to various BPs to ensure the quality of the baseline schedules. For instance, it is imperative to create schedules aligned with the project’s work break-down structure (WBS), and the activities in the schedule should be connected to project documents through activity or task codes. Furthermore, it is essential to establish a schedule that adheres to crucial project deadlines and to sequence activities logically to accomplish them (GAO 2012). By following GAO’s guidelines on scheduling BPs, it is easy and direct to assess schedules and identify areas for improvement. Therefore, this research study adopts GAO standards to evaluate schedule reliability.
While numerous studies have explored individual aspects of schedule quality and delay analysis, there is limited research combining both GAO BPs and IRMs in baseline schedule evaluation, particularly within the specific context of SHAs. Existing methods often lack a holistic framework encompassing compliance with established standards and practical evaluation metrics to ensure robust schedule quality. This gap is especially pertinent for transportation projects, where realistic scheduling is critical to mitigating delays and managing resources effectively. This study addresses this gap by combining GAO and IRM criteria to evaluate baseline schedules in real-world SHA projects, offering a practical approach that bridges theoretical standards with applied project needs.
In order to compare baseline and as-built schedules, schedule delay analysis can be employed to determine key differences. Various schedule delay analysis methods differ in simplicity, methodology, required inputs and reliability. These methods include the global impact method, net impact technique, as-planned method, window analysis, artificial neural network method, regression analysis and apportionment delay method (Zack 1992; Ng et al. 2004; Arcuri and Hildreth 2007; Braimah and Ndekugri 2009; Al-Gahtani and Mohan 2011; Abdelhadi 2015). The effectiveness of applying a particular delay analysis method is highly dependent on the availability of data, the complexity of the project and the simplicity of the delay analysis method. Therefore, when there is a scarcity of scheduling data, certain methods like the as-planned, as-built and as-planned vs. as-built methods can be regarded as more straightforward. The as-planned method compares the baseline schedule and delay events to evaluate the impact of delay events on the baseline schedule (Al-Gahtani and Mohan 2011). On the other hand, the as-built technique examines delays by comparing the baseline schedule with the actual dates of starting and finishing tasks (Al-Gahtani and Mohan 2011). The as-planned vs. as-built method assesses delays by comparing the baseline and as-built schedules (Arditi and Pattanakitchamroon 2006). The as-planned vs. as-built method is commonly used in litigation due to its simplicity, ease of use and flexibility (Abdelhadi 2015).
Moreover, apart from the methods above, research studies have investigated schedules to propose a structured methodology to help owners evaluate the accuracy and reliability of schedules (Fruchtman 2000; Dzeng et al. 2005; Lucko 2009). As an illustration, Dzeng et al. (2005) devised a module-based schedule generation and review methodology to assist reviewers in assessing the accuracy and dependability of schedules. Additionally, the study integrated a list of standardised regulations based on schedule review practices to automatically and consistently review schedules (Dzeng et al. 2005). Moreover, Lucko (2009) proposed an analysis approach to analyse linear schedules using singularity functions. The model distinguishes between duration and quantity buffers, which has implications for defining and deriving the critical path (Lucko 2009). Arguably, the as-planned vs. as-built method is widely considered a straightforward approach employed to determine delays. Besides, it is regarded as a suitable method for uncomplicated projects with a restricted number of activities. Moreover, the as-planned vs. as-built approach is appropriate when project documentation is lacking. The method allows for a transparent and clear comparison between baseline and as-built schedules (Zafar 1996; Fruchtman 2000; Lovejoy 2004; Arditi and Pattanakitchamroon 2006; Ekanayake and Perera 2016). Therefore, the as-planned vs. as-built method is used to compare baseline and as-built schedules to achieve the objectives of this study.
Current studies consistently emphasise the importance of precise and practical schedules for construction projects. For instance, Kumar et al. (2023) identified significant factors that affect project performance, many of which rely on efficient scheduling. To develop reliable schedules, Tirataci and Yaman (2023) examined how to determine the optimal project durations early on, while Panas et al. (2023) contrasted productivity forecasting techniques. To avoid delays, Kapote et al. (2023) again underlined the importance of early contractor pre-qualification. These findings support the necessity of data-driven, pragmatic strategies like those employed in our framework that combine GAO BPs with IRMs. These recent contributions complement our study’s dual-frame-work approach (IRMs and GAO BPs) by reinforcing the importance of integrating quantitative scheduling assessments with practical planning insights to improve baseline schedules’ reliability and approval rate in public infrastructure projects.
This research was conducted in three distinct phases: (i) data collection, (ii) data analysis and (iii) results and recommendations (Figure 1). During Phase I, datasets, including the DWRs and baseline schedules, were collected from one SHA. Phase II consists of three different tasks. The initial task is to integrate the DWR data and the baseline schedules to create accurate as-built schedules. Next, analyse and contrast the baseline and as-built schedules to determine any discrepancies or deficiencies in the baseline schedules. The third task evaluates the baseline schedule using GAO BPs and IRMs. During Phase III, the recommendations for improving the quality of the schedule baseline were synthesised based on the findings from the baseline evaluations.
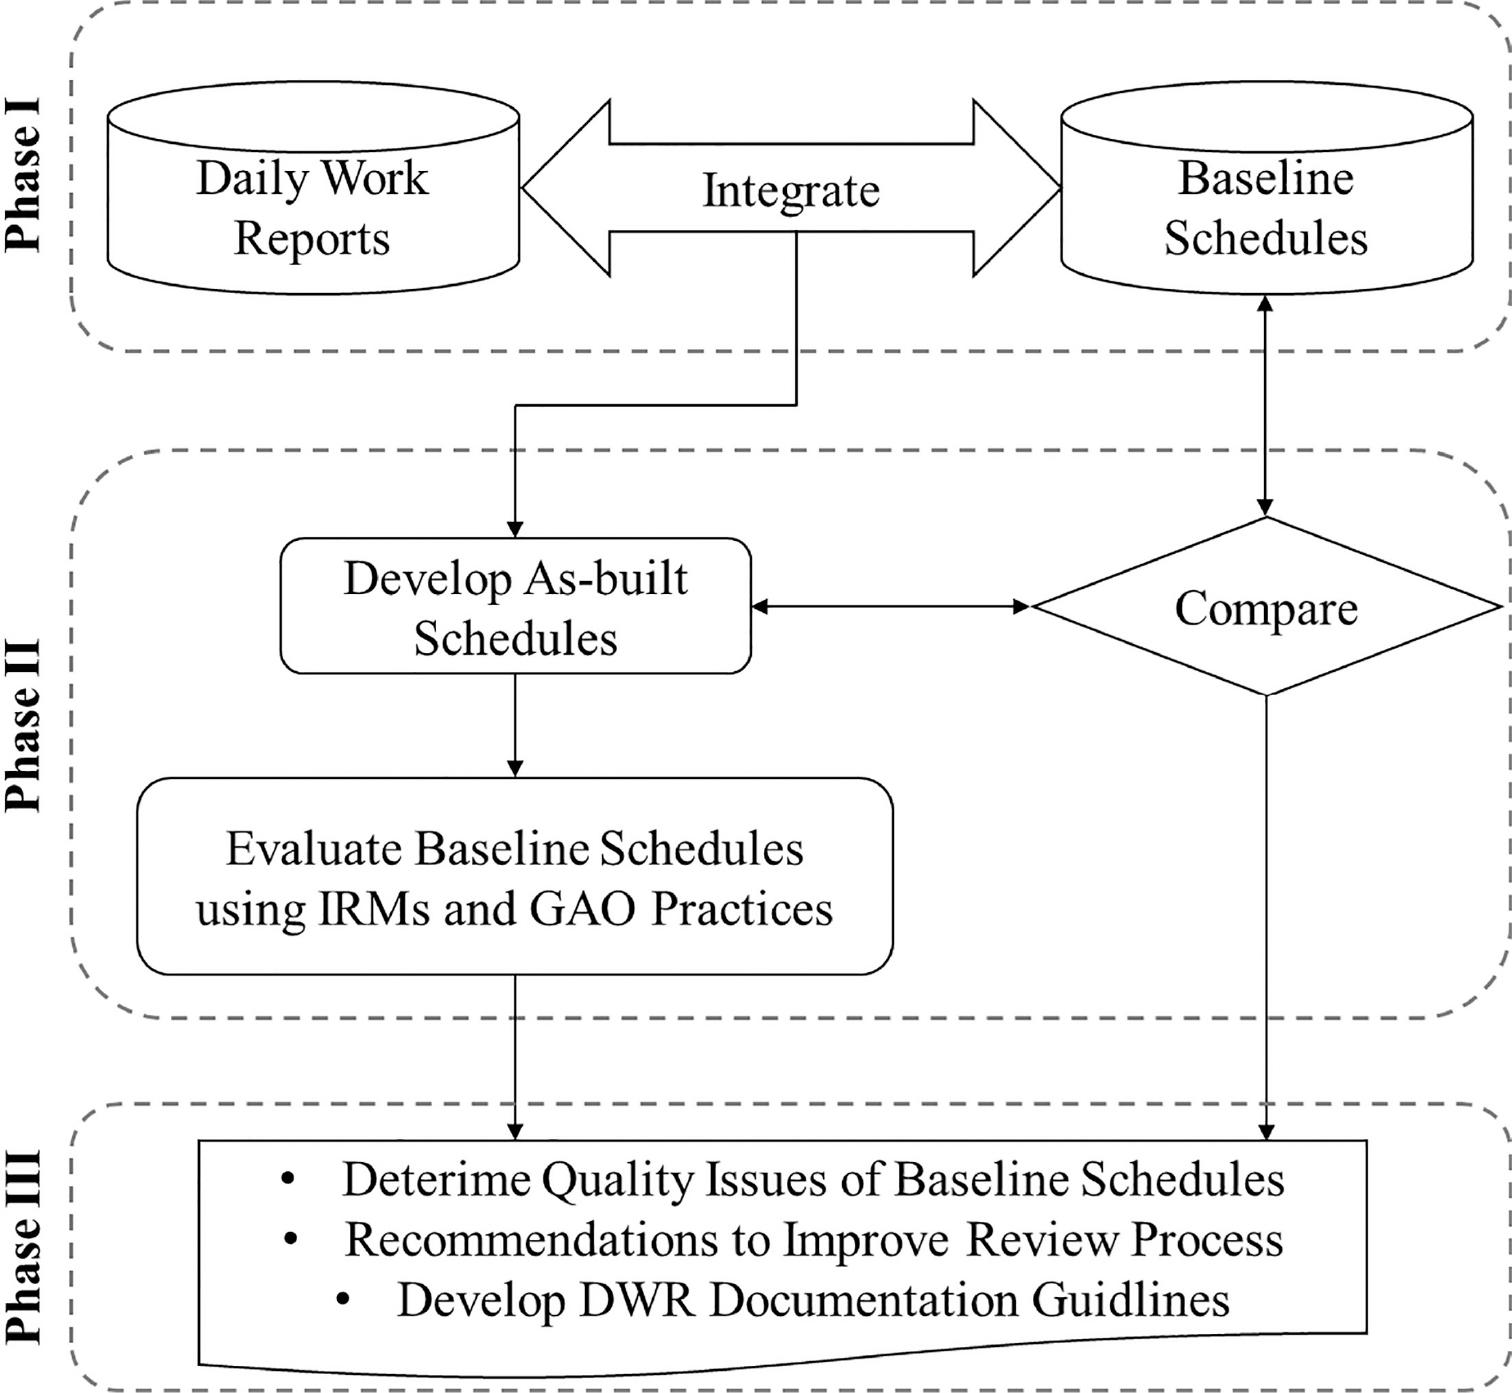
Research methodology. DWR, daily work reports; GAO, Government Accountability Office; IRMs, industry-recognised metrics.
In Phase I, the schedules and DWR data for four transportation projects were collected from the SHA of the United States. The DWR data includes project ID, DWR date, work suspension times (stop and go date and time), contractor presence (workforce numbers), change orders, location, weather information, delay causes and each activity’s start and end date and time. Four transportation projects were selected for this research study based on two primary criteria: (1) data availability and (2) representation of the most prevalent project types. Data availability refers to the completeness of the record regarding DWR and baseline schedule. On numerous occasions, the DWR for projects lacked vital information that would hinder the achievement of the research objectives. Thus, project selection for case studies primarily depended on data and record completeness. The second criterion for selecting the case studies is to choose more generic projects representing the typical work of the SHA, such as highway maintenance and rehabilitation projects. The baseline schedule for these specific projects consists of major activities such as crushing and stockpiling crushed surfacing material, fencing, median cable barrier, draining, milling plant mix, lane rental, installing signs, rockfall mitigation, pavement markings, bituminous pavement surfacing and miscellaneous works. The four projects amounted to a total of $23.43 million. The individual project values ranged from $1.88 million to $14.63 million, with project lengths varying between 1.3 miles and 7.0 miles. The scope of work included a mix of new construction, maintenance and rehabilitation, involving tasks such as grading, chip sealing, concrete pavement replacement, curb and gutter installation, electrical work and sidewalk improvements.
Phase II involves analysing the gathered data, which encompasses two distinct tasks: utilising Phase I data (Baseline schedules and DWRs) to develop practical and accurate as-built schedules. The next step is to analyse and contrast the baseline and as-built schedules to determine any discrepancies or deficiencies in the baseline schedules. The final step is to evaluate the as-planned schedules by employing IRMs and GAO scheduling practices. The subsequent sections will comprehensively explain the various analysis methods used in Phase II.
First, the DWR data was extensively analysed along with the baseline schedules to identify, verify and define significant construction activities, their durations, their relationships and any potential weather events that could affect the construction process. The DWR data included the work date, a textual description of the work performed, problems encountered and site conditions. For example, a single DWR contains the following information: ‘Subcontractor X is on-site placing grinding for thermoplastics. It snowed last night, so Subcontractor X is only grinding today and will place thermoplastics tomorrow’. This DWR contextual data helps determine the type of activity being undertaken and the reasoning behind the as-built schedule sequence change. Additionally, the start and finish times of the activities can be determined by chronologically analysing DWRs. Other DWR data may also include weather-related disruptions, such as ‘rain prevented concrete pour, and it was called an early day’, ‘no work today because of snow and wind’, or ‘discovery of sinkhole that caused work to stop’. This provided a comprehensive understanding of the project’s activities, timeline and constraints.
Furthermore, employing the DWR analysis and information extraction described above, an as-built schedule was created using the Microsoft Project software. This schedule was formulated using information extracted from the DWR and comprised detailed timelines for each construction activity, along with dependencies and critical paths. Finally, the as-built vs. as-planned delay analysis method was performed to compare the schedules and identify any gaps in the project scope, variations in the duration of tasks and discrepancies in relationships between the various tasks.
To identify any modifications or additions to the project scope, a thorough examination of all change orders and related correspondence with the contractor was conducted, considering any specific alterations that may have been made. Subsequently, this study carried out the As-built vs. as-planned analysis in three distinctive procedural steps: (1) Activity comparison, (2) Relationship comparison and (3) Duration comparison. The activity comparison assesses the activities in the as-planned schedule and compares them to those in the as-built schedule, derived from the DWR data. The purpose is to identify any missing or changed scope elements in the as-planned schedule. The relationship comparison seeks to evaluate the validity of relationships between activities in the as-planned schedule by analysing the on-site work sequence according to the DWR. Finally, the duration comparison examines the difference between the baseline duration stated in the as-planned schedule and the actual duration calculated from the DWR data and incorporated in the as-built schedule.
This study conducted a review of existing literature and compiled a comprehensive list of IRMs that are commonly used to assess schedule quality (DOD 2005, 2012; CEVM 2008; PMI 2008, 2011; Naval Air [NAVAIR], 2010; DAU 2011; GAO 2012; NDIA 2016; Han et al. 2017). These metrics are categorised and presented in Table 1. The list was formulated by classifying the metrics of schedule quality into seven primary categories inspired by the work of Han et al. (2017). The quality of the schedule is assessed by evaluating each category using one or more metrics. The main categories utilised to measure the caliber of the schedule are as follows:
- –
General: This category measures the overall consistency of communication regarding the general information of the schedule, such as task project identifier, project name, task identifier, task name, WBS references, realistic start date for tasks and level of effort (LOE) activities.
- –
Milestone: This category assesses the communication of the necessary milestones in the schedule, either in a detailed or summary format.
- –
Duration: This category examines the validity and practicality of the activities’ durations and scope representation.
- –
Calendar: This category focuses on correctly using project calendars to account for non-working days, such as holidays.
- –
Logic: This category evaluates the validity of the relationships between activities and the proportion of activities on the critical path within the schedule.
- –
Float: This category examines the rationality of the total float of activities.
- –
Lag: This category evaluates the logical justification of the duration of the lags incorporated into the schedule.
IRMs for evaluating baseline schedules.
| Major category | ID | Metrics | Calculation | References |
|---|---|---|---|---|
| General: General metrics are those used to verify scheduling information in general. | G001 | Project ID | Is there a special project identifier for each project? | PMI (2011), OFPC (2011), GAO (2012) and Han et al. (2017) |
| G002 | Project name | Does a project have a special name? | OFPC (2011), PMI (2011) and Han et al. (2017) | |
| G003 | Task ID (unique) | (Number of tasks using different task I.D.s)/(total number of tasks) | OFPC (2011), PMI (2011), GAO (2012) and Han et al. (2017) | |
| G004 | Task name (unique) | (Number of tasks having unique names)/(total number of tasks) | OFPC (2011), GAO (2012), NDIA (2016) and Han et al. (2017) | |
| G005 | Task name (descriptive name) | (Number of tasks having descriptive names)/(total number of tasks) | OFPC (2011), GAO (2012), NDIA (2016) and Han et al. (2017) | |
| G006 | WBS element ID/reference | (Number of tasks having a WBS ID)/(total number of tasks) | PMI (2011), GAO (2012), OFPC (2011) and Han et al. (2017) | |
| G007 | Starting/finishing tasks on weekends or holidays | (Number of tasks starting or ending on a weekend or holiday)/(total number of tasks) | OFPC (2011), GAO (2012) and Han et al. (2017) | |
| G008 | LOE task | (Number of LOE tasks on the critical path)/(total number of tasks) | DOD (2005), GAO (2012) and Han et al. (2017) | |
| Milestones: Milestones are metrics used to verify information about milestones. | M001 | Milestone definition | (Number of detail tasks)/(total number of milestones) | GAO (2012) |
| Duration: The duration category includes the measurements for verifying duration data. | D001 | High duration | (Number of tasks whose durations are longer than 44 working days)/(total number of tasks) | DOD (2005), PMI (2011), GAO (2012), NDIA (2016) and Han et al. (2017) |
| Calendar: The metrics used to verify submitted to the calendar are classified as a calendar. | C001 | Project calendar | Is a project calendar available? | PMI (2011), GAO (2012), NDIA (2016) and Han et al. (2017) |
| C002 | Holidays | Do project calendars include holidays and exceptions? | OFPC (2011), GAO (2012), NDIA (2016) and Han et al. (2017) | |
| Logic: The metrics for verifying data pertaining to logic in a schedule are classified as logic. | L001 | Basic relationship (missing predecessor or successor) | (Number of tasks missing a pre-decessor or successor)/(total number of tasks) | DOD (2005), OFPC (2011), PMI (2011) and NDIA (2016) |
| L002 | Basic relationship (missing predecessor and successor) | (Number of tasks missing a predecessor and successor)/(total number of tasks) | DOD (2005, 2012), CVEM (2008), NAV (2010), OFPC (2011), PMI (2011), DCMA (2012), GAO (2012) and NDIA (2016) | |
| L003 | Percentage of tasks on the critical path | (Number of activities on the critical path)/(total number of activities) | DOD (2005) and Han et al. (2017) | |
| Float: The measurements used to verify information about float fall under this category. | F001 | High total float | (Number of activities over 44 working days total float)/(total number of activities) | DOD (2005), GAO (2012), NDIA (2016) and Han et al. (2017) |
| Lag: Lag metrics are defined as measurements used to verify information about lag. | La001 | Long lags | (Quantity of lags >30 working days)/(total number of links between activities) | DOD (2005) and Han et al. (2017) |
IRMs, industry-recognised metrics; LOE, level of effort; WBS, work breakdown structure.
Each metric within each category was assigned one or more questions or a calculation method to evaluate it. Following this objective process, the metrics within these categories were employed to assess the quality and identify any potential issues with the baseline schedules.
In addition to the schedule evaluation metrics derived from previous studies, this study incorporates the GAO BPs to evaluate the quality of baseline schedules and provide recommendations for enhancing their quality. This research study adopts the GAO practices, recognised as established governmental standards, to evaluate schedules. These practices offer comprehensive guidance on creating reliable project schedules, which promotes transparency and accountability. The GAO scheduling BPs were derived from extensive independent research conducted to improve the dependability of project schedules in the government sector. The top seven BP types were closely aligned with the activities of the selected baseline schedules. The GAO (2012) recommended BPs can be summarised as follows:
- –
BP #1: This BP necessitates comprehensively recording all activities, encompassing all effort, WBS, activity names, and activity codes. A schedule is a formal agreement for executing a program. Therefore, it should reflect all activities (steps, events, required work and outcomes) to accomplish the specified deliverables outlined in the program’s WBS.
- –
BP #2: This BP involves the following requirements: sequencing all activities, establishing predecessor and successor logic, addressing incomplete and dangling logic, incorporating summary logic, considering data constraints, using lags and leads and ensuring path convergence in the baseline schedules.
- –
BP #3: This BP encompasses allocating resources to all activities, estimating resource effort and duration, loading activities with resources and resource-leveling.
- –
BP #4: This practice includes determining the duration of all activities, such as estimating their durations and creating calendars.
- –
BP #5: This BP mandates schedulers to develop baseline schedules that can be traced horizontally and vertically.
- –
BP #6: This BP requires schedulers to verify the critical path’s accuracy.
- –
BP #7: This BP mandates that schedulers ensure that the total float is reasonable in relation to the project duration. Float management is also included in this practice.
Each GAO BP encompasses several measures to ensure schedule reliability. For instance, BP#1 includes metrics such as the count of activities lacking a descriptive name, the proportion of activities compared to milestones and the number of activities with duplicate names. BP #2 encompasses measures such as the count of dangling activities. BP #5 qualitatively assesses consistency by evaluating if the dates of activities align with the time-frame of summary-level tasks (GAO 2012). Although the GAO practices provide both qualitative and quantitative measures to achieve each BP, they do not set a specific threshold that must be met to pass each measure and achieve the BP.
The findings underscore the importance of adopting IRMs and GAO BPs concurrently, as each offers unique insights into baseline schedule quality that the other may over-look. Using this combined framework, this study identifies previously undetected deficiencies in baseline schedules that could impact project timelines and resource allocation. This combined application, therefore, represents a novel contribution to the field of construction project management. The results of this study are organised into four subsections, each corresponding to a specific stage of data analysis: (a) baseline vs. as-built schedule analysis, (b) baseline schedule evaluation using IRMs, (c) baseline schedule evaluation using GAO BPs and (d) variations of GAO BPs and IRMs.
This analysis compares the baseline schedule and the as-built schedule. Figure 2 compares the baseline and as-built analysis for Project I (see Appendices for Projects II to IV). This figure depicts five main differences high-lighted in boxes 1–5. First, the baseline schedule demonstrates variations in the duration of multiple activities. For instance, the chip seal process was originally scheduled to take 2 days but actually took 4 days. The second box displays the delay in days, which is determined by subtracting the planned project duration (baseline) from the actual project duration (as-built). The third box shows an illustration of additional activities that were detected from the DWR but were not incorporated into the baseline schedule. The fourth box highlights unreasonable float values resulting from the absence of relationships in the original schedule. Finally, the fifth box identifies the absent connections in the Gantt chart of the baseline schedule.
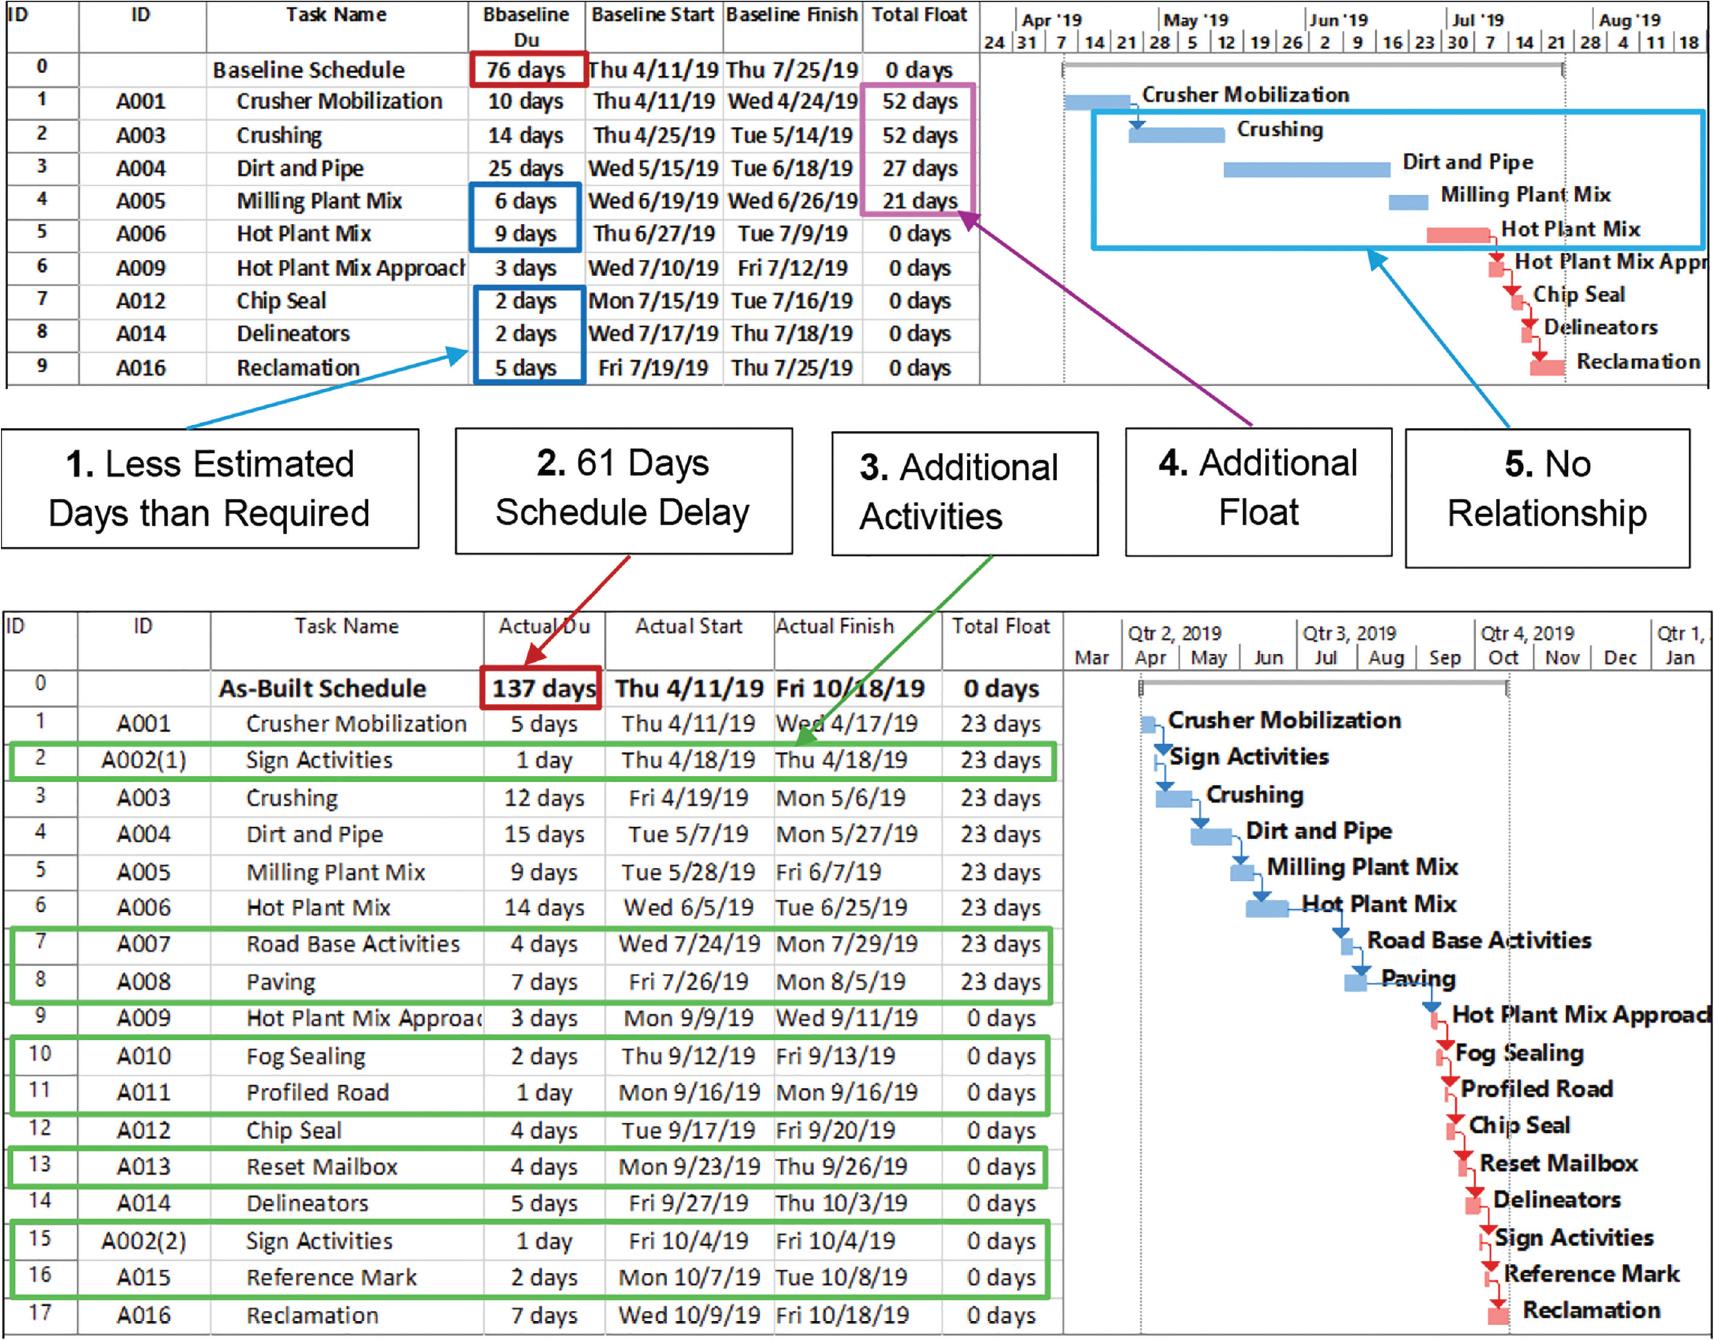
Baseline vs. as-built schedule analysis for Project I.
For Project I, the baseline duration was 76 days, the actual duration was 137 days and the schedule delay was 61 days; for Project II, the baseline duration was 52 days, the actual duration was 120 days and the schedule delay was 68 days; for Project III, the baseline duration was 69 days, the actual duration was 87 days and the schedule delay was 18 days; for Project IV, the baseline duration was 52 days, the actual duration was 87 days and the schedule delay was 35 days. Additional supporting figures related to the baseline schedule evaluation are provided in Appendix Figures 3–5.
The analysis revealed discrepancies in the number of activities between the baseline and AS-as-built schedules. As an illustration, the first case study project consists of nine activities in the baseline schedule and 17 activities in the as-built schedule. In addition to the main baseline activities, eight additional activities in the as-built schedule were missing. These activities include sign activities A002(1), road base activities A007, paving A008, fog sealing A010, road profiling A011, resetting mailbox A013, sign activities A002(2) and reference mark A015.
The analysis also showed several changes and/or missing relationships between the activities in the baseline schedule. For example, the activities crushing A003, dirt and pipe A004, milling plant mix A005 and hot plant mix A009 were not related. However, in the as-built schedule, all activities were linked in a finish-to-start (FS) relationship based on the information provided in the DWR. Missing relationships and relying on constraints to schedule activities may invalidate the critical path. Therefore, contractors and SHAs may face difficulties in effectively monitoring and documenting the progress of projects when there are missing relationships.
The project schedule delay analysis revealed variations in several activities compared to the baseline schedule. Activities such as crusher mobilisation A001, crushing A002 and dirt and pipe A004 were completed 19 days ahead of schedule. Nevertheless, milling plant mix A005, hot plant mix A006, chip seal A012, delineators A014 and reclamation A016 took 17 days more than the scheduled time. The hot plant mix approach A009 was completed according to the baseline schedule. Additionally, including eight extra activities in the as-built schedule resulted in a project extension of 22 days. Consequently, four activities in the baseline schedule, namely crushing mobilisation A001, crushing A002, dirt and pipe A004 and milling plant mix A005, had a combined float time of 152 days. Hence, the analysis identified gaps in activity execution that contributed to a project delay of 61 days.
Upon careful examination of the disparities between the baseline and as-built schedules, it was observed that several days were identified as non-working days in the DWR without any accompanying specifics. For instance, certain DWRs indicate ‘no work on site’ without explaining the cessation of work. Therefore, these days were designated as non-working days without explicit explanation. Hence, it is imperative to scrutinise additional project documents, such as correspondence and change orders, to ascertain the reason behind the work stoppage during those days. Therefore, these additional documents were retrieved from the SHA document management system to accurately capture the project status by augmenting the information in the DWR. Identified project delays are attributed to unnecessary/unexplained lags between activities, irregular activity sequences and unidentified causes for halting the project work on a particular day. Moreover, the comparison revealed that the estimated durations of the activities in the baseline schedules were impractical, potentially resulting in scheduling errors and project delays.
The quality of the baseline schedules of the four case studies was assessed by evaluating the 17 different IRMs presented in Table 1. Table 2 presents the findings from the assessment of schedule metrics for the four case studies. The table presents each metric, its corresponding threshold, and the evaluation results of the projects. Each metric was evaluated using a binary pass or fail criterion (Yes/No), or a scale ranging from 0% to 100%. This study reveals that over 64% of the metrics groups successfully meet the threshold. Nonetheless, there were issues concerning the descriptive task names, WBS element identifiers, missing predecessors, missing successors, milestones and long lags.
Evaluation of baseline schedules using IRMs.
| ID | Metric | Threshold | Project I | Project II | Project III | Project IV |
|---|---|---|---|---|---|---|
| G001 | Project identifier | Yes | Yes | Yes | Yes | Yes |
| G002 | Project name | Yes | Yes | Yes | Yes | Yes |
| G003 | Task identifier (unique) | 100% | 100% | 100% | 100% | 100% |
| G004 | Task name (unique) | 100% | 100% | 73.33% | 100% | 100% |
| G005 | Task name (descriptive name) | 100% | 0% | 0% | 0% | 0% |
| G006 | WBS element identifier | 100% | 0% | 20% | 0% | 0% |
| G007 | Starting tasks on weekends or holiday | 0% | 0% | 0% | 0% | 0% |
| G008 | LOE task | 0% | 0% | 0% | 0% | 0% |
| M001 | Milestone definition | 100% | 0% | 0% | 0% | 0% |
| D001 | High duration > 44 days | 5% | 0% | 0% | 0% | 0% |
| C001 | Project calendar | Yes | Yes | Yes | Yes | Yes |
| C002 | Holidays | Yes | Yes | Yes | No | Yes |
| L001 | Basic relationship (missing predecessor or successor) | 0% | 22.22% | 0% | 0% | 62.5% |
| L002 | Basic relationship (missing predecessor and successor) | 0% | 22.22% | 0% | 100% | 12.5% |
| L003 | Percentage of tasks on the critical path | 95% | 100% | 100% | 100% | 83% |
| F001 | High total float > 44days | 5% | 0% | 0% | 6.25% | 31.25% |
| La001 | Long lags > 30 days | 5% | 25% | 0% | 6.25% | 0% |
| Pass | 11 (64.7%) | 13 (76.47%) | 10 (58.82%) | 10 (58.82%) | ||
| Fail | 6 (35.3%) | 4 (23.53%) | 7 (41.18%) | 7 (41.18%) | ||
| Total | 17 (100.0%) | 17 (100.0%) | 17 (100.0%) | 17 (100.0%) |
IRMs, industry-recognised metrics; LOE: Level of effort; WBS, work breakdown structure.
It can be observed that the passing rate of the four projects varies from 58% to 76%. Project II boasts the highest overall passing rate, standing at approximately 76%. Project II was found to lack descriptive task names, complete WBS element identifiers and unique task names, and had milestones-related issues. Regarding Project III, around 58% of the metrics meet the necessary threshold. Unfortunately, the schedule of this project was unsuccessful because of the short-comings in the descriptive task name, WBS element identifier, milestone definition, holidays, missing predecessor and successor, total float and long lags. The score of Project IV was similar to that of Project III. The percentage of tasks on the critical path for Project IV was acceptable. However, the total float was unreasonably long. None of the four projects were successful in the descriptive task names, WBS element identifier and milestone definition groups.
The current study also analysed the baseline schedules of the four projects by assessing their adherence to the BPs recommended by GAO. The GAO BP assessment only assigns a binary score (pass or fail) to each BP. Table 3 shows the evaluation of the four projects across the seven GAO BPs. It can be observed that the baseline schedule of Project II demonstrates the highest passing score of 71.43%.
Evaluation of baseline schedules using GAO BPs.
| Practice name | Project I | Project II | Project III | Project IV |
|---|---|---|---|---|
| BP #1: Capturing all activities | × | ✓ | × | ✓ |
| BP #2: Sequencing all activities | × | ✓ | × | ✓ |
| BP #3: Assigning resources to all activities | × | × | × | × |
| BP #4: Establishing the duration of all activities | ✓ | ✓ | ✓ | ✓ |
| BP #5: Verifying that the schedule can be traced horizontally and vertically | × | ✓ | × | ✓ |
| BP #6: Confirming that the critical path is valid | × | ✓ | × | × |
| BP #7: Ensuring reasonable total float | × | × | × | × |
| % of satisfied requirements | 14.29% | 71.43% | 14.29% | 57.14% |
BPs, best practices; GAO, Government Accountability Office.
The evaluation of the baseline schedule of Project II revealed that resources were not assigned to all activities and float information was missing. Furthermore, the baseline schedules of Projects I and III did not satisfy 86% of the seven BP requirements. The main shortcomings of the four projects were their failure to meet the BPs BP#3 and BP#7. However, all projects successfully fulfill the requirements of BP BP#4, while only half of the projects satisfy BPs BP#1, BP#2 and BP#5. Projects II and IV meet the requirements with a score of over 50%.
Based on the analysis of baseline schedule quality, it has been concluded that the quality of the selected baseline schedules was insufficient to accurately convey the sequence of work, scope of work and control of the schedule. Further enhancements are necessary to ensure that baseline schedules accurately reflect the requirements and can effectively steer projects towards their successful completion.
The use of the GAO practices and the IRMs is essential to evaluate the reliability and accuracy of project schedules. One key distinction between the GAO practices and the IRMs is establishing threshold values for evaluation measures. For example, the IRMs set a maximum limit of 5% for long-duration activities. Establishing thresholds to evaluate a schedule using various metrics enhances the evaluation process by introducing a more realistic and objective approach.
The second fundamental difference between the GAO practices and IRMs lies in the GAO practices’ ability to accurately assess the reliability of a schedule, particularly when comparing baseline and as-built schedules. This is achieved by ensuring the schedule is comprehensive, well-constructed, credible and controlled. For example, BP #1 ability to capture all activities sets it apart from the IRMs. BP#1 assists in identifying activities that were not initially included in the baseline but were essential for the successful completion of the project. This practice is not reflected in the IRMs. Furthermore, it is important to mention that BP #3, which involves allocating resources to all activities, stands out as distinct from the IRMs.
Table 4 summarises the similarities between the GAO BPs and the IRMs. For instance, both BP#2 sequencing all activities and Metrics L001 - Basic relationship (missing predecessor or successor) and L002 – Basic relationship (missing predecessor and successor) are similar. BP #4 Establishing the duration of all activities is similar to certain IRMs, such as D001 High duration, C001 Project calendar and C002 Holidays. However, the IRMs are more specific in stipulating a maximum duration of activities, set at 44 days. BP #5 Verifying that the schedule can be traced horizontally and vertically lacks clearly defined specific measurements. Nevertheless, the BP primarily focuses on how critical and non-critical activities react to substantial increases in the duration of their predecessors. This is reflected in the IRMs more quantitatively by ensuring that activities have a clear relationship with their preceding and succeeding activities and that all activities have reasonable float and lags.
Similarities between GAO BPs and IRMs.
| GAO BP | IRMs |
|---|---|
| BP #1: Capturing all activities | G003 - Task identifier (unique), G004 - Task name (unique), G005 - Task name (descriptive) and G006 - WBS element identifier. |
| BP #2: Sequencing all activities | L001 Basic relationship (missing predecessor or successor) and L002 - Basic relationship (missing predecessor and successor) |
| BP #3: Assigning resources to all activities | Not applicable |
| BP #4: Establishing the duration of all activities | D001 High duration, C001 Project calendar and C002 Holidays |
| BP #5: Verifying that the schedule can be traced horizontally and vertically | Not applicable |
| BP #6: Confirming that the critical path is valid | L003-Percentage of tasks on the critical path |
| BP #7: Ensuring reasonable total float | F001 High total float (> 44days) |
BP, best practice; GAO, Government Accountability Office; IRMs, industry-recognised metrics; WBS, work breakdown structure.
BP #6 ‘Confirming that the critical path is valid’ involves evaluating the driving path to key milestones, determining the number of critical activities, and identifying the number of lags and leads on the critical path. This is comparable to IRM L003 ‘Percentage of tasks on the critical path.’ However, the IRMs primarily emphasise evaluating the project’s criticality percentage. BP #7 ‘Ensuring reasonable total float’ aims to assess the schedule’s flexibility by measuring reasonable float on each activity. The GAO BPs do not provide a specific definition for what constitutes a reasonable total float; instead, it is left open to interpretation based on the duration of the activity. This practice closely resembles the IRM F001 ‘High total float (> 44 days)’. It can be inferred that the evaluation of schedule quality using the GAO BPs or the IRMs may produce varying outcomes. Projects I and III received low scores of 14.29% according to the GAO BPs. Yet both obtained significantly higher scores of 64.7% and 58.82%, respectively, based on the IRMs. In contrast, a well-constructed baseline schedule, such as that of Project II, achieves high scores in both evaluation systems, namely GAO and IRMs.
In summary, both the IRMs and GAO BPs frameworks assess baseline schedule quality by evaluating key attributes essential for effective project planning and control. A notable area of overlap is the emphasis on activity sequencing, task identification and the logical structure of the schedule. Despite the different formats and thresholds used, IRMs employ a mix of binary and percentage metrics and GAO BPs use binary pass/fail criteria. There is considerable conceptual alignment in evaluating schedule completeness, logic and effectiveness.
IRMs offer precise, quantifiable benchmarks for schedule reliability, whereas GAO BPs provide a more comprehensive, qualitative perspective. However, GAO handles issues like resource loading and traceability that are missing from IRMs. On the other hand, GAO restricts in-depth metric-based evaluations by failing to provide numerical cutoffs. This demonstrates how the two frame-works combine, with IRMs facilitating accurate, data-driven assessments and GAO directing strategic quality.
This paper focuses on evaluating the quality of baseline schedules for infrastructure projects. This study analysed selected baseline schedules using IRMs and GAO BPs. Based on the analysis results, this paper introduces a list of recommendations for SHA engineers and decision-makers to enhance their review process of baseline schedules. The following recommendations are suggested to enhance the SHA’s current practices for reviewing schedule baselines. These recommendations are categorised into short-term implementable strategies and long-term policy implications to strengthen their practical impact.
Short-Term Implementable Strategies
- a.
Improve DWR accuracy and consistency:
Contractors should invest more time and effort in creating valid and representative DWRs. The analysis revealed several contradictions that hinder accurate progress tracking, such as unexplained inactivity or unclear activity dates. DWRs should be consistently prepared and approved by contract administrators to ensure clarity and reliability.
- b.
Emphasise descriptive scheduling practices:
Contractors should develop baseline schedules that include descriptive task names, WBS element identifiers, accurate logic ties and visible float. These elements are essential for meaningful schedule evaluation and should align with key IRMs and GAO guidelines.
- c.
Submit schedules with traceable progress:
Schedules should extend beyond start and end dates to include logic-based sequencing, percentage completion and real-time updates, utilising scheduling software that supports better monitoring and forecasting throughout the project lifecycle.
- d.
Account for weather impacts and float:
Contractors should anticipate weather delays and manage float appropriately in their schedules. They can obtain this information from historical weather or seasonal data specific to a location and project timeline. Too often, standard specifications related to weather and float are not referenced, resulting in unrealistic schedules and insufficient schedule flexibility.
- a.
Long-Term Policy Implications
- a.
Mandate IRMs and GAO practices for schedule approval:
Baseline schedules should only be approved if they meet the minimum requirements of IRMs or GAO BPs. None of the schedules analysed in this study fully satisfied both frameworks, indicating a need for stricter enforcement of these policies.
- b.
Incorporate schedule metrics in SHA specifications:
SHAs should embed key performance metrics (e.g., critical path validation, float thresholds, logic checks) into their standard scheduling specifications and contract requirements.
- c.
Require contractor certification or training:
To improve baseline schedule quality, SHAs may consider requiring contractors to undergo specific training or certification in scheduling tools and BPs.
- d.
Develop a standardised baseline review protocol:
SHAs can benefit from adopting a consistent review process or template for evaluating submitted baseline schedules. This would improve consistency, transparency and compliance across projects.
- a.
To enhance project tracking and control for transportation projects, this paper analyses the existing schedule baseline evaluation metrics to establish comprehensive evaluation metrics. This study assesses the quality of baseline schedules for transportation projects using IRMs and GAO guidelines. Data was assembled from baseline schedules and DWRs for transportation projects developed by SHAs. This research is distinctive in its dual application of IRMs and GAO guidelines, demonstrating the combined efficacy of these frame-works for evaluating baseline schedule quality in transportation projects. By analysing and comparing both metrics, this study contributes to a more comprehensive understanding of baseline schedule quality, offering practical guidance that can directly inform SHA policies. These contributions are aimed at strengthening baseline review processes, thereby bridging the gap between theoretical BPs and real-world project needs.
The analysis of the baseline schedules and DWRs data identified discrepancies such as unreasonable gaps in duration between activities, missing relationships between activities and unrealistic activity durations. The evaluation of baseline projects against IRMs for four transportation projects showed that 24%–41% of performance metric thresholds were not met for each individual project. Common issues identified included lacking descriptive task names, WBS element identifiers, milestone definitions and distinctive task names.
The assessment of baseline schedules against GAO BPs revealed that as few as one out of seven (14%) BPs were satisfied in multiple projects. The project with the best record failed to meet two out of seven requirements. While all projects successfully passed BP #4 (establishing the duration of all activities), they failed to satisfy BP #2 (assigning resources to all activities) and BP #7 (ensuring reasonable total float).
This paper contributes to the body of knowledge in construction project management by applying established methodologies—specifically IRMs and GAO BPs—to assess the quality of baseline schedules in transportation projects. The findings demonstrate how these standards can be both effective and limited in practice, with specific recommendations for improvement. These contributions are aimed at enhancing baseline schedule reviews for SHAs and contractors, bridging the gap between theory and practice and guiding future research in refining schedule management methodologies.
While this study is limited by the small sample size of four projects, these projects were selected for their completeness and representativeness of typical work conducted by the SHA. The findings, though not broadly generalisable, offer valuable insights into how industry standards can be applied to transportation projects. Future research with a larger sample size is recommended to validate and expand upon these findings. A hypothesis to be tested is high-quality baseline schedules are not associated with adhering to the GAO BPs and IRM. A baseline schedule can adhere to most of the GAO practices and IRM, but is still poor in terms of realistically sequencing the activities. Another future research area is developing a set of comprehensive metrics and practices to evaluate the quality of baseline schedules. These metrics should be easy to measure and included in SHA’s scheduling specifications.