
Fig. 1:
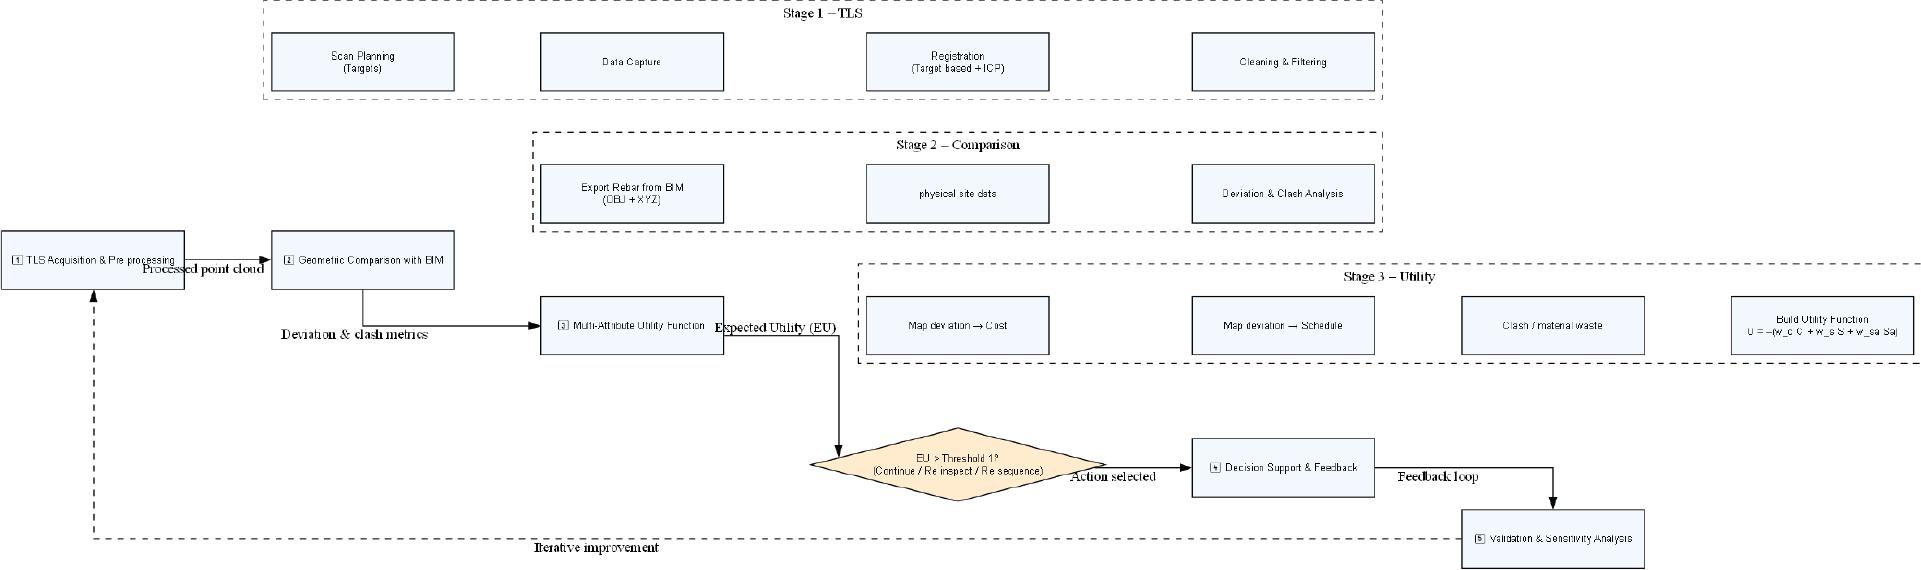
Fig. 2:
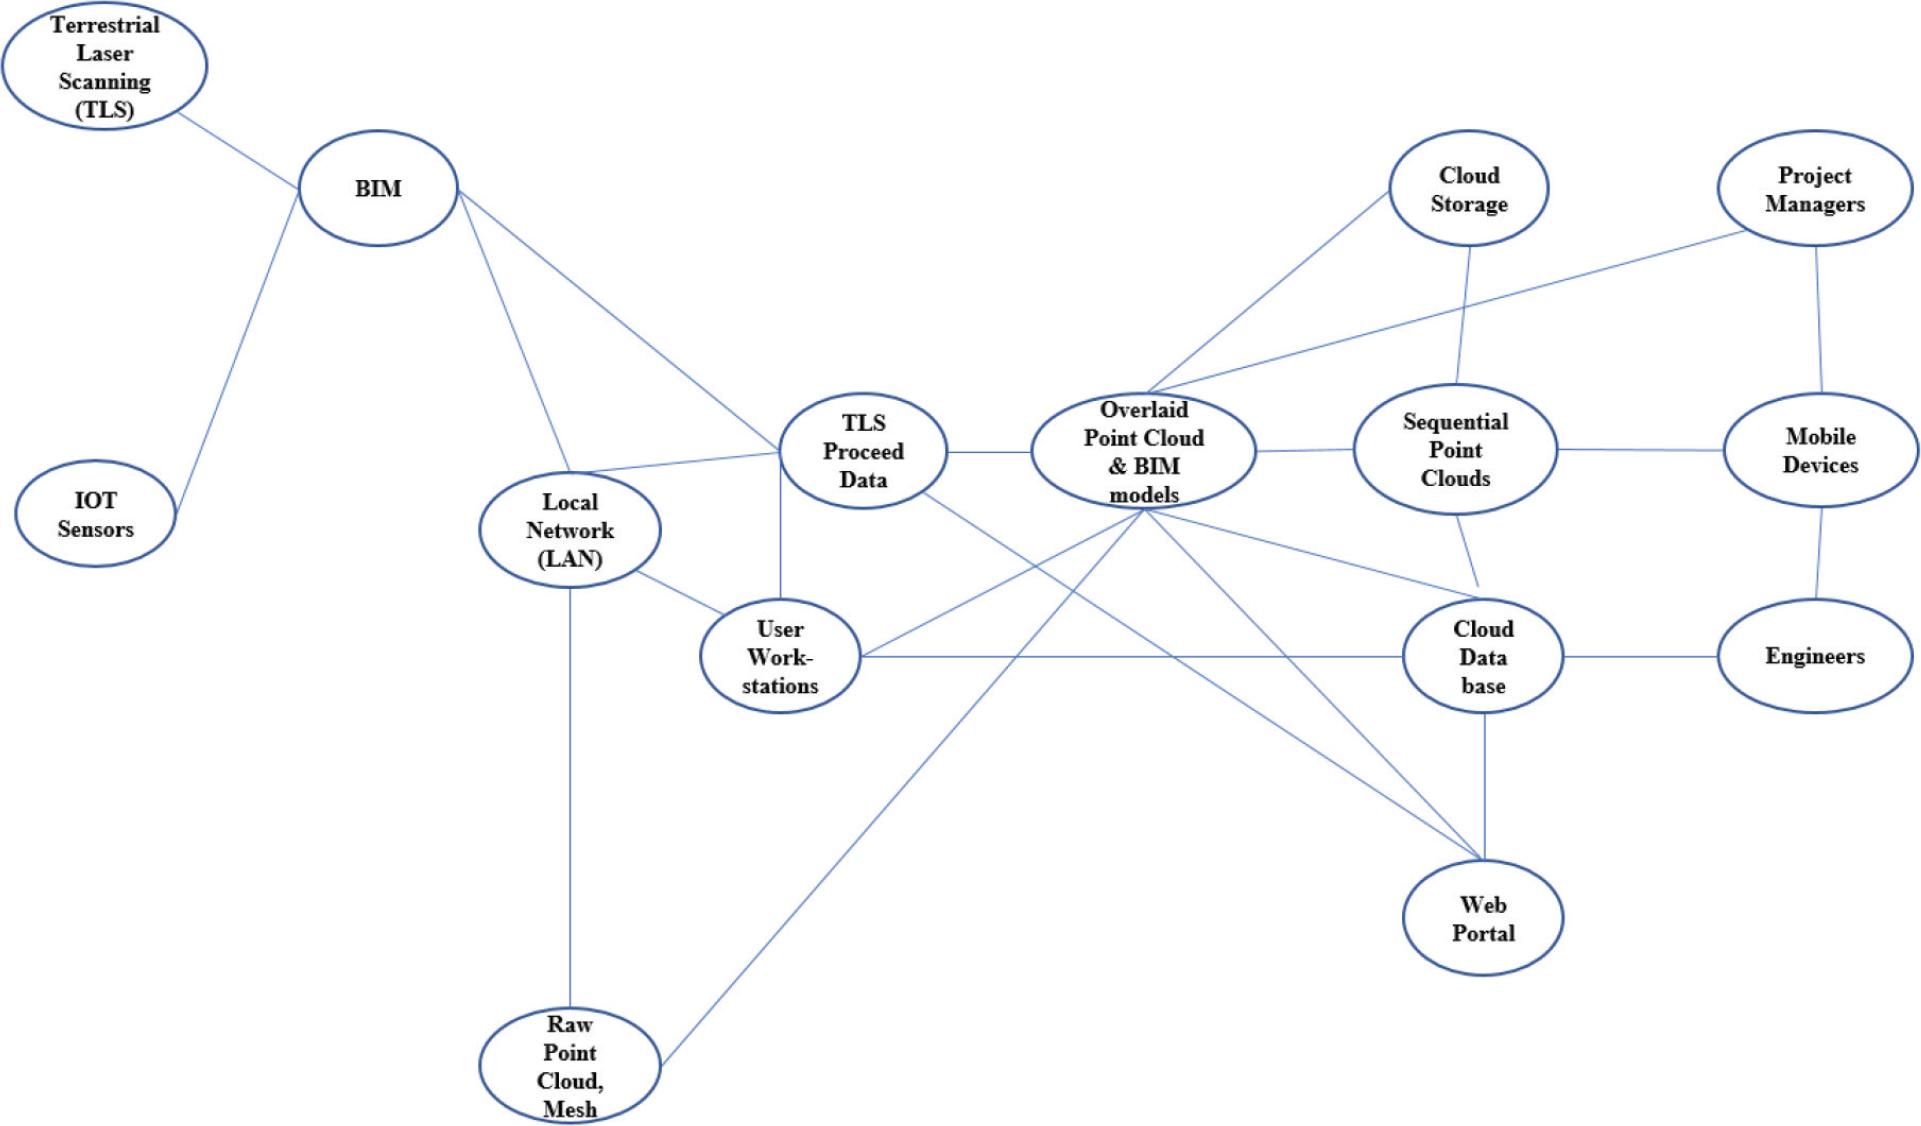
Fig. 3:
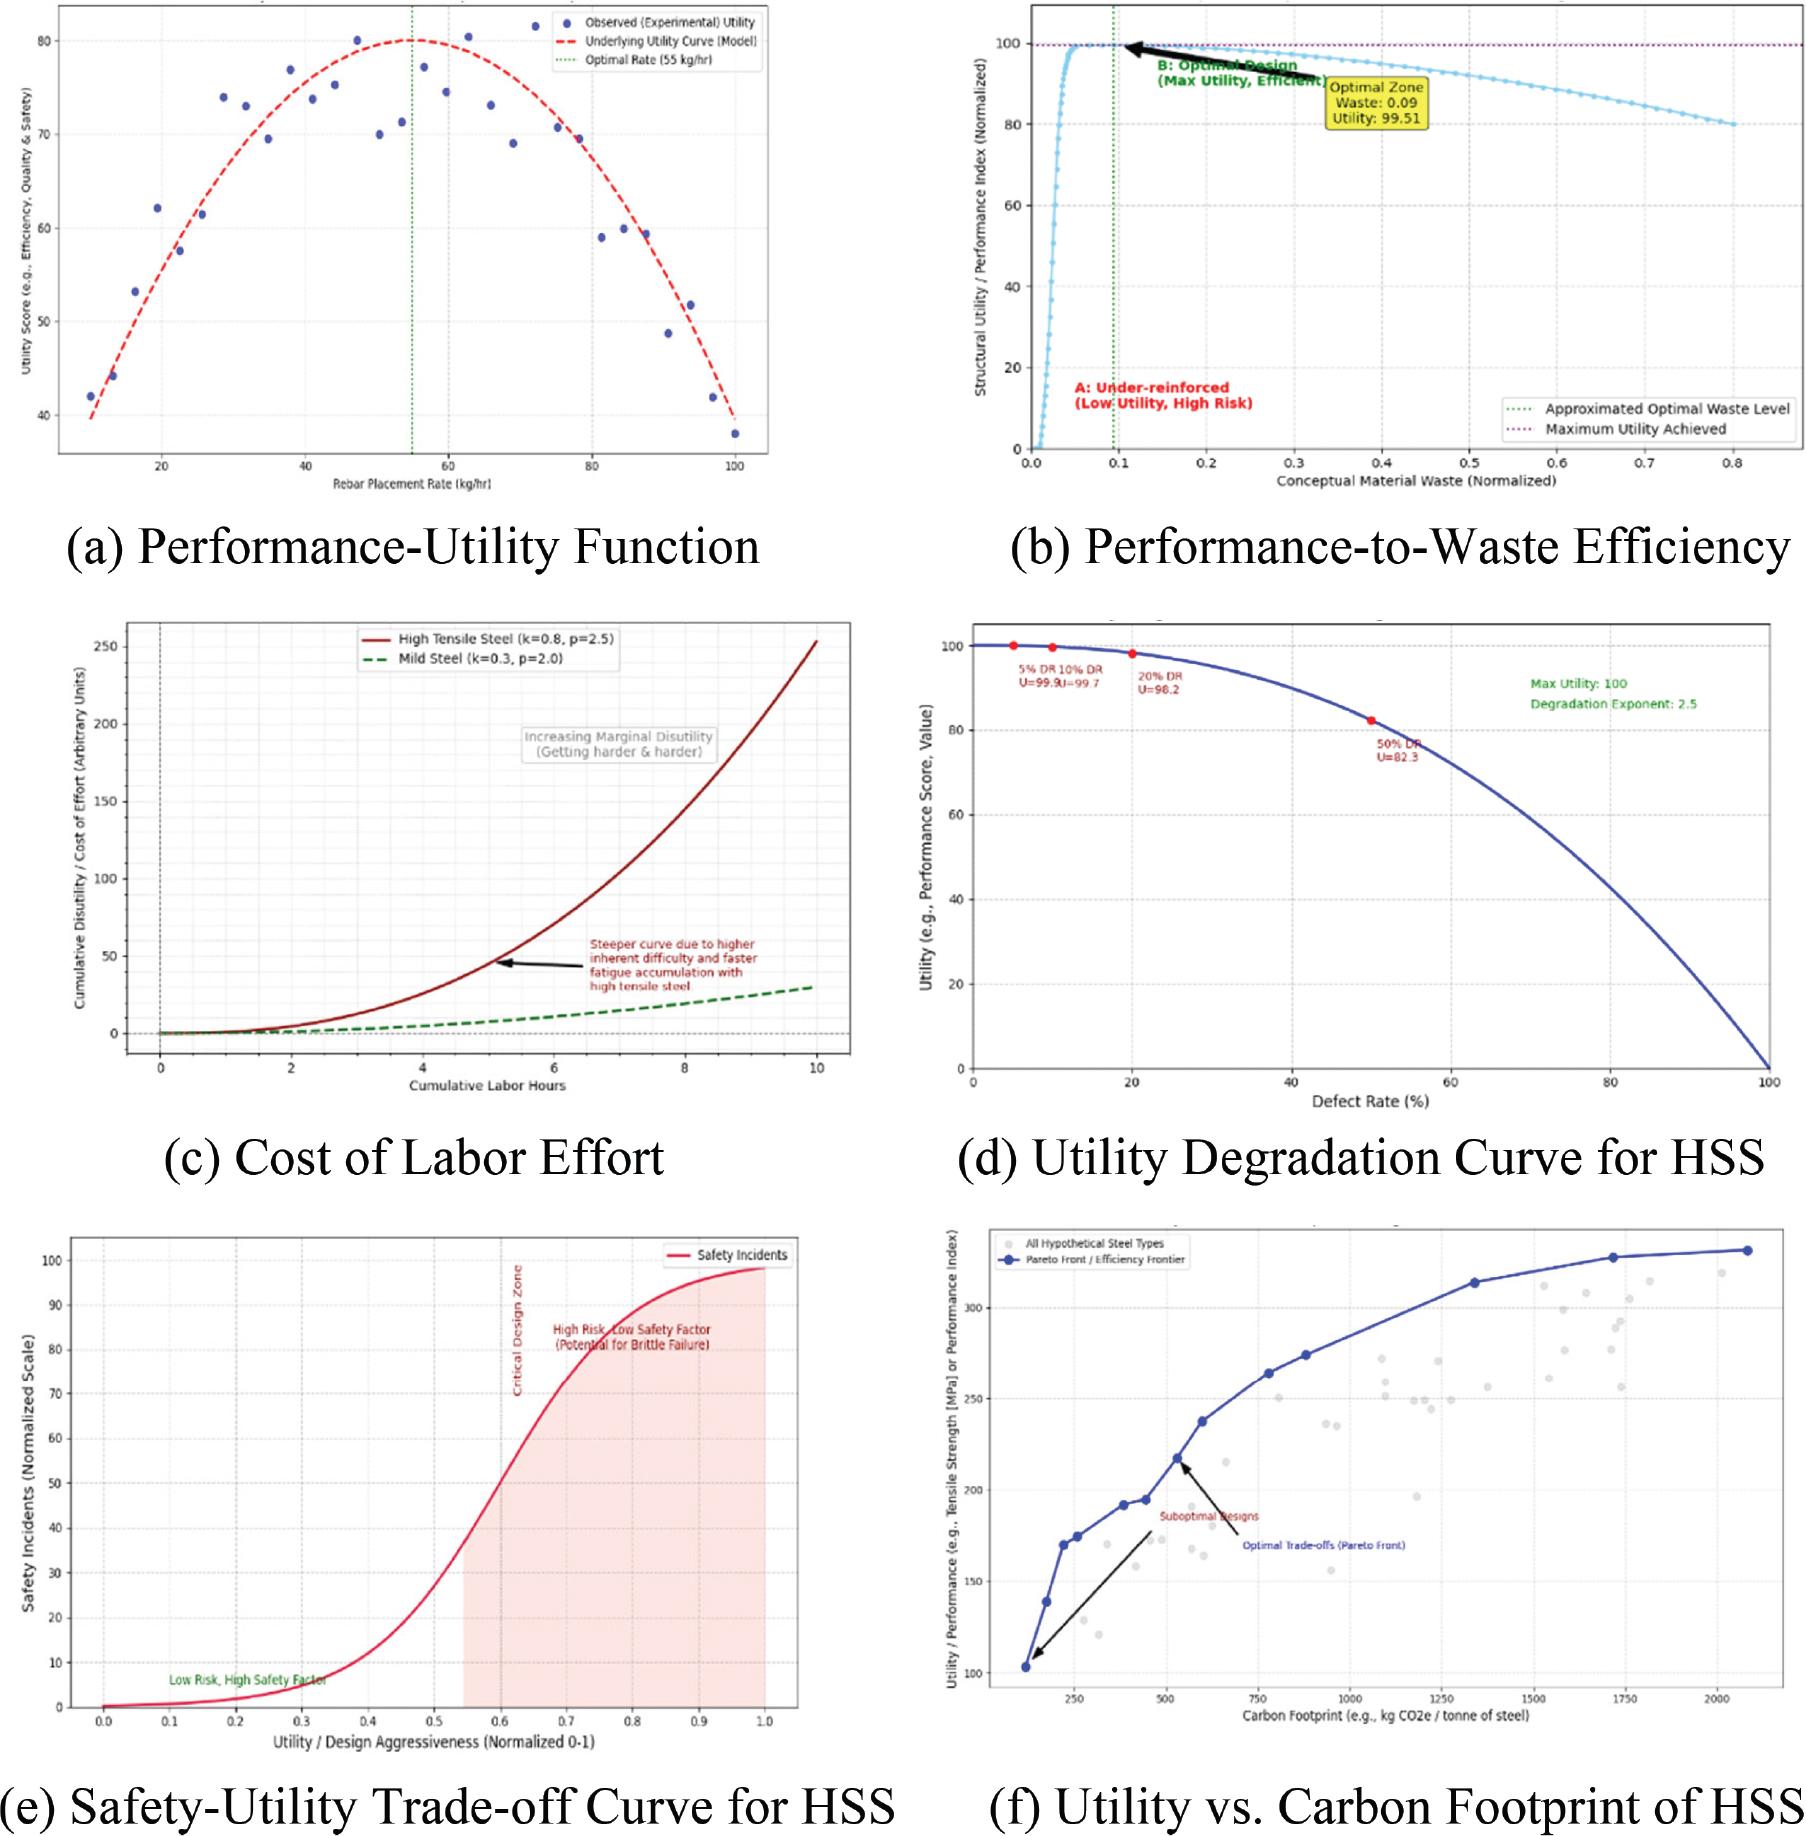
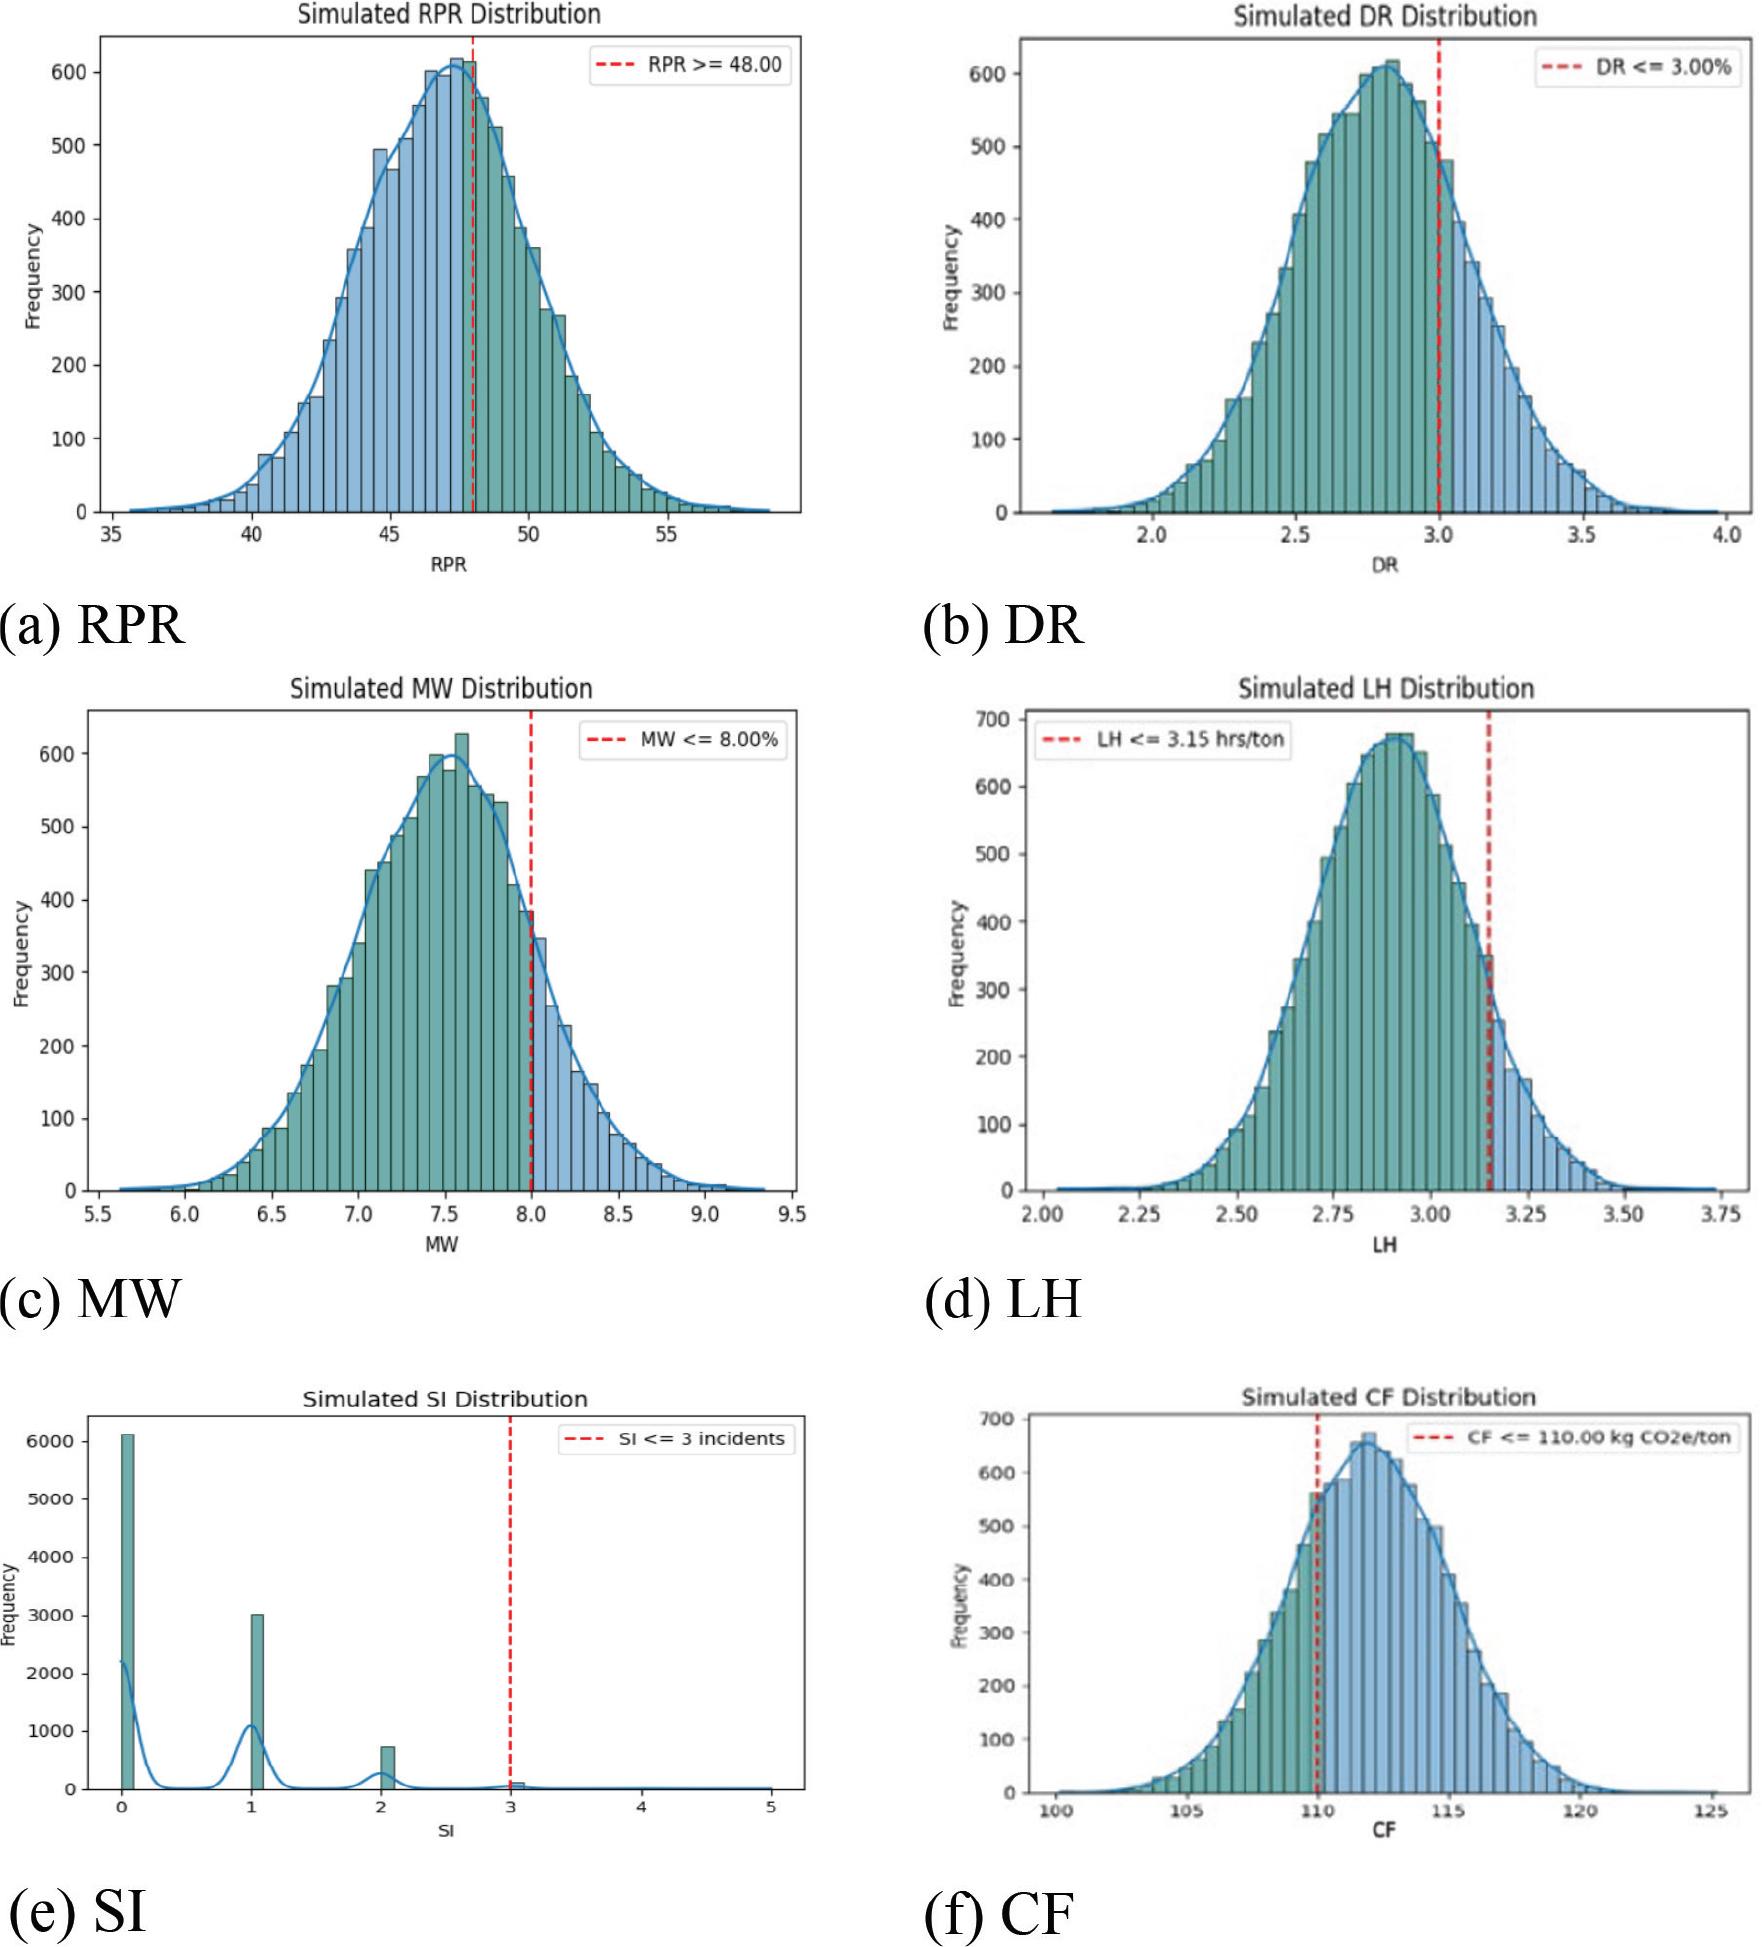
Fig. 4:
Data acquisition parameters_
| Table name | Fields (columns) | Data type | Description | Source | Update frequency | Usage in utility theory |
|---|---|---|---|---|---|---|
| Project_ metadata | Project ID, Project name, location (geometry), start date, end date, rebar type, rebar weight | INTEGER, TEXT, GEOMETRY, DATE, DATE, TEXT, DECIMAL | Contextual data | Project Management System | Once | Used for context and filtering data |
| Remote_ Sensing_ Data Assessing site conditions and external factors | RS_ID, Project ID, timestamp, site layout (binary data, i.e., an <img> tag in HTML), weather conditions, site accessibility score, image source | INT, INT, DATETIME, BINARY, TEXT, DECIMAL, TEXT | Temporal features reveal important patterns (e.g., productivity drops on Fridays, higher costs in specific months) | Drone, Satellite Imagery | Daily/hourly | Site accessibility score impacts time and cost estimation. The weather affects time. |
| Rebar_Inventory | Inventory ID, project ID, timestamp, rebar type, quantity received, quantity used, quantity wasted, cost/unit | INT, INT, DATETIME, TEXT, DECIMAL, DECIMAL, DECIMAL, DECIMAL | Tracking of rebar inventory cost and waste analysis | Inventory Management System | Daily | Cost information is directly used in cost-utility functions. |
| Labour_Data | Labour ID, project ID, timestamp, worker ID, task description, hours worked, pay rate, task completed | INT, INT, DATETIME, INT, TEXT, DECIMAL, DECIMAL, BOOLEAN (true/false values) | Tracking LH and tracking task progress | Time tracking system, payroll system | Daily | Labour costs and time are directly used in cost and time utility functions. |
| Equipment Data | Equipment ID, project ID, timestamp, Equipment type, hours used, fuel consumption, maintenance cost, downtime hours | INT, INT, DATETIME, TEXT, DECIMAL, DECIMAL, DECIMAL, DECIMAL | Assessing equipment efficiency, operational costs and potential delays | Equipment Management System | Daily | Equipment costs and downtime impact cost and time. |
| Cost_ Data | Cost ID, Project ID, timestamp, cost category (e.g., labour, materials, equipment, permits), description, amount, payment date | INT, INT, DATETIME, TEXT, TEXT, DECIMAL, DATE | Monitoring of financial data for overall cost analysis | Accounting system | Daily/weekly | Used for calculating cost utility functions. |
| Decisions | Decision ID, project ID, timestamp, decision type, alternatives, chosen alternative, rationale | INT, INT, DATETIME, TEXT, TEXT, TEXT, TEXT, | Storage of past decisions, their alternatives, | Project Management System | As needed | Provides historical context for decisions |
Projected performance metrics and utility for rebar operations interventions_
| Metric/intervention | Baseline (current) | Intervention A (automated machine) | Intervention B (BIM and digital detailing) | Intervention C (safety and environment) | Intervention D (storage and logistics) |
|---|---|---|---|---|---|
| RPR (kg/h) | 450 | 600 (+33%) | 450 | 450 | 450 |
| MW (%) | 7% | 4% (–3%) | 6% | 7% | 5.5% (–1.5%) |
| LH (h/segment) | 120 | 90 (–25%) | 110 | 120 | 115 (–5) |
| DR (%) | 3% | 3% | 1% (–2%) | 2.5% (–0.5%) | 3% |
| SI (incidents/month) | 1 | 1 | 1 | 0 (–1) | 1 |
| CF (tons CO2eq/ton) | 0.8 | 0.8 | 0.8 | 0.8 | 0.8 |
| Schedule adherence | 80% | 95% (+15%) | 90% | 83% | 87% |
| Projected utility score (U’) | 0.45 | 0.554 | 0.49 | 0.46 | 0.47 |
| Net utility gain | - | +0.104 | +0.04 | +0.01 | +0.02 |
Analysis of deviation and clash detection_
| Data type represented | Description | Example metric | Analysis type | Relevance to HSS rebar analysis |
|---|---|---|---|---|
| TLS raw data | High-density 3D point cloud capturing the ‘as-built’ physical geometry of rebar elements. | Millions of (X, Y, Z, intensity) coordinates. | Acquisition, registration, noise filtering. | Provides the precise spatial coordinates of visible rebar elements for geometric comparison with BIM. |
| TLS processed data | Registered, point cloud, often segmented to isolate rebar elements. | Segmented point cloud of rebar cages. | Spatial feature extraction, object recognition. | Creates a complete, unified 3D model of the as-built rebar cage, for comparison with the BIM model. |
| BIM reference data | As-designed 3D model of HSS rebar with precise geometric and semantic information. | Rebar elements (diameter, length, bend radii, material) | Design baseline. | For the ‘georeferencing’ of point clouds to the coordinate system, ensuring alignment with BIM. |
| Spatial analysis | Comparison of measured rebar Positional, spacing and angular errors from TLS with designed values from BIM. | Rebar positional deviation average; mm. rebar spacing; mm | Geometric comparison, deviation mapping | Visual identification of problematic areas, highlighting areas requiring immediate attention or detailed inspection, and high deviation |
| Volumetric analysis | Quantification of rebar quantities based on the 3D capture, compared to BIM for material verification. | Installed/designed rebar volume: m3 rebar length installed: linear meters vs. designed linear meters. | Quantity take-off verification, material consumption tracking. | Facilitates direct comparison with BIM, enabling numerical measurement of deviations (e.g., rebar diameter, spacing, bend radii, alignment). |
| Clash analysis | Identification of intersections or insufficient clearance between as-built rebar and other elements (MEP, other rebar). | Number of clashes detected: rebar intersecting conduit, rebar overlapping another rebar cage. | Interference detection, constructability review. | Identifying constructability issues before the concrete pour, preventing costly rework and schedule delays |
| Progress analysis | Tracking the completion status of rebar installation over time compared to the 4D BIM schedule | Percentage complete (rebar installation):% by planned date. Installation rate: tons/day. | Time-based comparison, earned value monitoring. | Provides objective, data-driven progress tracking, enabling Schedule adherence and resource allocation |