
Practitioners in Construction Engineering and Management focus on utilising advanced materials, such as HSS, and innovative technologies, including remote technology, to enhance productivity in construction projects. HSS adheres to the International Standard ISO 6935-2:2007, offering enhancements in tensile strength and durability compared to conventional rebar. This advancement can result in structures with a longer lifespan, utilising smaller-diameter rebar, fewer intersections and potentially fewer concrete sections, which facilitates lower material expenses, reduced transportation costs and faster installation. Remote technology, including drone inspections, laser scanning for progress monitoring and cloud-based project management, can significantly improve safety on construction sites. Monitoring operations remotely reduces the need for workers to be present in potentially hazardous environments (Kissi et al. 2016; Katiyar and Kumar 2021). According to Arabshahi et al. (2021), sensing technologies can be divided into two main categories: location-based technologies, including real-time location systems (RTLS), radio frequency identification (RFID), ultra-wideband (UWB) technology and vision-based technologies, such as photography and video recording. Furthermore, the authors categorised sensing technologies into wireless sensor network (WSN) technologies, which include devices, such as temperature sensors and light sensors. These are typically used for wireless data transmission between resources and recording devices. A utility-driven approach encompasses several elements, measurable metrics achieved by defining key performance indicators (KPIs) related to cost, time, safety, quality and environmental impact, while also considering potential risks and uncertainties. It involves a commitment to continuous improvement, evaluating the effectiveness of implemented solutions and making necessary modifications to enhance their utility.
A review of previous relevant studies was conducted to evaluate the benefits of remote sensing techniques in the construction industry. However, these models adopted an individual perspective; earlier investigations often focussed on either remote-enabled data or HSS operations, rather than considering both parameters simultaneously, which does not facilitate the analysis of trade-offs to achieve the desired utility for HSS productivity. In contrast, optimising the application of HSS at construction sites necessitates decision-making that balances cost, time, and potentially quality and performance. The increasing integration of remote technology within the construction sector reveals a notable gap between ‘as-designed’ building information modelling (BIM) models and ‘as-built’ site conditions. This process aims to enhance quality control, minimise rework, and ensure structural integrity by accurately identifying deviations, clashes, and tracking progress. This paper directly addresses this critical gap by offering a comprehensive solution that integrates advanced remote sensing with advanced analytical techniques, moving beyond mere data collection to provide actionable intelligence for realtime tracking, precise deviation detection, and proactive decision-making in rebar management. This significantly advances the state of the art by concurrently boosting operational time while ensuring quality control for high-strength rebar. This shift enables management to transition from a reactive to a proactive approach, allowing for the identification of rebar placement errors and preventing costly rework and delays. Furthermore, it enhances safety by minimising manual intervention in hazardous rebar cage environments and provides insights through quantifiable metrics for tracking progress and resource allocation. Thereby contributing to the broader digitalisation within the construction field.
This section provides an overview of the usage of remote sensors (RSs) in the construction industry and the latest advancements in construction automation.
Utility-driven decision-making in construction prioritises options that enhance overall value and benefit all stakeholders, focussing on safety (via remote monitoring and reduced manual handling) and minimising environmental impact through (less material consumption, lower transportation costs, and reduced carbon footprint [CF]) when implementing HSS and remote technologies. Research supports this approach, with Gunarathne et al. (2020) developing a framework that integrates virtual environments (VE) and sustainability for Sri Lanka’s construction, and Zhang et al. (2008) designing a knowledge management system for VE analysis. Additionally, studies indicate that digital technologies, including 3D printing, can boost efficiency by 35% (Naji et al. 2024). Lean construction further enhances productivity by improving processes, reducing waste, and delivering value through material transformation and seamless workflows (Aslam et al. 2020; Garcés and Peña 2023).
High-strength rebar (HSS), which exceeds 500 MPa in yield strength and offers enhancement in ductility and corrosion resistance, is ideal for construction, enabling lighter concrete structures with reduced cross-sectional areas and potentially lower material costs (ACI Committee 318 2019). Research includes comparisons of HSS reinforcement requirements between AASHTO and ACI 318 (Aldabagh and Alam 2020) and assessments of seismic performance for HSS-reinforced concrete columns, which demonstrate commendable drift capacities (4%–8%) (Barcley and Kowalsky 2020). However, studies on the flexural behaviour of confined RC beams indicate that the high-yield strain of Grade 690 MPa HSS may increase susceptibility to brittle failures (Aldabagh et al. 2018). Using actionable insights can improve HSS operational productivity.
RS technologies, integrated with the Internet of Things (IoT), provide real-time aerial views and granular data for optimised construction operations. These, alongside virtual reality (VR) and mixed reality (MR) digital learning platforms, are revolutionising construction engineering and management through virtual meetings and augmented reality (AR) design reviews. RS with GPS optimises equipment use, while wearable and vicinity sensors enhance worker safety by monitoring vital signs and proximity (Kim et al. 2019). Drones play a crucial role in thermal/high-resolution imaging, providing precise inspections (Zhang et al. 2023). Aerial images captured by drones assess site accessibility/obstacles (Motawa and Kardakou 2018; Hammad et al. 2021). Sensor data support proactive issue detection, enhanced safety, predictive maintenance and extended structural lifespan. Research in this domain is extensive: Cheng et al. (2020) reviewed AR/MR spatial registration for accurate digital-real world integration in the architecture, engineering, construction, and operation (AECO); Han and Golparvar-Fard (2017) addressed AR (MR) challenges; and Dan et al. (2021) created ‘Holo Designer’ for 3D model visualisation. Automated methods, such as (Kopsida and Brilaki 2023), achieve high accuracy in real-time of as-built vs. planned data. For safety, Li et al. (2018) integrated AR/VR for emergency simulation and hazard prediction of fires and structural failures at construction sites to forecast potential hazards and develop suitable preventive measures, while Ogunseiju et al. (2021) unified sensing technologies for precise project monitoring using drones. Meanwhile, Wu et al. (2022) proposed a system combining BIM with live video/wearable MR for real-time hazard identification. In this context, Moselhi et al. (2020) demonstrated that integrating various RS technologies, including RTLS/RFID, WSN/digital imaging, localisation, and 3D modelling, is beneficial for enhancing progress reporting, safety, and productivity. While operation and maintenance (O&M) in bridges are reviewed through data-driven decision-making (Wu et al. 2020), their analysis led to the creation of indices that highlight safety, severity, and durability. Furthermore, the mobile impact of AR on rebar inspection safety and performance was analysed by Abbas et al. (2020). In the construction industry, it is common for building elements not to match the design specifications exactly due to changes during the project’s duration or errors in construction. The conventional approaches for capturing as-built information are increasingly being replaced by innovative technologies, such as laser scanners and digital cameras (Dinis et al. 2020). According to Tkac et al. (2018) and Tang et al. (2022), laser scanning is a high-accuracy mapping method to collect details of specific building sections or project sites. Additionally, Maleek et al. (2018) observed that laser scanners allow decision-makers to identify inconsistencies between the planned and as-built conditions of a project. Laser scanners are quickly gaining acceptance as a tool for 3D modelling and analysis in the construction industry (Wu et al. 2021). Recognising the importance of adopting innovative and digital technologies in construction operations requires assessing the factors that hinder their adoption (Uotila et al. 2021; Ikuabe et al. 2025). Another application (Shanbari et al. 2016) mentioned that hardware and software with high-end computing capacities are handling large data sizes generated. This might serve as a stumbling block towards the espousal of technology. Likewise, laser scanners are susceptible to harsh environmental conditions, such as humidity, rainfall and sunlight, since they are mostly used outdoors. Additionally, the lack of necessary skills and knowledge in managing emerging technologies has hindered the adoption of digital technologies (Noruwa et al. 2022; Skrzypczak et al. 2022). The complexity involved in constructing buildings and civil structures makes it essential to use reliable, fast and accurate monitoring systems to ensure safety during project execution and for ongoing maintenance of the infrastructure (Nguyen et al. 2020).
The primary aim of this research is to develop, validate, and assess a novel hybrid methodology for enhancing productivity and quality control in high-strength rebar operations. To achieve the stated objectives, the research will seek to understand how terrestrial laser scanning (TLS) can effectively capture and analyse HSS rebar installation data to accurately identify deviations, clashes, and progress against BIM models. It will then investigate how these objective, data-driven insights into deviations, clashes, and real-time progress can be seamlessly integrated into HSS management, which can significantly reduce uncertainty about the real-time status of rebar work. Furthermore, the study will explore how utility theory can be systematically applied as a quantitative framework to evaluate decision alternatives, such as continuing, reworking, or re-sequencing, by assigning utilities to potential outcomes and their likelihoods, thereby generating optimal recommendations. Ultimately, the research aims to demonstrate how this closed-loop, hybrid methodology – where remote sensing provides data, HSS management defines context, and utility theory informs the optimal response-leads to rapid issue identification, minimises costly rework, optimises resource allocation, ensures high-quality HSS rebar installation, and significantly enhances overall construction productivity.
This study employs a robust, closed-loop hybrid methodology to optimise HSS rebar installation management by integrating objective remote sensing data with a prescriptive decision-making framework. The process begins with rigorously defined data capture, where a Terrestrial Laser Scanner is used to capture high-density point clouds of the rebar installation from multiple predefined stations to ensure complete coverage (Aryan et al. 2021). The BIM model is prepared, and a common coordinate system is established for both the point cloud and BIM data. Subsequently, the raw point cloud undergoes preprocessing using a statistical outlier removal (SOR) filter to eliminate noise and voxel grid down-sampling tooptimise computational efficiency. The Quantitative Comparison Algorithm then performs a Cloud-To-Mesh (C2M) distance analysis, comparing the as-built point cloud against the as-designed BIM model’s mesh to calculate the mean absolute deviation (MAD) and root mean square error (RMSE) for each rebar section. Completion percentage is derived by calculating the ratio of BIM mesh surface points with a corresponding as-built point cloud neighbour within a 10 mm tolerance. Progress is quantified by segmenting the as-built rebar points via clustering and calculating the volumetric ratio of this segmented point cloud to the total as-designed rebar volume from the BIM model, yielding the ‘Y% completed’ metric. These quantitative insights then feed into the utility-function design, where the expected utility (EU) for each potential action (continue, rework and re-sequence) is calculated (Ikuabe et al. 2020; Oke et al. 2021). The Decision-Rule employs the maximum expected utility (MEU) principle, where the potential actions of Continue, Rework, or re-sequence are evaluated by calculating their EU, EU (action) = Σ p (outcome |action, data) × U (outcome), with the probabilities p derived from the TLS metrics i.e., a high MAD increases the probability of structural failure). Finally, the validation of this entire framework is conducted through a case study on a construction project, where the model’s recommendations are benchmarked against the project manager’s decisions, and the resulting discrepancies in with performance measured by KPIs including final rework cost, schedule adherence and number of reported safety incidents related to structural installation are analysed to demonstrate the framework’s efficacy. Figure 1 outlines the flowchart process for the research methodology. This methodology transforms rebar installation management from reactive to proactive by leveraging real-time data analytics and optimisation, ultimately improving efficiency, safety and cost-effectiveness in construction projects.
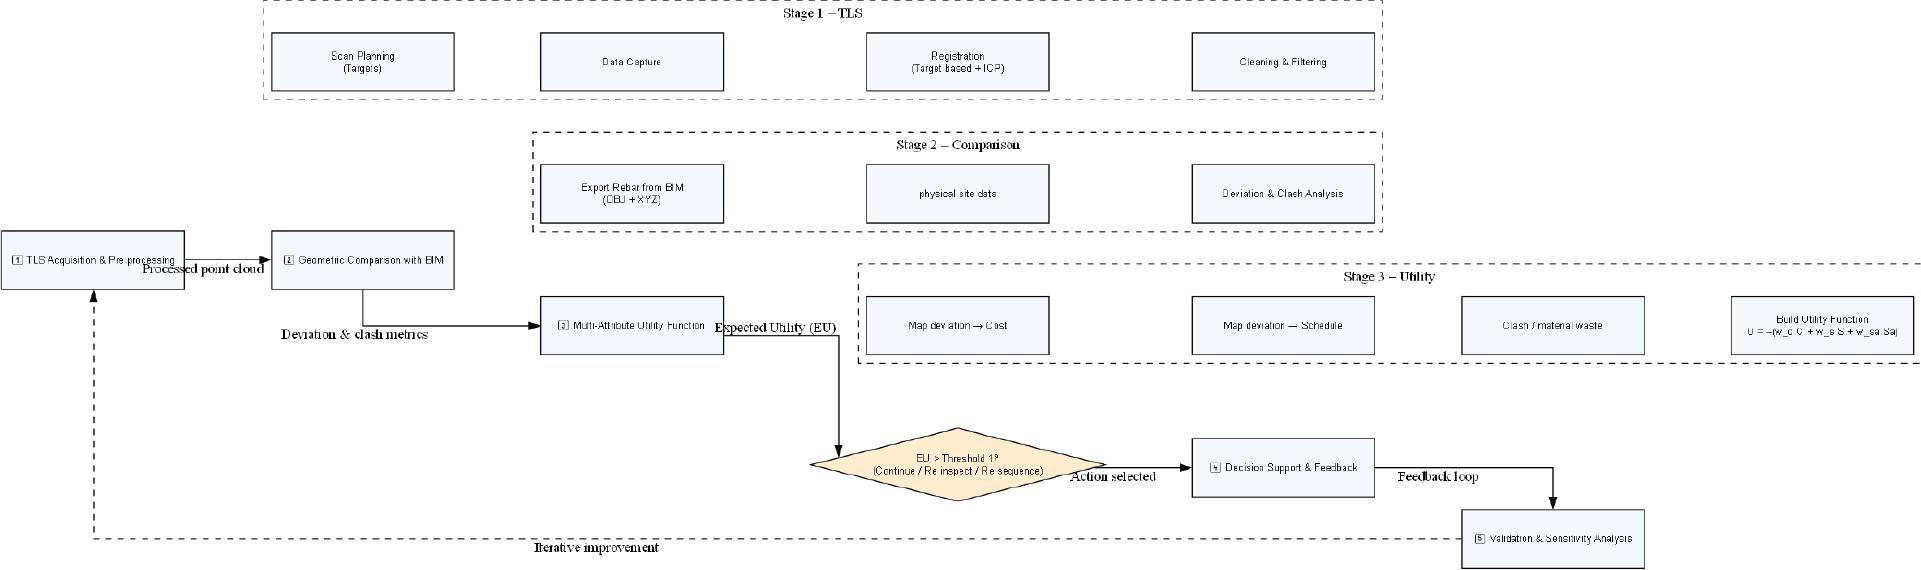
Conceptual framework of the hybrid methodology for HSS. HSS, high-strength rebar.
The proposed conceptual framework centres on an integrated, data-driven framework designed to simultaneously elevate rebar placement productivity and quality by leveraging real-time digital monitoring and advanced analytics. This framework integrates physical site data with digital project models to support optimal managerial responses. First, digital data acquisition and data preprocessing to bridge the physical construction site with the digital environment. It starts with the TLS of HSS rebar installations at critical project milestones. The raw point cloud data, which captures millions of spatial coordinates, is then subjected to Preprocessing to ensure data quality and usability. This includes noise filtering to remove errant points, scan registration to stitch multiple viewpoints into a single cohesive model and segmentation to isolate the HSS rebar from other structural elements, such as concrete or formwork. The output is a clean, structured and geo-referenced as-built point cloud of the rebar. Second, ‘As-Built vs. As-Designed’ Quantitative Analysis, in this phase, the pre-processed as-built data is rigorously compared against the as-designed digital twin. The BIM model serves as the ground truth for design intent. A C2M Comparison Algorithm is executed, computing precise geometric deviations, i.e., MAD, RMSE and for every rebar section. Simultaneously, a Progress Quantification Algorithm calculates the percentage of installation completion by mapping the as-built points to the BIM model’s surface. The result is a set of objective, quantifiable metrics (e.g., ‘Rebar Cage C-3 has a 9 mm positional deviation and is 75% complete’) that form the basis for decision-making. Third, the analytical core of the framework translates the quantitative data into actionable management recommendations. The objective metrics from the second phase are input into the Multi-Attribute Utility Function.
This function mathematically models the project’s priorities by assigning weights to potential outcomes for cost, schedule and safety. The framework then uses a MEU Rule to evaluate a discrete set of management actions (e.g., continue, rework and re-sequence). The action that yields the highest calculated EU is selected as the optimal recommendation, effectively balancing trade-offs under uncertainty. Ultimately, the framework is validated in a real-world context. A project case study is selected for observation. The Benchmarking process involves comparing the recommendations generated by the framework against the actual decisions made by the project management team using traditional methods. Finally, performance KPIs, such as total rework cost, project schedule variance and safety incident logs, are used to quantitatively measure the improvement enabled by the proposed system, thus validating its contribution to construction project management.
For optimal data analysis, all gathered data is integrated into a central database, facilitating the identification of key variables and tracking critical KPIs, such as cost savings, waste reduction and schedule adherence (Štefanič and Stankovski 2018; Ejidike et al. 2024). Remote technologies and ‘IoT’ sensors enable comprehensive data acquisition, transmission and real-time intervention for construction monitoring, labour efficiency and safety (Siebert and Teizer 2014; Park et al. 2016; Bang et al. 2017; Freimuth and König 2018; Hamledari et al. 2021; Ruiz et al. 2021; Keyvanfar et al. 2022; Choi et al. 2024). Manual data collection is conducted through observations, interviews, and surveys, providing valuable insights into labour efficiency and safety standards. To maximise the potential of these diverse data sources, all information should be integrated into a central database, allowing seamless analysis and modelling. This centralised approach helps identify and quantify the key variables of material, labour, equipment, site and management categories, supporting informed decision-making. This module specifically acquires, processes and analyses remote sensing data to deliver real-time insights and progress monitoring. TLS data is typically represented as a point cloud, a collection of millions of 3D points that define the shape and dimensions of the scanned object. It, combined with spatial and volumetric analysis, monitors real-time conditions for safety. The point cloud data can be used to create 3D models of the as-built structure, which can be integrated with BIM for further analysis and management. Spatial analysis examines the spatial relationships between different features and volumetric analyses further aid resource management, generating geo-referenced 3D models (including rebar inventories and equipment locations) and detailed progress reports. Data processing includes geometric correction (Ortho-rectification), image classification (object-based image analysis [OBIA]), change detection and 3D model generation. Effective data integration, including data cleaning, transformation and ‘georeferencing’, followed by spatial analysis overlay tools to correlate diverse sources. This process converts raw construction data into powerful datasets that support advanced utility theory analyses, ultimately optimising project outcomes. Table 1 shows various data sources and their utility.
Data acquisition parameters.
| Table name | Fields (columns) | Data type | Description | Source | Update frequency | Usage in utility theory |
|---|---|---|---|---|---|---|
| Project_ metadata | Project ID, Project name, location (geometry), start date, end date, rebar type, rebar weight | INTEGER, TEXT, GEOMETRY, DATE, DATE, TEXT, DECIMAL | Contextual data | Project Management System | Once | Used for context and filtering data |
| Remote_ Sensing_ Data Assessing site conditions and external factors | RS_ID, Project ID, timestamp, site layout (binary data, i.e., an <img> tag in HTML), weather conditions, site accessibility score, image source | INT, INT, DATETIME, BINARY, TEXT, DECIMAL, TEXT | Temporal features reveal important patterns (e.g., productivity drops on Fridays, higher costs in specific months) | Drone, Satellite Imagery | Daily/hourly | Site accessibility score impacts time and cost estimation. The weather affects time. |
| Rebar_Inventory | Inventory ID, project ID, timestamp, rebar type, quantity received, quantity used, quantity wasted, cost/unit | INT, INT, DATETIME, TEXT, DECIMAL, DECIMAL, DECIMAL, DECIMAL | Tracking of rebar inventory cost and waste analysis | Inventory Management System | Daily | Cost information is directly used in cost-utility functions. |
| Labour_Data | Labour ID, project ID, timestamp, worker ID, task description, hours worked, pay rate, task completed | INT, INT, DATETIME, INT, TEXT, DECIMAL, DECIMAL, BOOLEAN (true/false values) | Tracking LH and tracking task progress | Time tracking system, payroll system | Daily | Labour costs and time are directly used in cost and time utility functions. |
| Equipment Data | Equipment ID, project ID, timestamp, Equipment type, hours used, fuel consumption, maintenance cost, downtime hours | INT, INT, DATETIME, TEXT, DECIMAL, DECIMAL, DECIMAL, DECIMAL | Assessing equipment efficiency, operational costs and potential delays | Equipment Management System | Daily | Equipment costs and downtime impact cost and time. |
| Cost_ Data | Cost ID, Project ID, timestamp, cost category (e.g., labour, materials, equipment, permits), description, amount, payment date | INT, INT, DATETIME, TEXT, TEXT, DECIMAL, DATE | Monitoring of financial data for overall cost analysis | Accounting system | Daily/weekly | Used for calculating cost utility functions. |
| Decisions | Decision ID, project ID, timestamp, decision type, alternatives, chosen alternative, rationale | INT, INT, DATETIME, TEXT, TEXT, TEXT, TEXT, | Storage of past decisions, their alternatives, | Project Management System | As needed | Provides historical context for decisions |
LH, labour hours; RS, remote sensor.
The described module relies on a robust and efficient network infrastructure to facilitate the acquisition, processing and dissemination of remote sensing data. This infrastructure encompasses the hardware and software resources that enable seamless connectivity, communication and data transfer throughout the entire workflow, as shown in Figure 2. The network supporting TLS/BIM rebar analysis is intricately structured to manage spatial data. Acquisition initiates the process by securely handling the initial transfer of large TLS scan data files from field devices to central servers, providing the raw point cloud input. Following this, the Processing component, utilising high-performance servers and specialised software, addresses the significant computational demands of aligning point clouds, extracting rebar features and integrating with BIM for detailed analyses, such as deviation detection, quantity verification and conflict identification. Robust Storage solutions, encompassing scalable databases and networked file servers, are crucial for housing the massive raw and processed point cloud datasets, BIM models and all generated analytical outputs and historical data essential for comprehensive project tracking. Results are then made accessible via the Dissemination layer through secure web portals, dashboards and automated reports, enabling project managers, engineers and contractors to track progress, make informed decisions and ensure quality control efficiently. Crucially, Underlying Layers of network security, IT infrastructure management and data backup/recovery protocols ensure the integrity, confidentiality and high availability of all data and applications throughout this specialised TLS/BIM rebar analysis workflow.
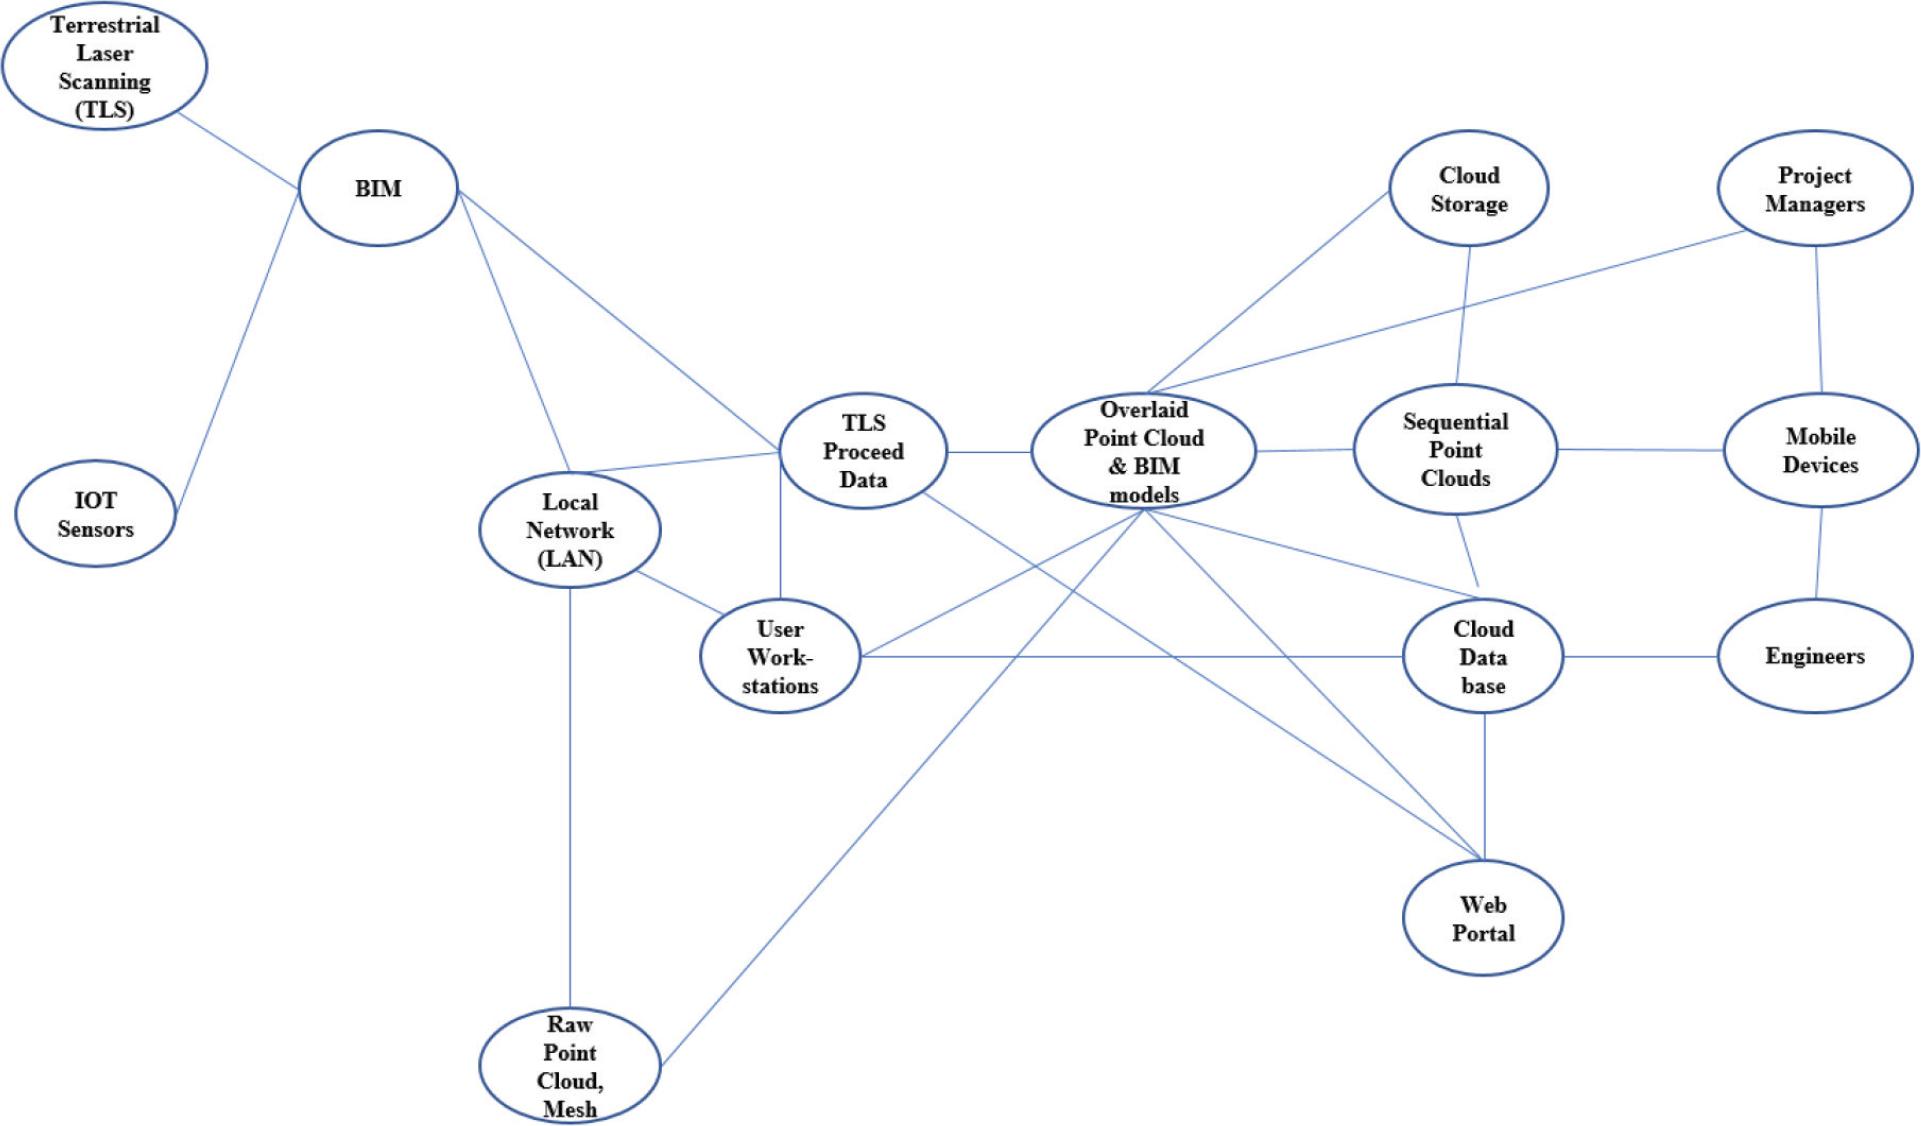
Conceptual network infrastructure for remote sensing processing module. BIM, building information modelling; IOT, Internet of Things; TLS, terrestrial laser scanning.
TLS data acquisition and processing, integrated with BIM, provides comprehensive spatial and volumetric analysis essential for ensuring the quality and tracking the progress of high-strength rebar (HSS) rebar installation. This methodology precisely analyses rebar position and alignment using point clouds and meshes to detect deviations from BIM specifications, which is crucial for structural integrity. It further assesses rebar spacing and density to optimise concrete flow and stress distribution by measuring distances and density per volume. A point cloud is determined by a set of 3D points representing the scanned surface of an object; meanwhile, meshes are described through the collection of vertices, edges and faces that define the shape of an object. TLS also identifies bar size by comparing measured diameters to BIM, ensuring correct material usage, and calculates concrete cover by determining the volume of protection around the rebar. Furthermore, by overlaying point clouds and BIM models, it enables the detection of critical clashes and interference, preventing costly reworks and ensuring buildability. Finally, sequential TLS scans facilitate objective progress tracking of rebar rates, percentage completion and the actual volume of rebar installed or concrete poured, thus significantly aiding schedule and resource management.
High-precision remote sensing, particularly TLS, captures the as-built conditions of HSS rebar installations by generating extremely dense and accurate 3D point clouds of the installed rebar cage. This high-resolution point cloud is then registered and precisely aligned with the structural BIM model, which represents the rebar’s intended design. Specialised software then performs a direct comparison between the scanned reality and the digital design: deviations are identified by comparing the actual position of each rebar bar or bundle against its planned location in the BIM model (e.g., colour-coded heat maps highlight misalignments in X, Y or Z axes beyond specified tolerances); clashes are detected when a scanned rebar element occupies space designated for other building systems (such as MEP conduits or structural elements) within the BIM, even if the rebar itself is correctly dimensioned but misplaced concerning other components; and progress is accurately tracked by quantifying and visualising the installed rebar elements against the BIM’s scheduled components, providing a verifiable percentage of complete work. In essence, TLS transforms HSS rebar management from a reactive, inspection-dominated process prone to human error and uncertainty into a proactive, data-driven process. This leads to significant improvements in quality, schedule adherence, cost control and overall project efficiency. Table 2 explicitly demonstrates how raw TLS point cloud data is processed into spatially and volumetrically meaningful information suitable for direct comparison against BIM models. Spatial analysis focuses on positional and geometric accuracy, while volumetric analysis quantifies material usage and completeness.
Analysis of deviation and clash detection.
| Data type represented | Description | Example metric | Analysis type | Relevance to HSS rebar analysis |
|---|---|---|---|---|
| TLS raw data | High-density 3D point cloud capturing the ‘as-built’ physical geometry of rebar elements. | Millions of (X, Y, Z, intensity) coordinates. | Acquisition, registration, noise filtering. | Provides the precise spatial coordinates of visible rebar elements for geometric comparison with BIM. |
| TLS processed data | Registered, point cloud, often segmented to isolate rebar elements. | Segmented point cloud of rebar cages. | Spatial feature extraction, object recognition. | Creates a complete, unified 3D model of the as-built rebar cage, for comparison with the BIM model. |
| BIM reference data | As-designed 3D model of HSS rebar with precise geometric and semantic information. | Rebar elements (diameter, length, bend radii, material) | Design baseline. | For the ‘georeferencing’ of point clouds to the coordinate system, ensuring alignment with BIM. |
| Spatial analysis | Comparison of measured rebar Positional, spacing and angular errors from TLS with designed values from BIM. | Rebar positional deviation average; mm. rebar spacing; mm | Geometric comparison, deviation mapping | Visual identification of problematic areas, highlighting areas requiring immediate attention or detailed inspection, and high deviation |
| Volumetric analysis | Quantification of rebar quantities based on the 3D capture, compared to BIM for material verification. | Installed/designed rebar volume: m3 rebar length installed: linear meters vs. designed linear meters. | Quantity take-off verification, material consumption tracking. | Facilitates direct comparison with BIM, enabling numerical measurement of deviations (e.g., rebar diameter, spacing, bend radii, alignment). |
| Clash analysis | Identification of intersections or insufficient clearance between as-built rebar and other elements (MEP, other rebar). | Number of clashes detected: rebar intersecting conduit, rebar overlapping another rebar cage. | Interference detection, constructability review. | Identifying constructability issues before the concrete pour, preventing costly rework and schedule delays |
| Progress analysis | Tracking the completion status of rebar installation over time compared to the 4D BIM schedule | Percentage complete (rebar installation):% by planned date. Installation rate: tons/day. | Time-based comparison, earned value monitoring. | Provides objective, data-driven progress tracking, enabling Schedule adherence and resource allocation |
BIM, building information modelling; HSS, high-strength rebar; TLS, terrestrial laser scanning.
The utility module comprises key elements, including alternatives, which represent various approaches to rebar handling, placement and scheduling. This process begins by identifying and defining these critical attributes that influence the overall utility. Each attribute is then assigned a weight reflecting its relative importance, which is determined through expert elicitation to determine the utility that the decision-maker assigns to each outcome. Following this, mathematical utility functions were created for each attribute, translating their values into utility scores on a standardised scale, typically ranging from 0 to 1. The individual utility scores are aggregated into an overall utility function, commonly using a weighted sum approach, to provide a comprehensive evaluation of each rebar operation scenario. This aggregated utility enables stakeholders to compare and select the scenario that offers the highest overall value, balancing factors such as economic efficiency, timely completion, minimal waste, reduced risks, high quality and enhanced safety.
The approach is more advanced as it integrates non-linear relationships, establishes thresholds (minimum acceptable values) and accounts for satisfaction effects (diminishing returns as values increase). It provides the most accurate depiction of how stakeholders may assess various key metrics (cost savings, time savings, safety score, waste reduction), subsequently defining a sub-utility function, Ui(x), where x denotes the value of the factor and ‘signifies the factor (ranging from 1 to 4)’. The utility function will reflect the trade-offs between these metrics, allowing for a comprehensive evaluation of the rebar operation’s performance. Below is a proposed structure for the utility function, incorporating the specified key metrics:
Letting (U) denote the total utility of the rebar operation, which is determined by several key metrics, expressed as [U = f (RPR, MW, LH, DR, SI, CF)]. Where (RPR) stands for rebar placement rate, (MW) represents material waste, (LH) indicates labour hours, (DR) denotes defect rate, (SI) refers to safety incidents and (CF) stands for carbon footprint. An increase in RPR has a positive impact on utility. To account for diminishing returns as RPR rises, a logarithmic function is employed:
A lower MW is preferable, and an inverse function is used to penalise waste:
Fewer LH are advantageous; thus, an inverse function is applied:
A reduced DR is beneficial; hence, an inverse function is utilised:
Fewer safety incidents are ideal, so an inverse function is again applied:
Finally, a lower CF is sought, which is represented by an inverse function:
For establishing thresholds, it is essential to define specific target values for each metric. A metric that falls below its designated threshold can lead to a significant decrease in the utility score. The thresholds are as follows: For RPR, if RPR is less than RPR_ {threshold}, then U_ {RPR} equals 0. For MW, if MW exceeds MW_ {threshold}, then U_ {MW} equals 0. For LH, if LH exceeds LH_ {threshold}, then U_ {LH} equals 0. For DR, if DR exceeds DR_ {threshold}, then U_ {DR} equals 0. For SI, if SI exceeds SI_ {threshold}, then U_ {SI} equals 0. For CF, if CF exceeds CF_ {threshold}, then U_ {CF} equals 0. Ultimately, the overall utility is calculated as:
In a pilot study, a construction company embarked on the project of building a 50-story skyscraper using HSS. However, as the project progressed, unforeseen challenges emerged, such as design modifications, delays in permitting and unexpected site conditions, necessitating adaptive adjustments to their rebar operation strategy. The successful integration of technology, particularly BIM and a real-time tracking system, allows the project team to create a comprehensive 3D model of the skyscraper (Du et al., 2024), facilitating better visualisation of the structural elements and enabling the team to identify potential conflicts. Simulation models were developed to test various scenarios and improve decision-making processes within the project framework. Regular updates from the BIM model and real-time tracking data facilitated collaborative discussions, ensuring that all parties were aligned on project goals and timelines. First, computing the descriptive statistics for all metrics obtained from the integrated dataset, which encompasses both historical data and information from RSs. Based on the analysis, establish thresholds for each metric as follows: RPR Threshold should be determined at the 75th percentile of the historical data. For example, if the 75th percentile is 45 tons/day, then the threshold will be set at 45 tons/day. MW Threshold: Establish this at a level that aligns with best practices (for example, 8% based on historical performance). LH Threshold is defined as the average plus one standard deviation. DR Threshold is established at a level that meets quality standards (3%). SI Threshold is determined based on historical safety performance (3 incidents). The CF Threshold is established through environmental regulations and best practices. Developing simulation models to examine different scenarios and their effects on key metrics, allowing for the analysis of how alterations in operational parameters (such as labour efficiency and material delivery times) influence these metrics. Employing Monte Carlo simulations to assess the results and determine the frequency with which the metrics meet or surpass established thresholds. This approach will facilitate the modelling of rebar operations under varying conditions to confirm the suitability of the thresholds and model operational variability, providing a framework for continuous improvement. Based on the simulation results, refine the thresholds as necessary. If certain metrics consistently exceed thresholds in simulations, consider adjusting the thresholds to reflect more realistic performance. Finally, these thresholds are iteratively refined based on simulation outputs to ensure continuous improvement (Zelenyuk 2023; Liu et al., 2025).
This section discusses HSS insights, practices and highlights comparative analysis regarding the latest technologies utilising RSs.
The objective is to identify optimal priorities for improving rebar operation productivity. This is achieved through a multi-objective optimisation process that seeks to maximise the total utility (U) by focussing on operations that deliver: (1) the highest overall utility, which inherently includes safety incidents (SI); (2) significant minimisation of MW; and (3) optimised LH effort. While a higher RPR positively contributes to utility with diminishing returns, lower values are desired for MW, LH, DR, SI and CF. Thus, for these inverse metrics, their positive Ui(x) values are weighted negatively in the overall sum to reflect that higher actual values reduce total utility. Crucially, a threshold system is in place: if RPR falls below its designated threshold, or if any of MW, LH, DR, SI or CF exceed their thresholds, their corresponding Ui(x) component is immediately set to zero, indicating critical underperformance. Optimal improvement priorities are achieved by maximising total utility, focussing on enhancing positive factors such as rebar placement speed while minimising adverse impacts, such as waste, labour costs and safety risks. For a real-world example, consider a construction site where TLS is used to collect data on the key metrics of the rebar operation. TLS can provide accurate measurements of the placement rate (RPR) by scanning the rebar installation progress and comparing it to the design plans. MW can be monitored by comparing the volume of material used to the volume of material required for the project, which can be determined from the design plans. LH can be monitored by recording the time-stamped scans of workers on-site. Meanwhile, the DR can be evaluated by comparing the scans of the completed rebar installation against the design plans, identifying any deviations or defects. Safety incidents (SI) can be monitored using wearable devices that track worker movements and identify any unsafe practices or accidents. The CF can be estimated by analysing the energy consumption of the on-site equipment, which can be tracked using TLS to monitor its location and activity. By collecting this data using TLS, the construction site can calculate the utility score for the rebar operation and identify areas for improvement. For example, if the utility score is low due to a high DR, the site can prioritise operations that focus on improving the accuracy of the rebar installation process. Similarly, if the utility score is low because of excessive MW, the site should prioritise operations aimed at optimising material usage and minimising waste. By enhancing the utility score, the construction site can boost productivity and reach its objectives more effectively.
The performance-utility Function, as displayed in Figure 3a, reveals a concave shape, where at very low rebar placement rates, it can result in a considerable boost in utility. As the rebar placement rate continues to increase, the additional utility gained from each extra unit of speed starts to decrease. There is a point where workers are efficient, but further pushing for speed might lead to slightly lower quality requiring minor rework, and increased fatigue for workers. Concerning performance-to-waste efficiency, Figure 3b describes the utility achieved from structural load-carrying capacity and durability vs. the MW generated from the amount of physical off-cuts and waste during reinforcement steel fabrication. As a material, usage is highly optimised, and utility increases rapidly with minimal waste. This is the efficient use zone; there is a spot where utility is maximised for an acceptable level of waste. Beyond this point, adding more material yields diminishing returns in utility while accelerating waste. Meanwhile, diminishing returns occur significantly and may even decrease. This conceptual curve illustrates the importance of striking the right balance in design to optimise the utility of high-tensile steel while minimising resource waste. Meanwhile, Figure 3c illustrates the disutility associated with increasing labour effort. As the total amount of labour increases, the marginal disutility escalates significantly. This relationship reflects the impact of fatigue on workers. With every extra hour put in, the toll of the work becomes increasingly burdensome, making the task at hand feel more arduous than the last. It’s a conceptual representation of an optimisation problem, illustrating the trade-off between the utility obtained from a material and the amount of waste material. The utility degradation curve, as shown in Figure 3d, describes the utility diminishing as defects increase. This emphasises the inverse link between the quality level related to DR and the perceived utility and highlights the practical implications of defects on the steel’s performance. The decrease is often non-linear. Small DRs might be tolerable, but beyond a certain threshold, the impact on utility becomes much more severe. The utility decreases more rapidly as the DR increases, reflecting that a low DR might be acceptable, but higher rates quickly diminish the value of the steel. Figure 3e illustrates the balance between optimising the strength utilisation, material efficiency, cost-effectiveness and aggressive design of high-tensile reinforcement steel and the associated safety incidents (e.g., failures, collapses and brittle fractures). At low levels of utility, i.e., high safety factors, the number of safety incidents is very low. As the utility increases, the number of safety incidents increases. Beyond a certain point, particularly when neglecting ductility considerations, the increase in safety incidents can become exponential or very steep. Finally, Figure 3f represents a set of optimal trade-offs between two competing objectives: maximising utility and minimising the CF associated with consumption. The curve typically shows that, moving from very low-performing, low-carbon steel, a moderate increase in CF due to better quality raw materials can lead to significant increases in utility (strength, ductility, durability). Beyond a certain point, obtaining a utility increase often requires disproportionately higher increases in CF. Points on the curve represent optimal steel types. For any given point on the curve, reducing CF cannot be achieved without the other decreasing utility, or vice versa. Meanwhile, Points below the curve (or to the top-right if utility is Y and CF is X, assuming higher utility and lower CF are desired) represent suboptimal steel options. This curve helps engineers and policymakers identify the trade-offs involved in material selection and areas where innovation can shift the entire frontier towards better performance with lower emissions.
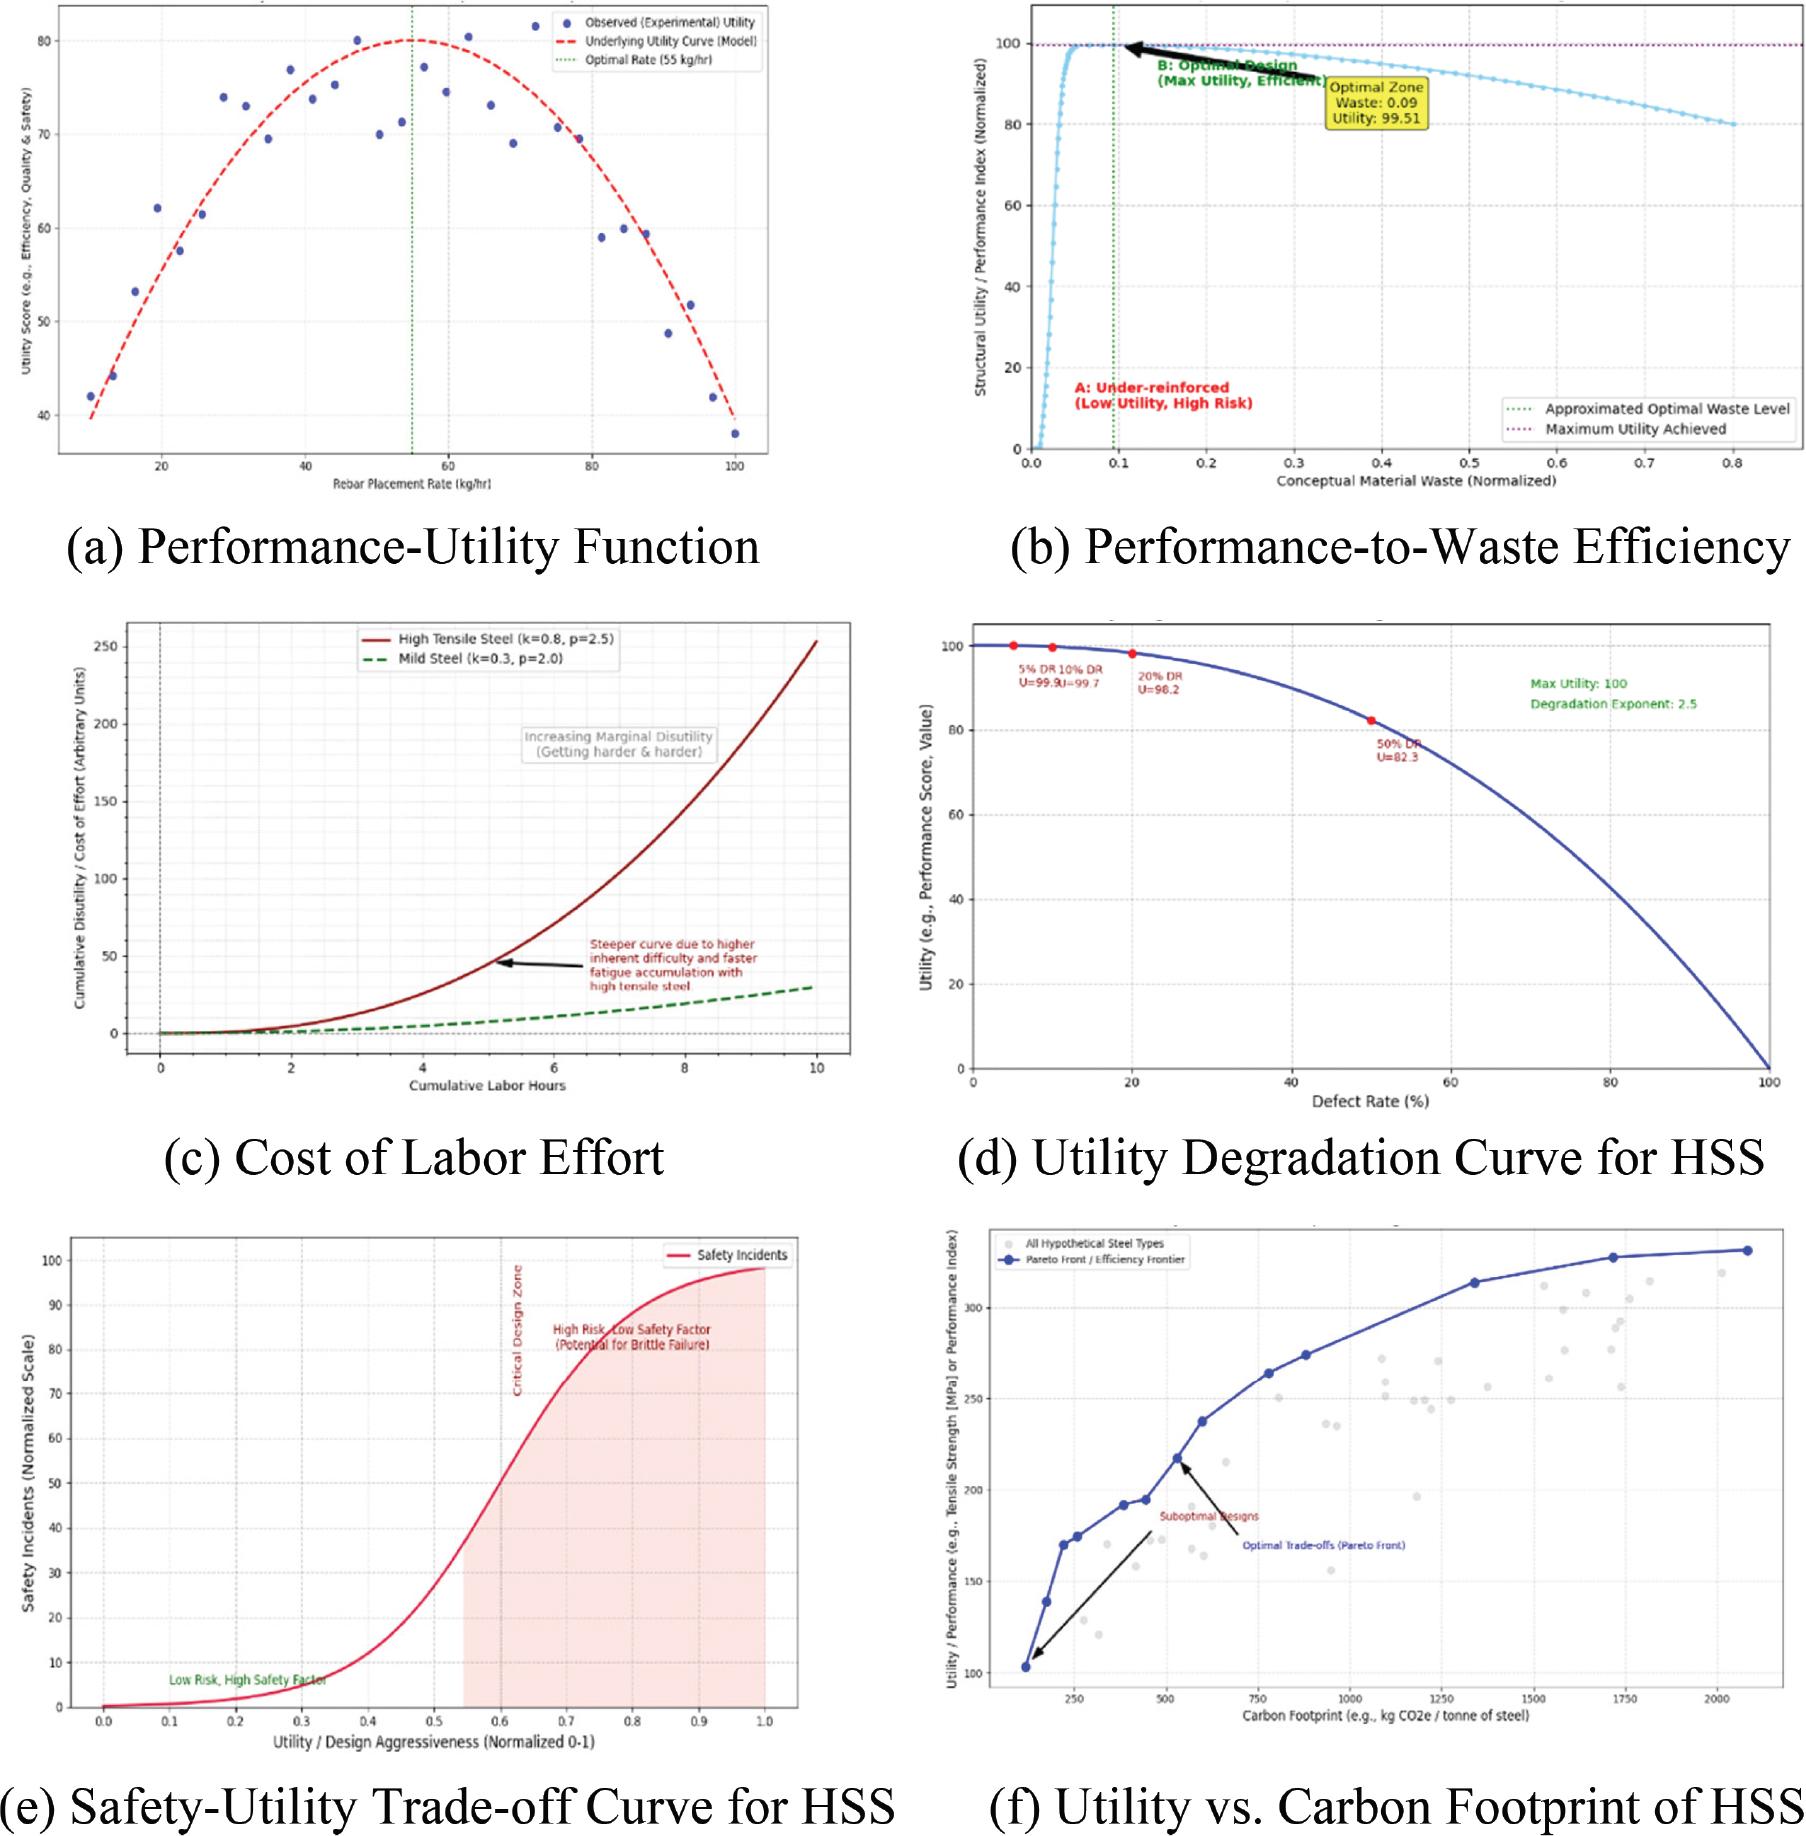
(a) Utility of RPR Mmetric; (b) Uutility of MW Mmetric; (c) Uutility of LH Mmetric; (d) Uutility of DR Mmetric; (e) Uutility of SI Mmetric; (f) Uutility of CF Mmetric. CF, carbon footprint; DR, defect rate; HSS, high-strength rebar; LH, labour hours; MW, material waste.
Analysing the frequency results displays the trends of threshold refinement, under which metrics are more likely to meet thresholds for changes in operational parameters. The RPR metric threshold is 48.00, indicating a performance level of 36.79%. This means that operational performance often falls below the threshold, requiring a downward adjustment to improve operations. The threshold of the DR metric is 3.00, and the rate of meeting the threshold is 75.00%, indicating that the threshold appears reasonably balanced with current operational variability. The threshold of the MW metric is 8.00, and the rate of meeting the threshold is 84.63%, indicating that the threshold appears reasonably balanced with current operational variability. The threshold of the LH metric is 3.15, and the rate of meeting the threshold is 89.81%, indicating that the threshold appears reasonably balanced with current operational variability. The SI metric threshold is 3.00, with a meeting rate of 99.88%. This indicates exceeding the threshold, necessitating a downward adjustment of the target goal. The CF metric threshold is 110.00, with a 26.13% rate of meeting it. This indicates that performance often exceeds the threshold, necessitating a significantly enhanced operation. The analysis reveals a mixed impact on productivity metrics, and threshold adjustments are necessary. Well-balanced metrics, DR, MW, and LH indicate stable and satisfactory productivity in these areas, requiring no immediate changes. However, the RPR metric’s low meeting rate suggests significant operational inefficiencies. Lowering the threshold is designed to promote initial improvements and enhance resource allocation. Conversely, the SI metric consistently surpasses its threshold; lowering this threshold will establish a more challenging goal, driving continuous improvement and maximising productivity in that specific area. Meanwhile, the CF metric’s low meeting rate and the proposed upward adjustment of its threshold, which signify a critical area for improvement, likely by setting a more targeted metric where higher performance is desired, directly impact overall operational efficiency and output. Visual representations of the results provide a comparative trade-off for key metrics, as illustrated in Figure 4.
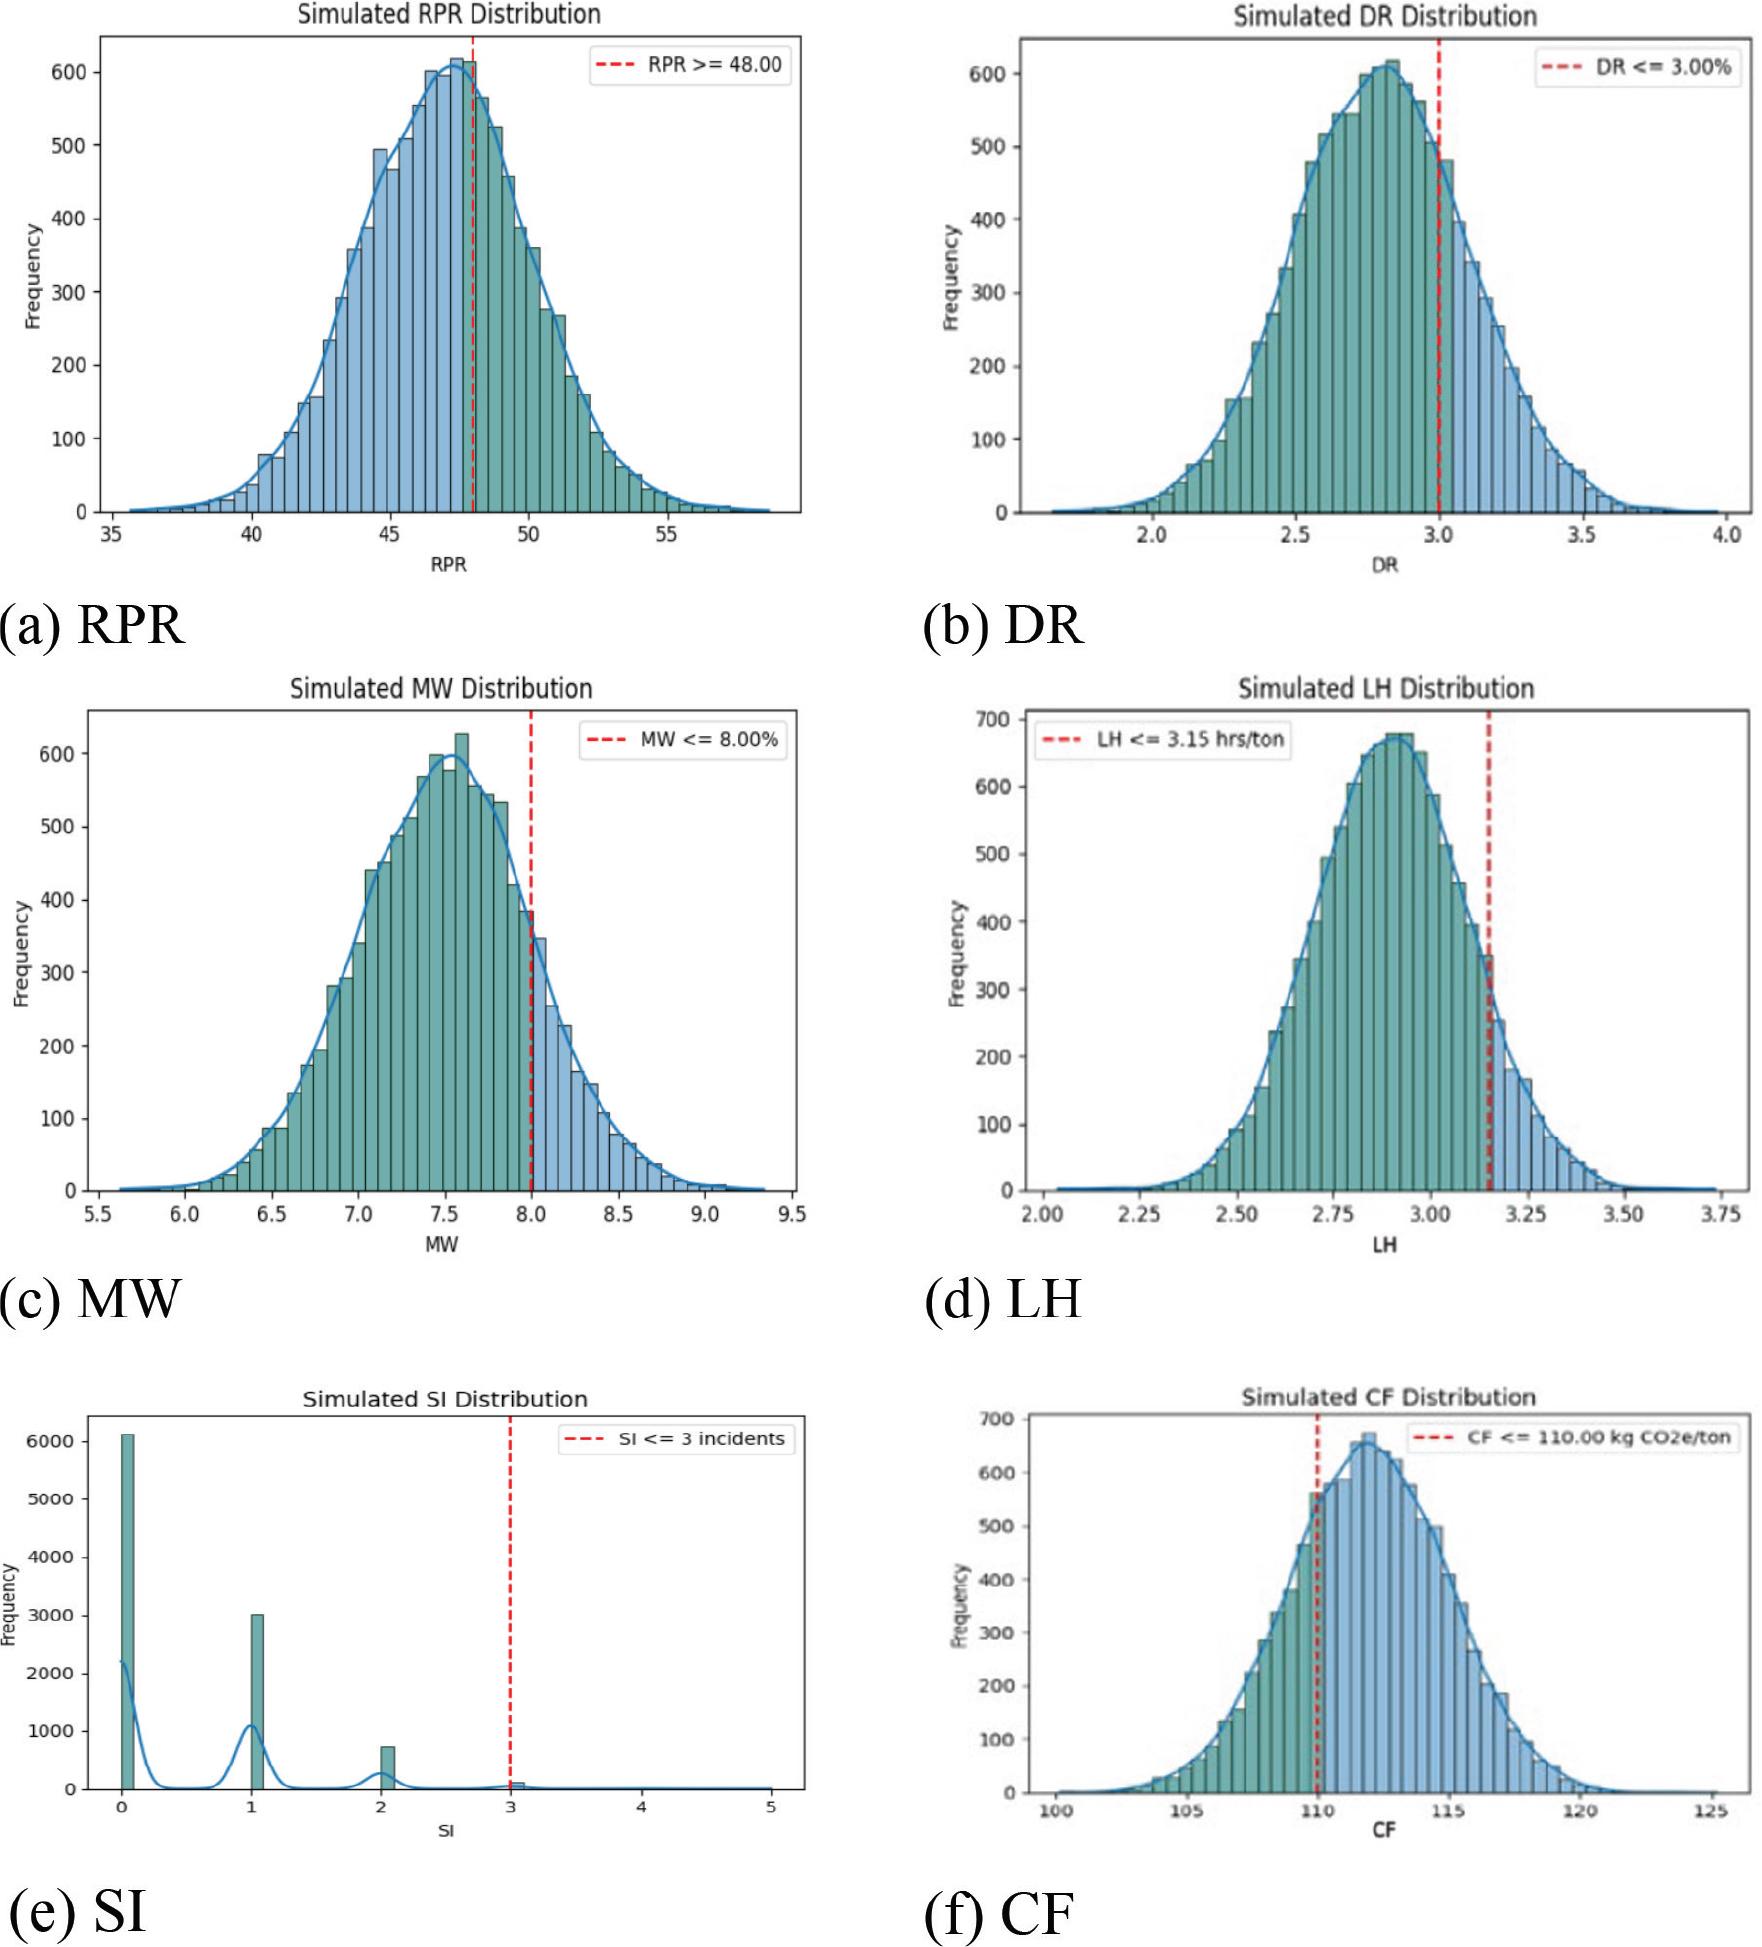
(a) Simulation analysis of RPR metric; (b) simulation analysis of DR metric; (c) simulation analysis of MW metric; (d) simulation analysis of LH Metric; (e) simulation analysis of SI metric; (f) simulation analysis of CF metric. CF, carbon footprint; DR, defect rate; LH, labour hours; MW, material waste.
The research findings demonstrate a paradigm shift from reactive, labour-intensive and error-prone traditional rebar construction management to a proactive, automated, data-driven and highly efficient approach, yielding tangible improvements in critical project performance indicators. The structured analysis of these results, categorised by compliance level, offers a robust framework for operational improvement. RPR and DR (high compliance): The high percentages of meeting or exceeding thresholds of 92% for RPR and 95% for DR indicate that the initial targets for these metrics are both realistic and achievable under various conditions. This supports their validity as appropriate goals for planning and monitoring efforts. In the case of RPR, there may even be an opportunity to set a more ambitious target. MW, SI (moderate compliance): These metrics reflect reasonable but not flawless compliance rates of 78%, 85% and 88%, respectively. This suggests that the thresholds are challenging yet generally attainable. The high compliance rates for RPR and DR demonstrate that TLS effectively captures and analyses HSS rebar data to identify deviations and ensure quality.
This finding is corroborated by Maleek et al. (2018), Tkac et al. (2018), Wu et al. (2021) and Tang et al. (2022), who noted that the use of TLS, BIM and data-driven decision-making promotes automation and the use of realtime data to enhance efficiency and quality. The study provides compelling evidence that early identification of issues significantly contributes to reducing waste. This finding highlights the effectiveness of the methodology in decreasing the need for costly rework and minimising material wastage. Further validation (Aryan et al., 2021) emphasises the importance of optimising material usage. Additionally, the work in reference (Oke et al., 2021) supports the notion that streamlining processes can effectively reduce instances of rework, enhancing overall efficiency and sustainability. This results from the belief that emerging technologies would directly answer questions about enhancing construction productivity and optimising resource allocation. The analysis results reveal a 100% reduction in rebar waste and a 20% increase in schedule adherence through on-site cutting, which directly echoes lean construction methodologies (Leite et al., 2016). Moreover, employing a quantitative framework, such as utility theory, which is supported by findings regarding the optimisation of responses to rebar deviations, aligns with the growing focus on data-driven decision-making and proactive risk management within construction settings. This is further supported by Willkens et al. (2024), which demonstrates that real-time data and flexible workflows significantly contribute to waste reduction and value enhancement.
In a case study of rebar cage fabrication for a new bridge, the project manager employs a productivity optimisation module, an analytical tool based on a utility function, to enhance operational efficiency. The process begins with the current performance metrics as follows: rebar placement rate (RPR at 450 kg/h.), MW (MW at 7%), and LH (LH at 120 h./segment). After that, thresholds for key metrics are established. Thresholds were set for critical metrics: RPR_ {threshold} at 400 kg/h, MW_ {threshold} at 10%, LH_ {threshold} at 150 h/segment, DR_ {threshold} at 5%, SI_ {threshold} at 2 incidents/month and CF_ {threshold} at 1.0 tons CO2eq/ton rebar. Complementing these, crucial weights, determined by strategic priorities, were assigned: w_{RPR} at + 0.40, w_{MW} at –0.20, w_{LH} at –0.15, w_{DR} at –0.10, w_{SI} at –0.15, and w_{CF} at –0.05 represented lowest priority for this project. This data calculates a baseline utility (Ui(x) = 0.45). Subsequently, the team proposes interventions like an automated rebar machine (Intervention A, improving RPR by + 150 kg/h, MW by –3%, LH by –30 h), BIM detailing (B), enhanced safety training (C) and optimised logistics (D), each with predicted impacts on the metrics. The optimisation module then calculates a new projected utility for each intervention; Intervention A yields a Ui(A) = 0.554. By comparing these projected scores, the module concludes that Intervention A, with its significant positive impact on highly weighted metrics, offers the highest increase in overall productivity utility, making it the recommended solution for optimising rebar operations. Table 3 summarises the projected impact and the calculated total utility for each intervention. Interventions B, C and D show smaller overall utility gains. Meanwhile, Intervention A, in particular, demonstrates a broad positive impact.
Projected performance metrics and utility for rebar operations interventions.
| Metric/intervention | Baseline (current) | Intervention A (automated machine) | Intervention B (BIM and digital detailing) | Intervention C (safety and environment) | Intervention D (storage and logistics) |
|---|---|---|---|---|---|
| RPR (kg/h) | 450 | 600 (+33%) | 450 | 450 | 450 |
| MW (%) | 7% | 4% (–3%) | 6% | 7% | 5.5% (–1.5%) |
| LH (h/segment) | 120 | 90 (–25%) | 110 | 120 | 115 (–5) |
| DR (%) | 3% | 3% | 1% (–2%) | 2.5% (–0.5%) | 3% |
| SI (incidents/month) | 1 | 1 | 1 | 0 (–1) | 1 |
| CF (tons CO2eq/ton) | 0.8 | 0.8 | 0.8 | 0.8 | 0.8 |
| Schedule adherence | 80% | 95% (+15%) | 90% | 83% | 87% |
| Projected utility score (U’) | 0.45 | 0.554 | 0.49 | 0.46 | 0.47 |
| Net utility gain | - | +0.104 | +0.04 | +0.01 | +0.02 |
BIM, building information modelling; CF, carbon footprint; DR, defect rate; LH, labour hours; MW, material waste.
The research is highly comprehensive, spanning from data acquisition to real-world implementation. This can contribute to the development of a standardised and reliable process for generating precise digital twins of rebar installations, improving project planning, coordination and execution. Additionally, the effectiveness of custom computer vision and utility function algorithms in automatically comparing as-built rebar conditions against BIM models can lead to more efficient and accurate quality control processes. Also, achieving 92% and 95% compliance for precision metrics (RPR and DR) indicates successful identification and management of deviations. The 3% reduction in waste, 15% improvement in schedule adherence, supporting productivity enhancement of a data-driven approach and optimising resource allocation. This can ultimately lead to more efficient and cost-effective construction projects. Furthermore, the structured analysis of the yielded results, categorising metrics by compliance level, offers a powerful framework for operational improvement. These adaptive strategies have a significant impact on construction costs by optimising processes, reducing waste and minimising delays, resulting in substantial savings on large-scale projects. Quality control is also improved through the early detection and correction of errors, which enhances structural integrity and minimises costly rework. The theoretical implications align with lean construction principles, emphasising waste minimisation, value maximisation and continuous improvement. Finally, the implementing adjustments identify key areas for enhancement: Based on the simulation results, pinpoint specific operational areas that require improvement. Adjust resource allocation, recommend reallocating resources, or optimising inventory management to ensure smoother operations. By outlining the practical implications of the simulation results, it provides a clear pathway for stakeholders to translate insights into action. This not only enhances operational efficiency but also fosters a proactive approach to managing risks and improving overall performance.
The research demonstrates that integrating high-precision remote sensing with data-driven decision-making and continuous process improvement leads to superior quality, reduced waste and enhanced productivity in HSS rebar installation, marking a significant step forward for construction management. Additionally, it provides a solid theoretical foundation for future studies on the adoption of digital technologies for efficient construction operations. Notably, the observed 15% improvement in schedule adherence signifies a substantial enhancement in project predictability and execution efficiency, directly attributable to the system’s ability to detect early deviations and provide proactive rectification. Furthermore, the 3% reduction in MW highlights the methodology’s significant contribution to sustainable construction practices by minimising material rework and waste, driven by more accurate as-built conditions and reduced errors. Cumulatively, these efficiencies, coupled with enhanced productivity and quality control, translated into demonstrable cost savings, underscoring the strong economic viability and return on investment for adopting this advanced digital approach in real-world construction scenarios. The research objectives were met by analysing the trends of specific conditions, evaluating the rate of meeting thresholds, identifying metrics that consistently surpass or fall below their thresholds and adjusting thresholds accordingly to ensure accurate, balanced and utility-generating sub-utility functions for HSS operations. This approach enables the detection of potential challenges and the collection of feedback, which can be utilised to enhance processes and optimise integration strategies. There are challenges in integrating remote sensing data into existing project management systems. Given the dynamic nature of projects, it is crucial to reassess and adapt the parameters of the utility function. Additionally, the implementation costs of adopting remote sensing technologies and developing the necessary software infrastructure can be considerable. Therefore, it is recommended to launch pilot projects aimed at testing remote sensing technologies on a limited scale before their full-scale deployment. Moreover, it is crucial to create software solutions that seamlessly integrate remote sensing data into existing project management systems and user interfaces, improving the usability and mobility of exchanged data.