
Fig. 1:
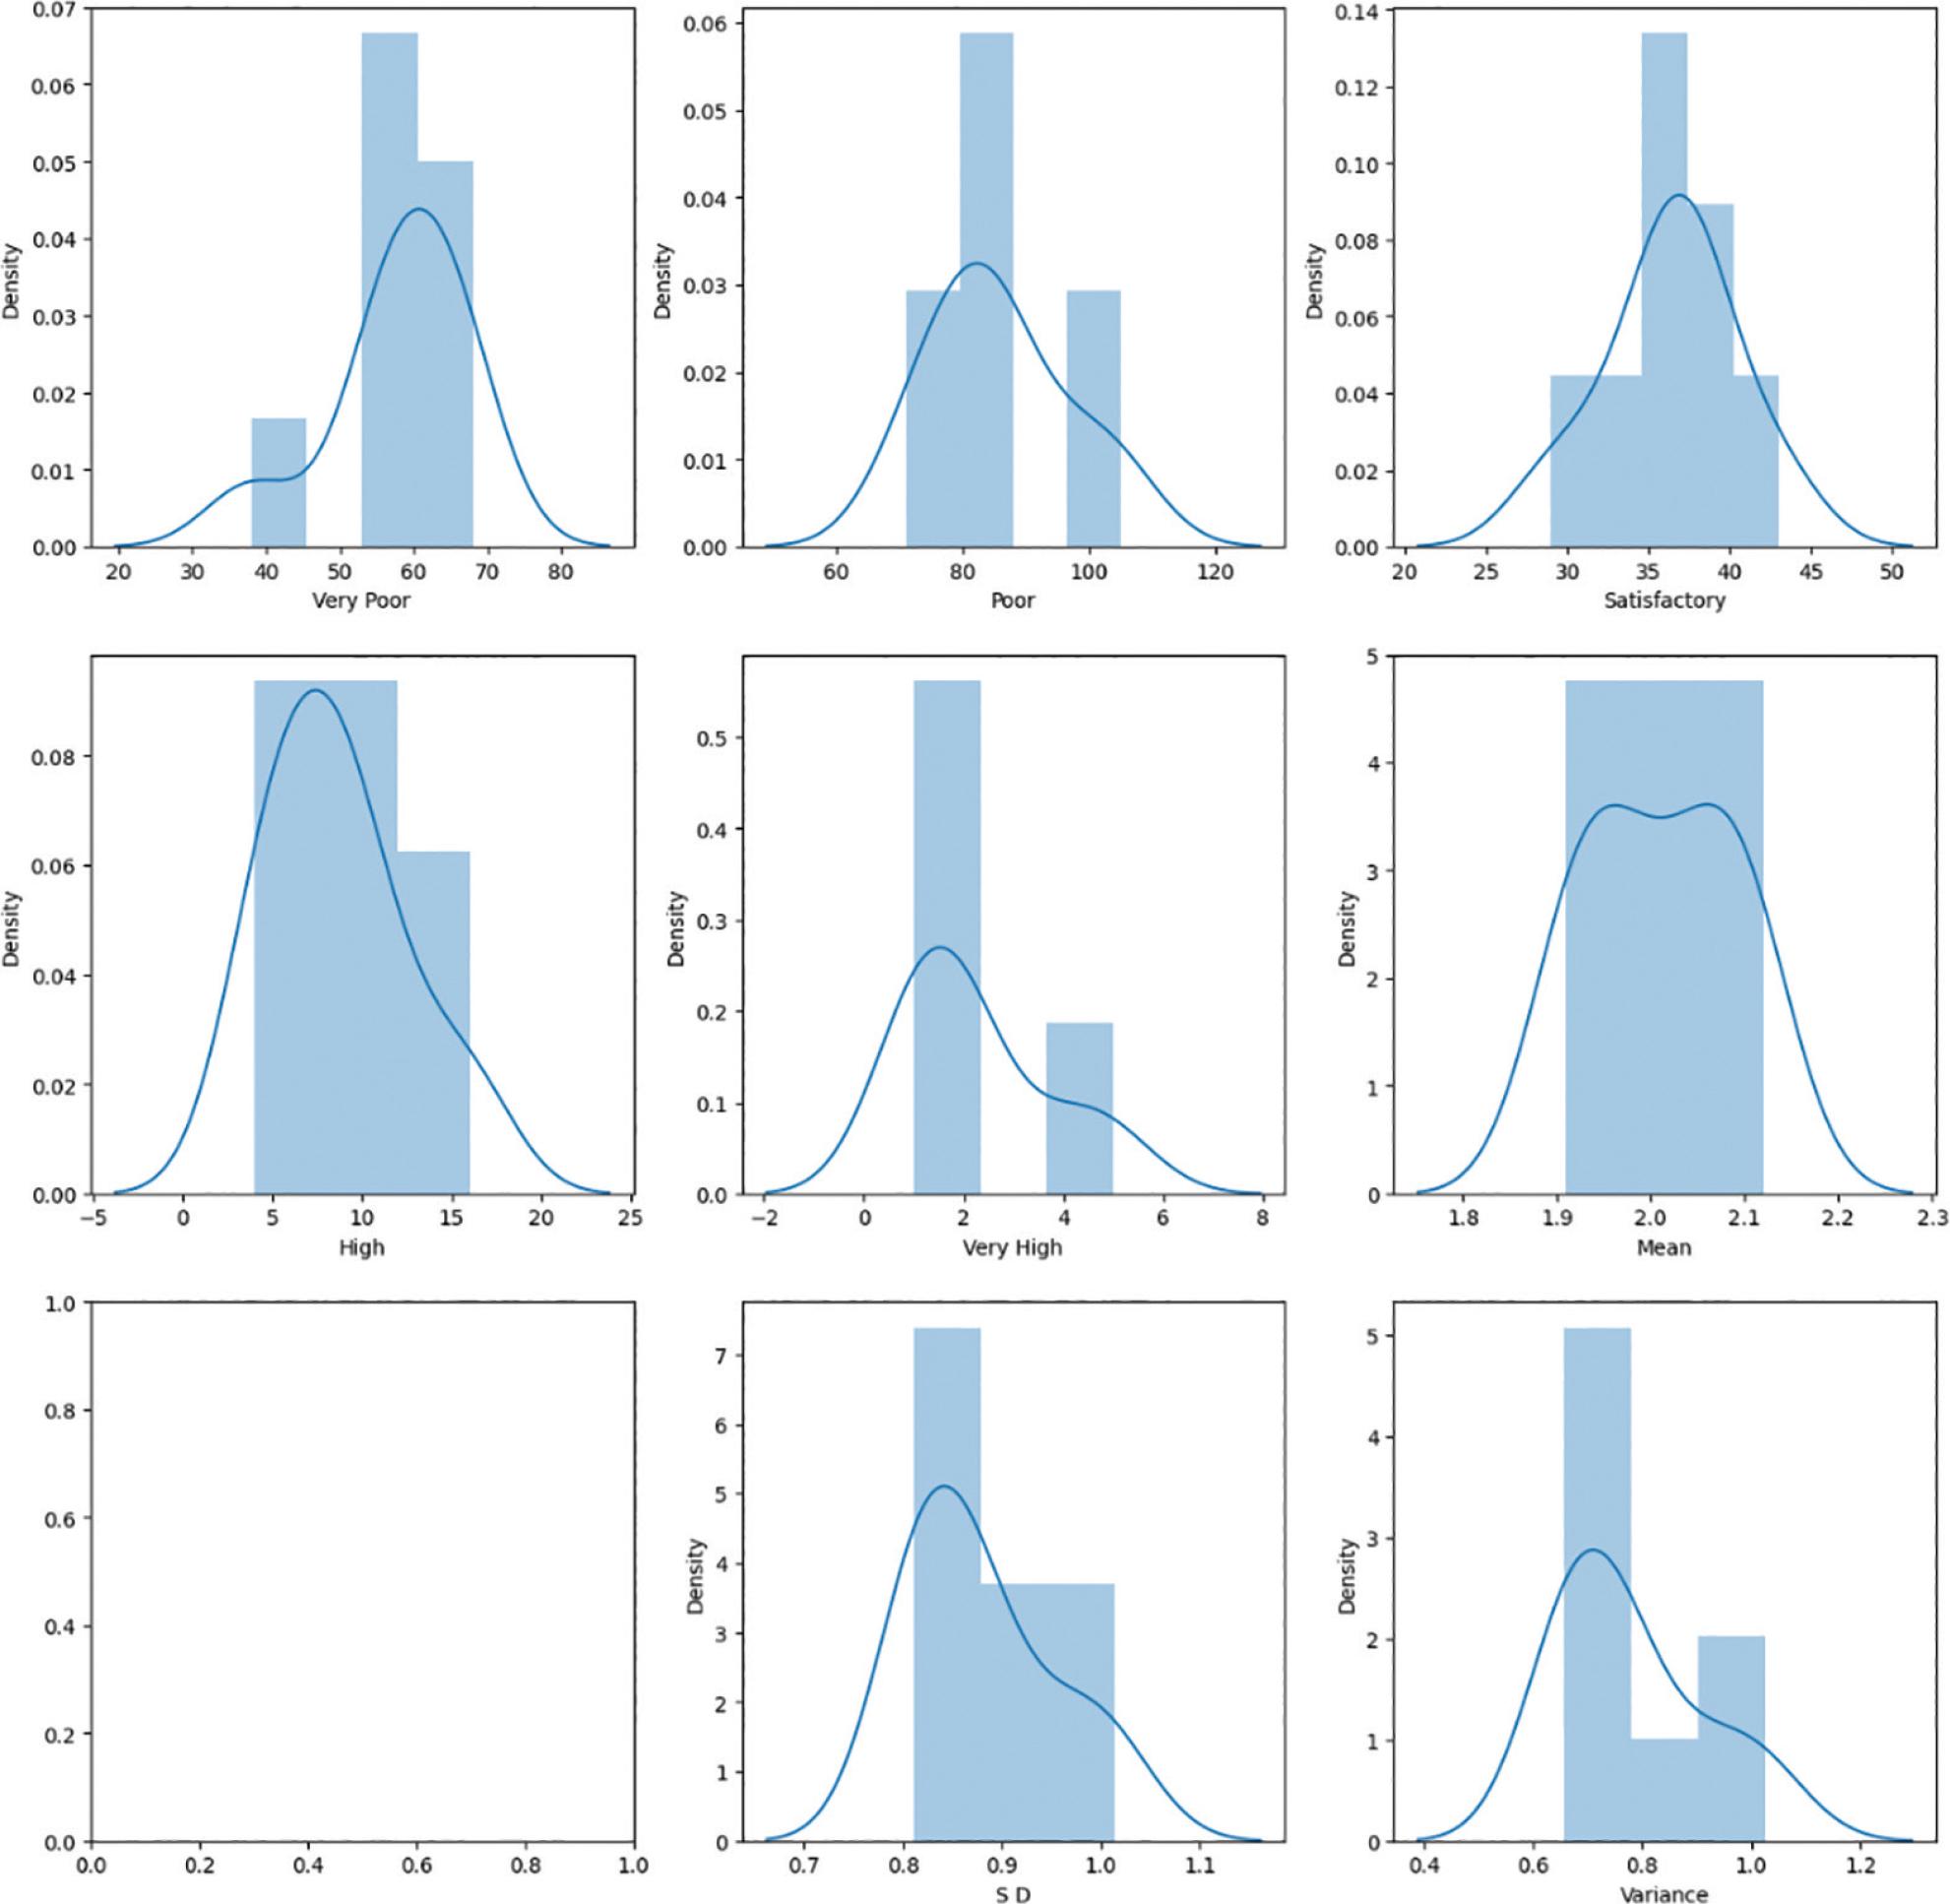
Fig. 2:
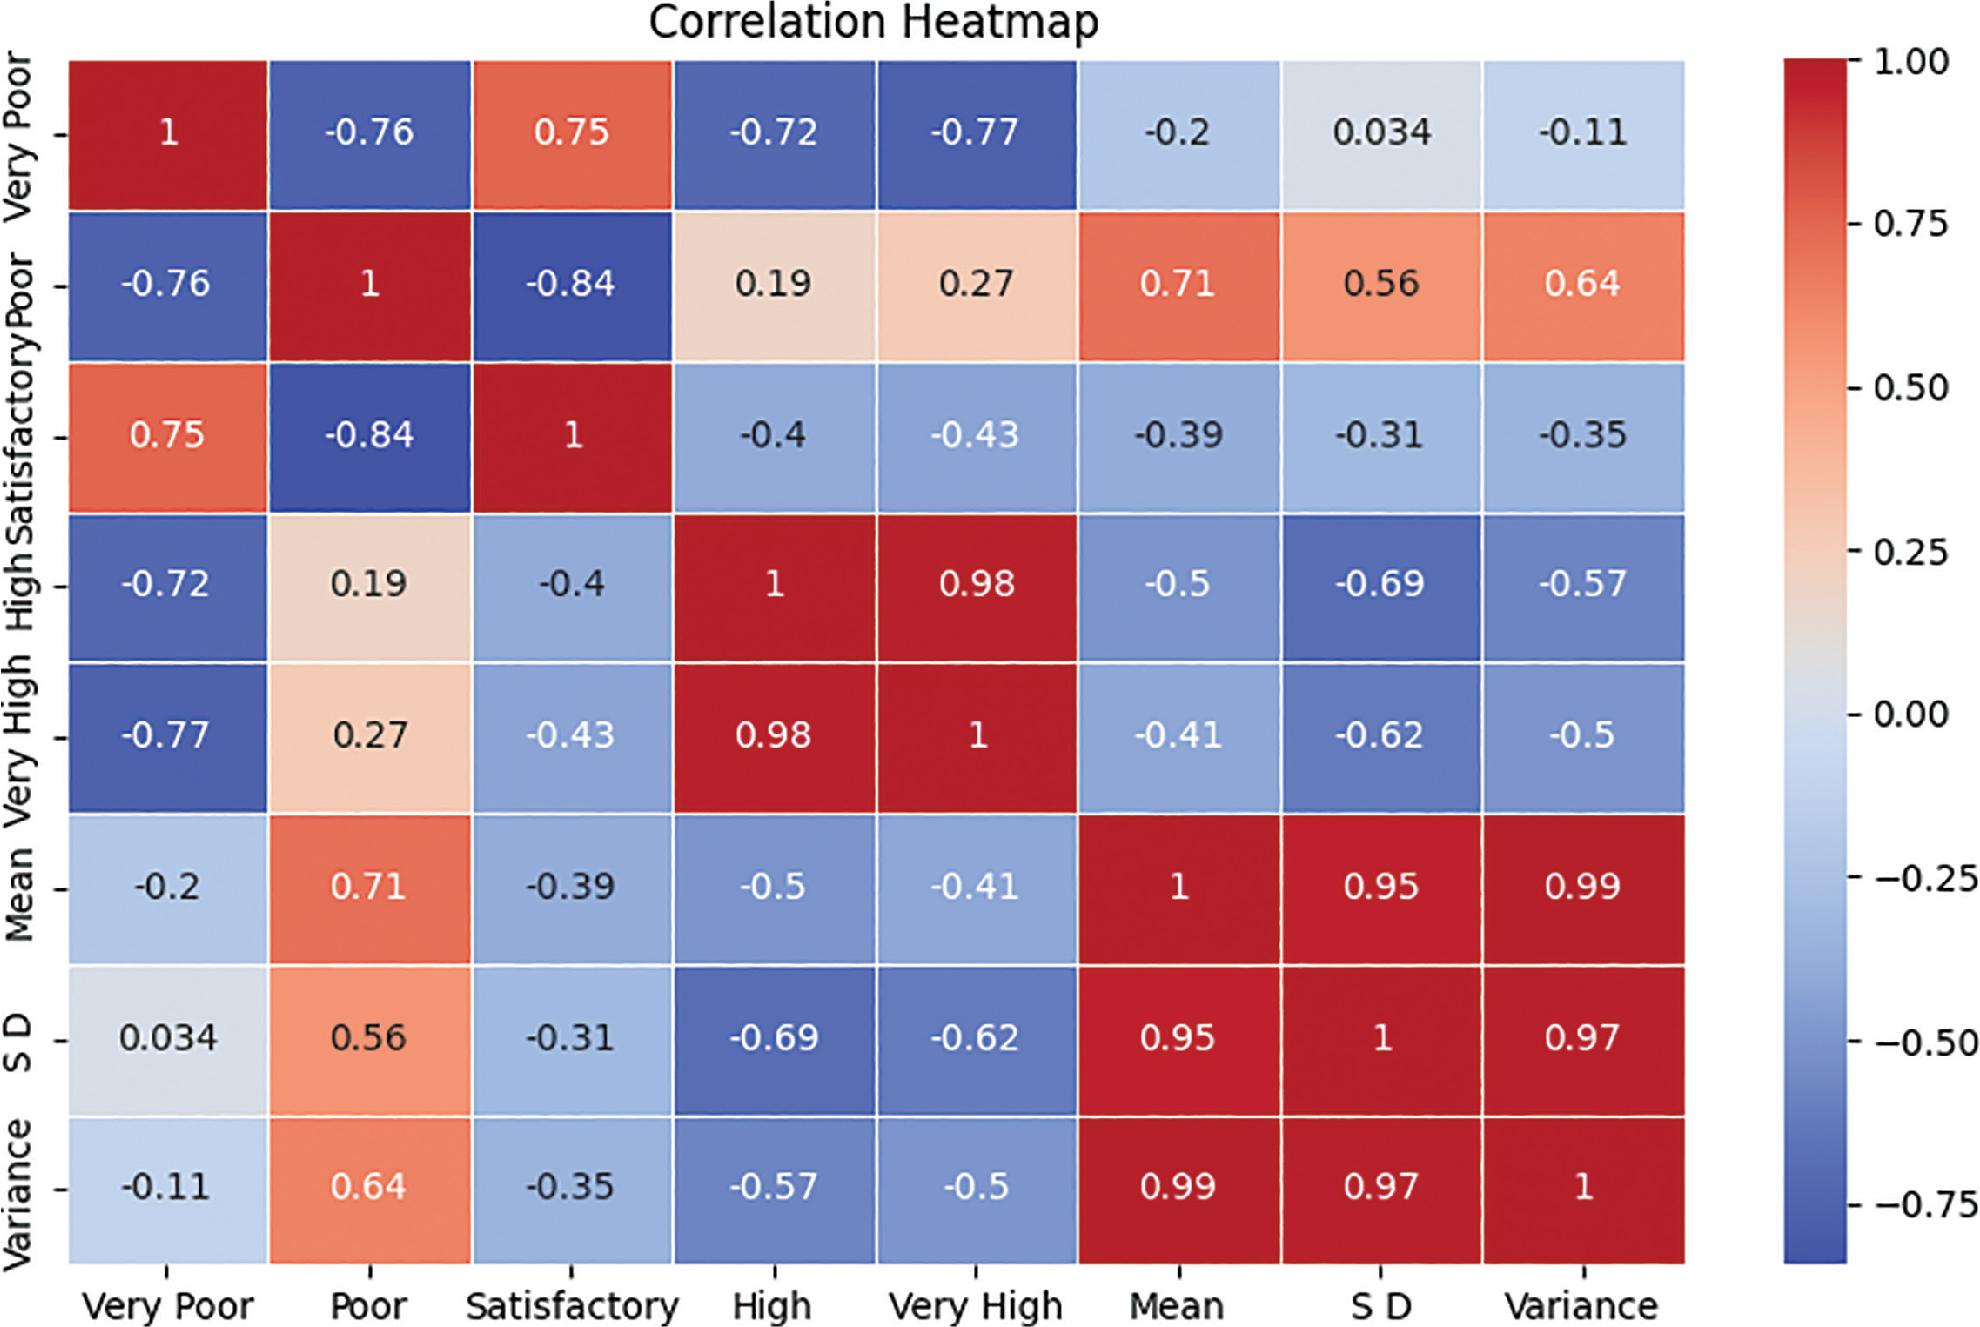
Fig. 3:
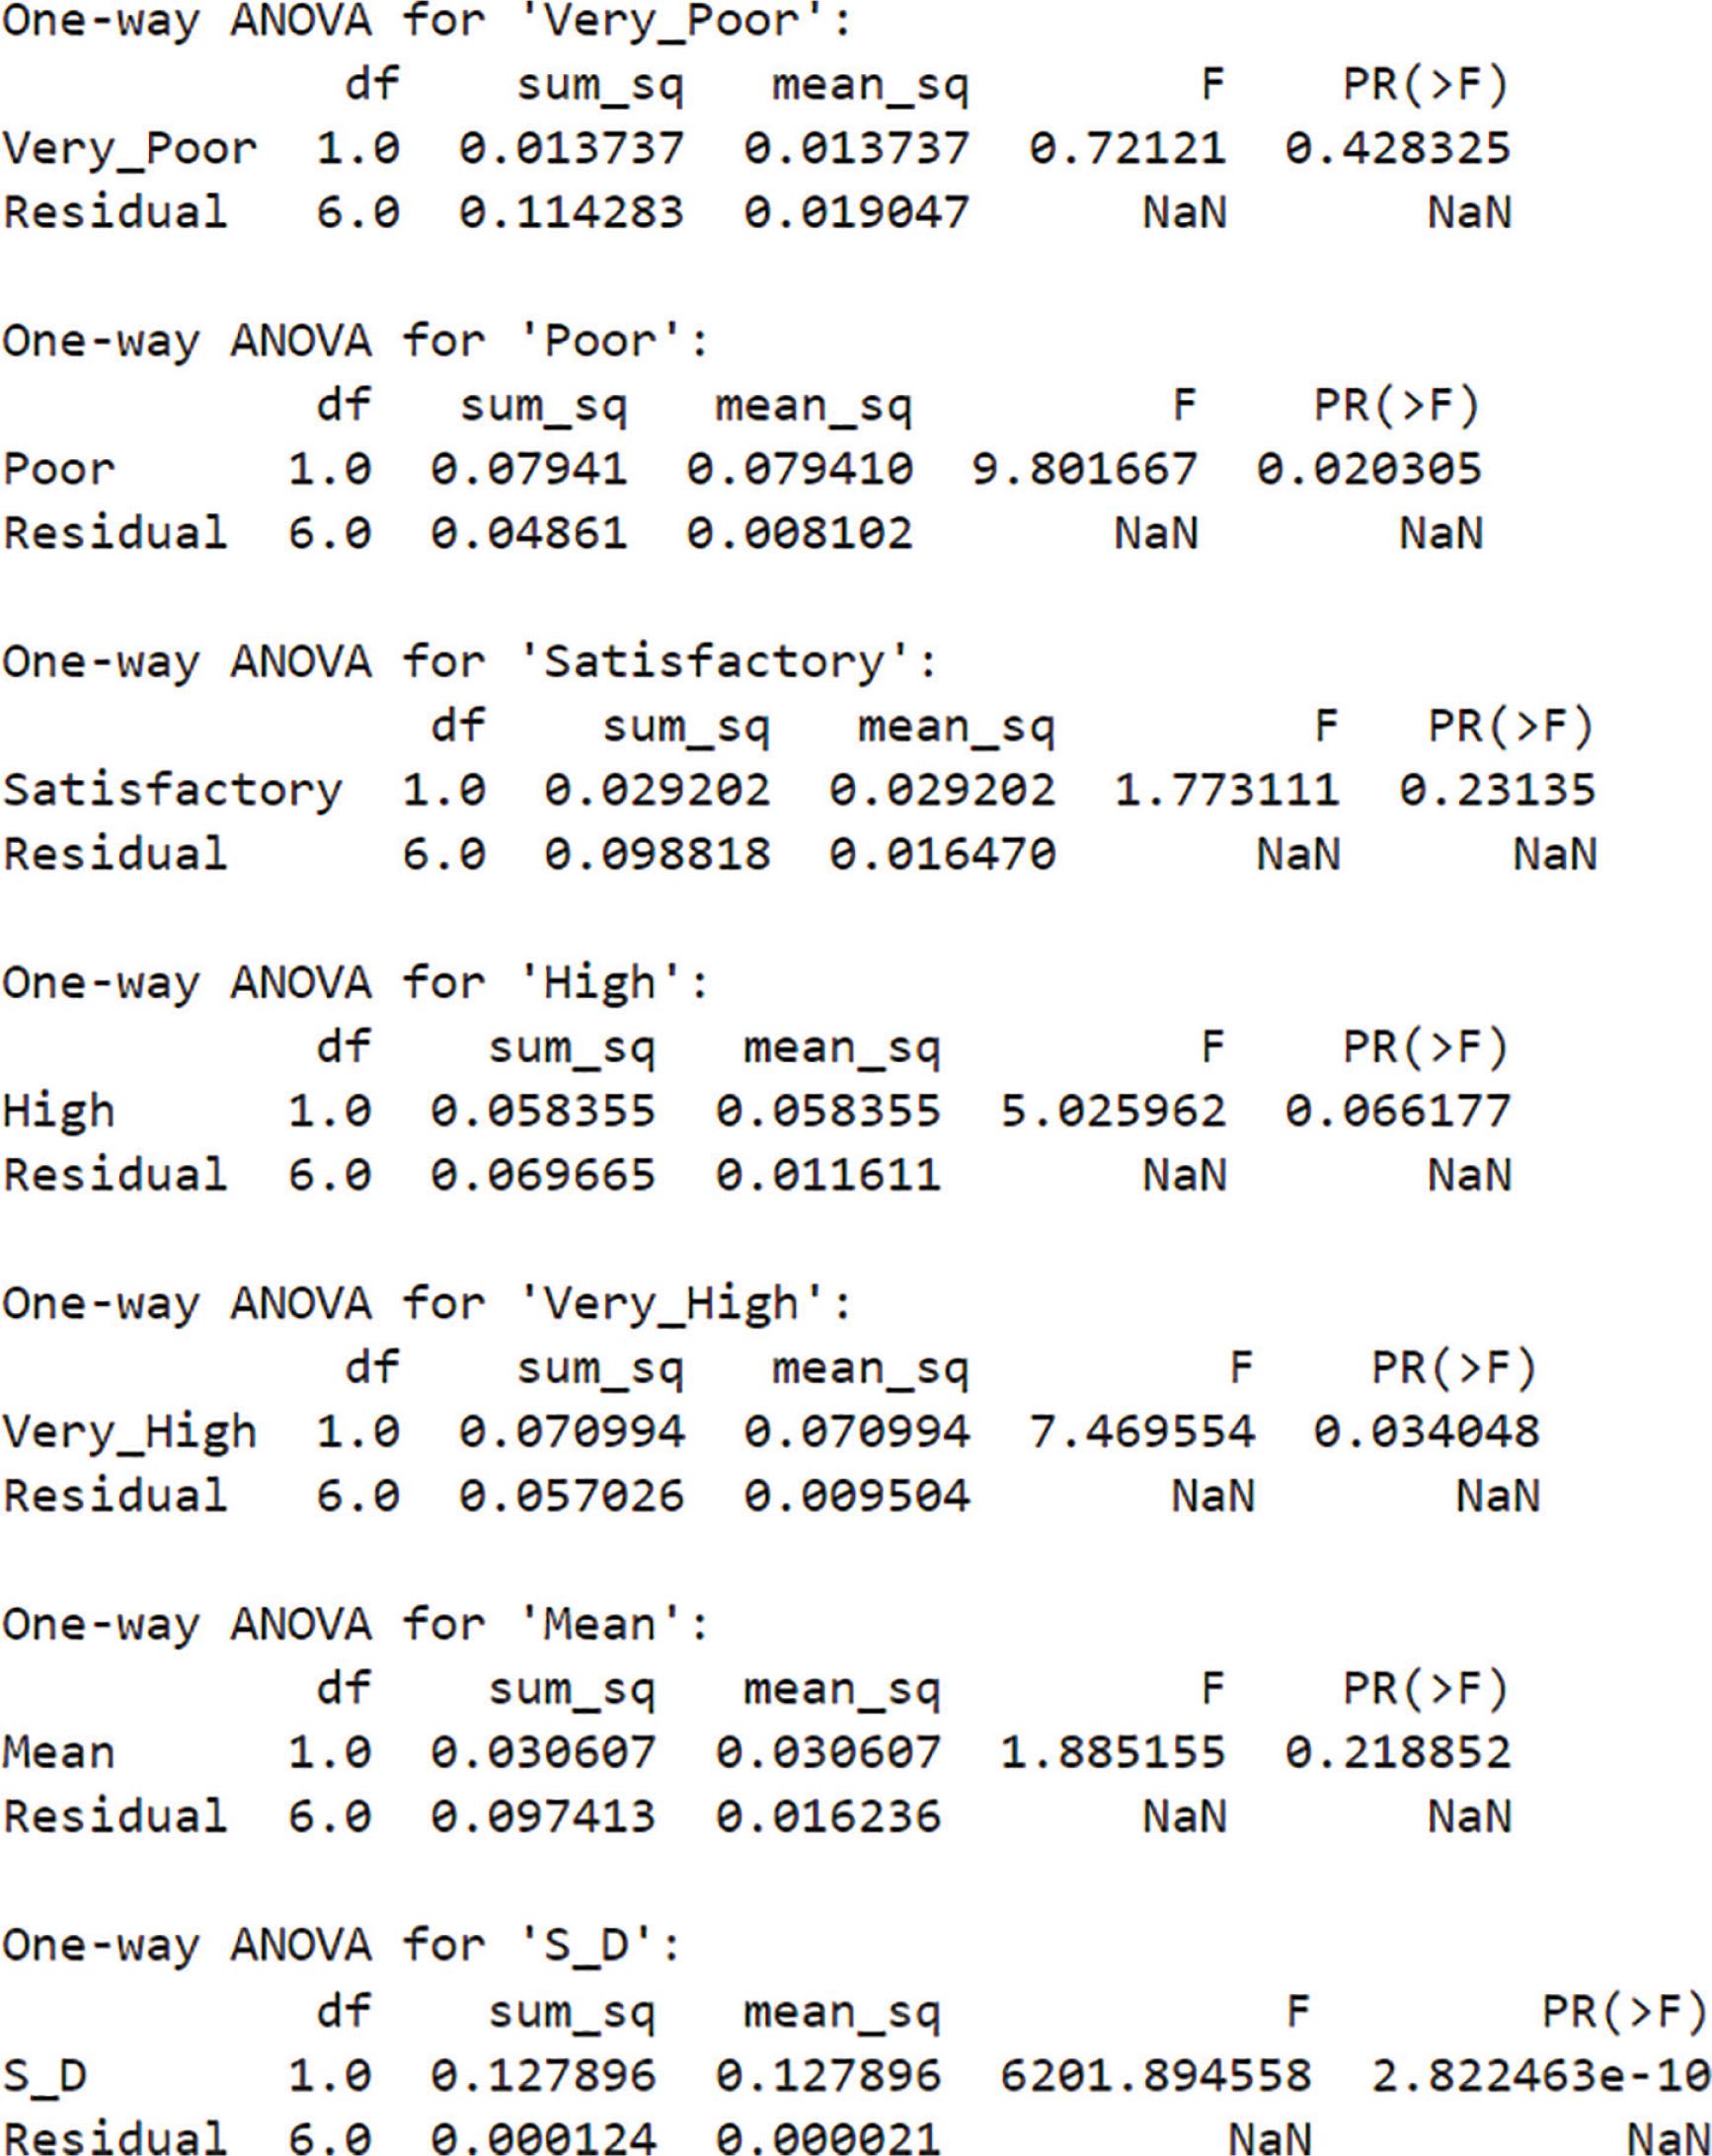
Fig. 4:
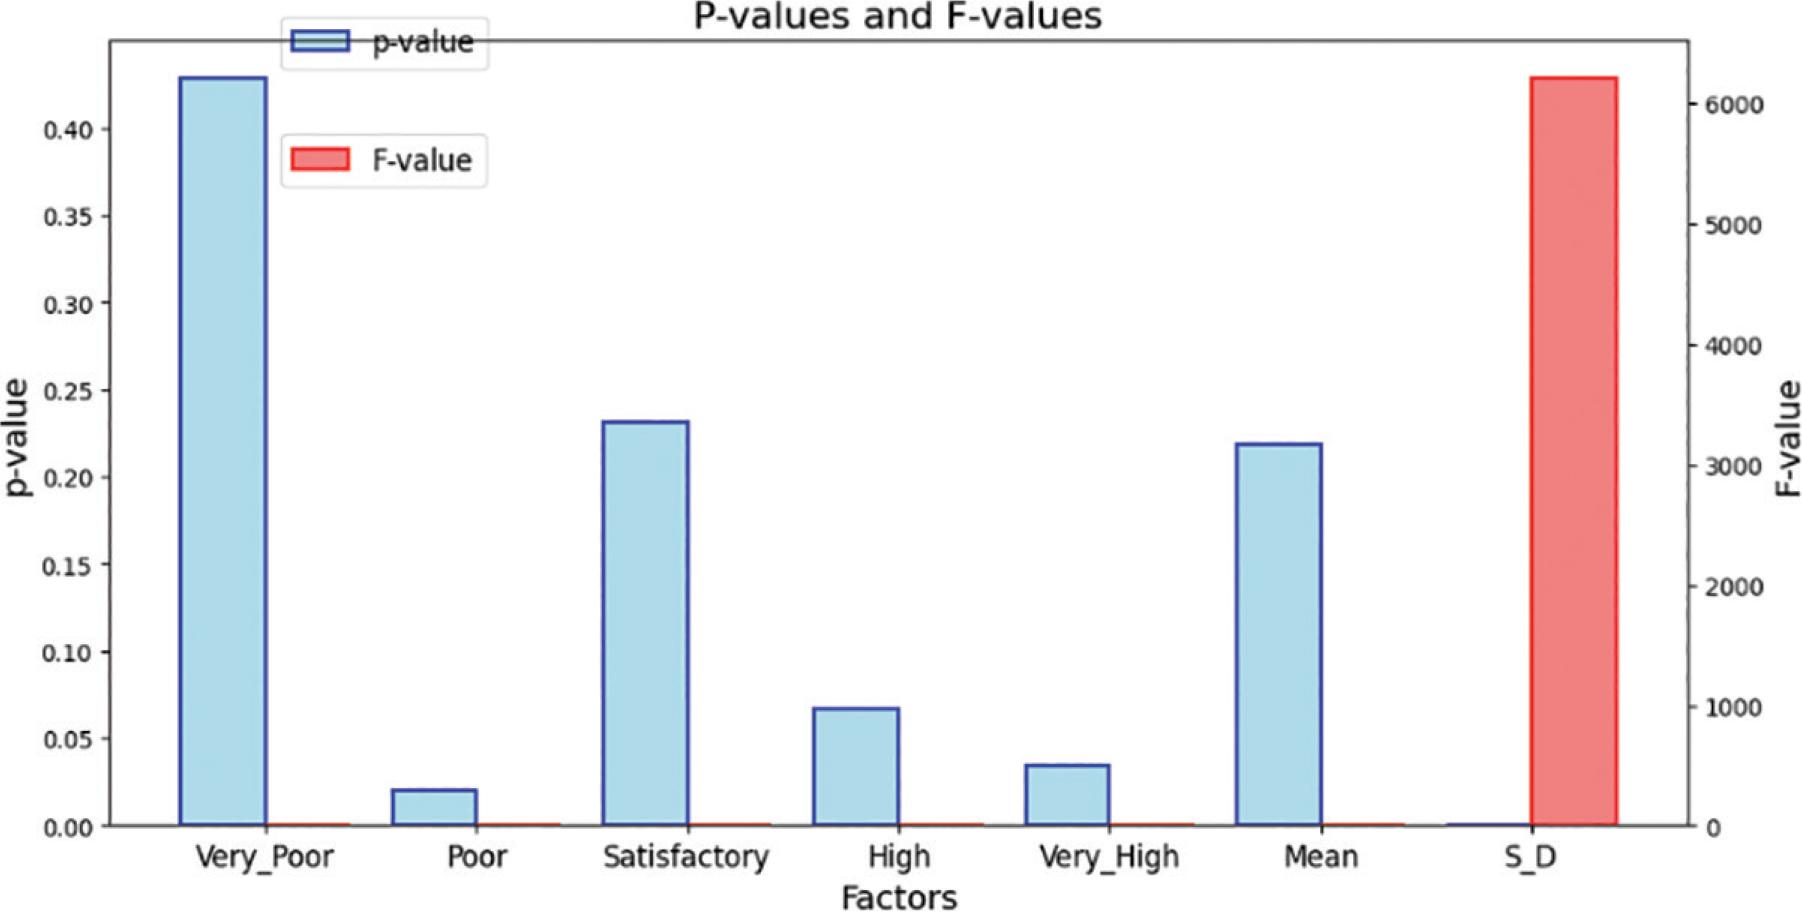
Fig. 5:
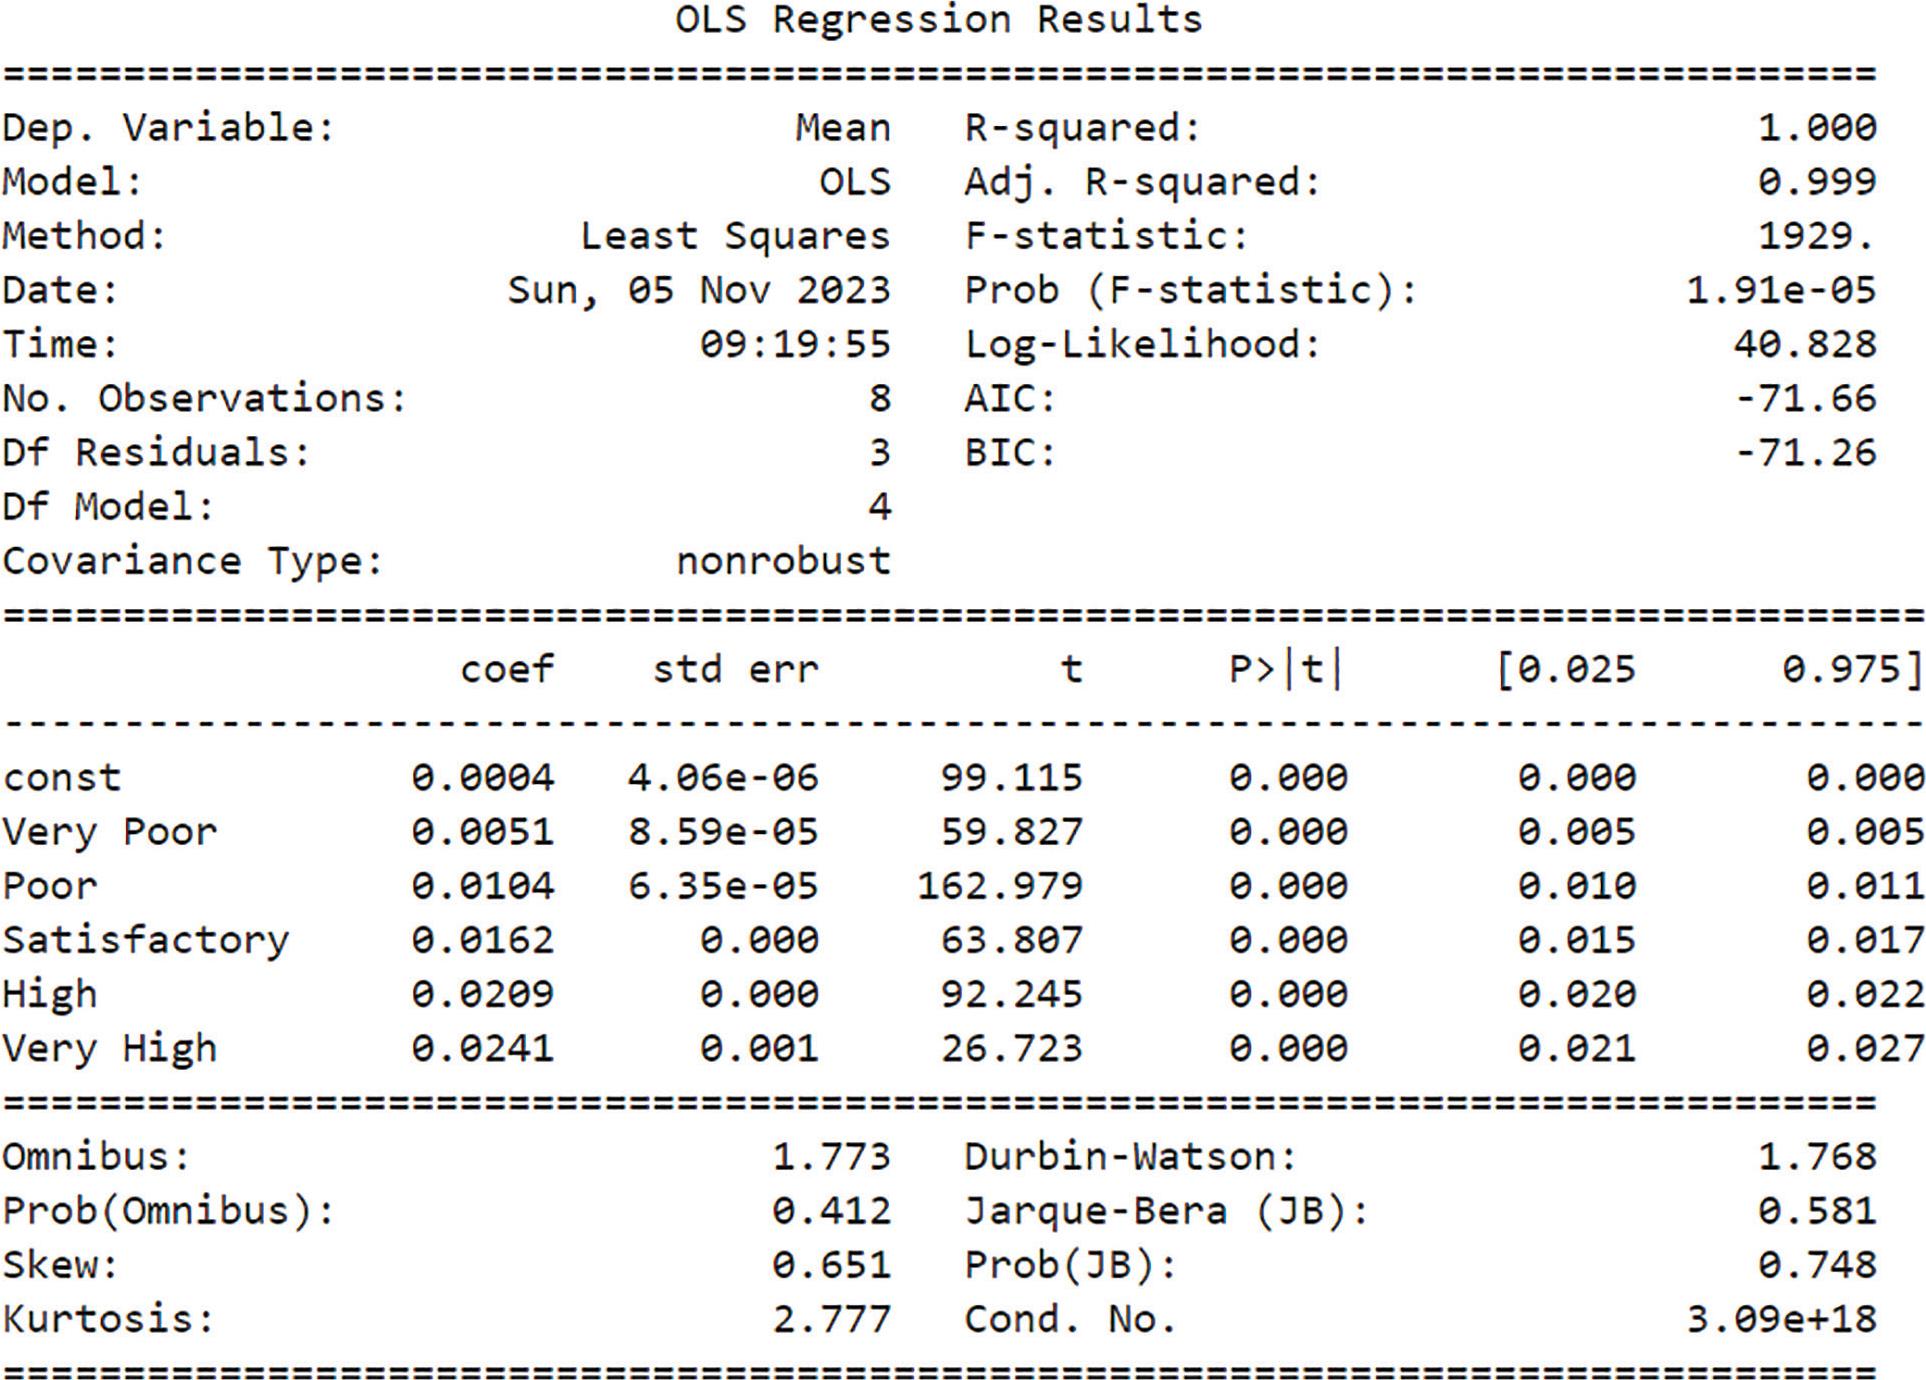
Fig. 6:
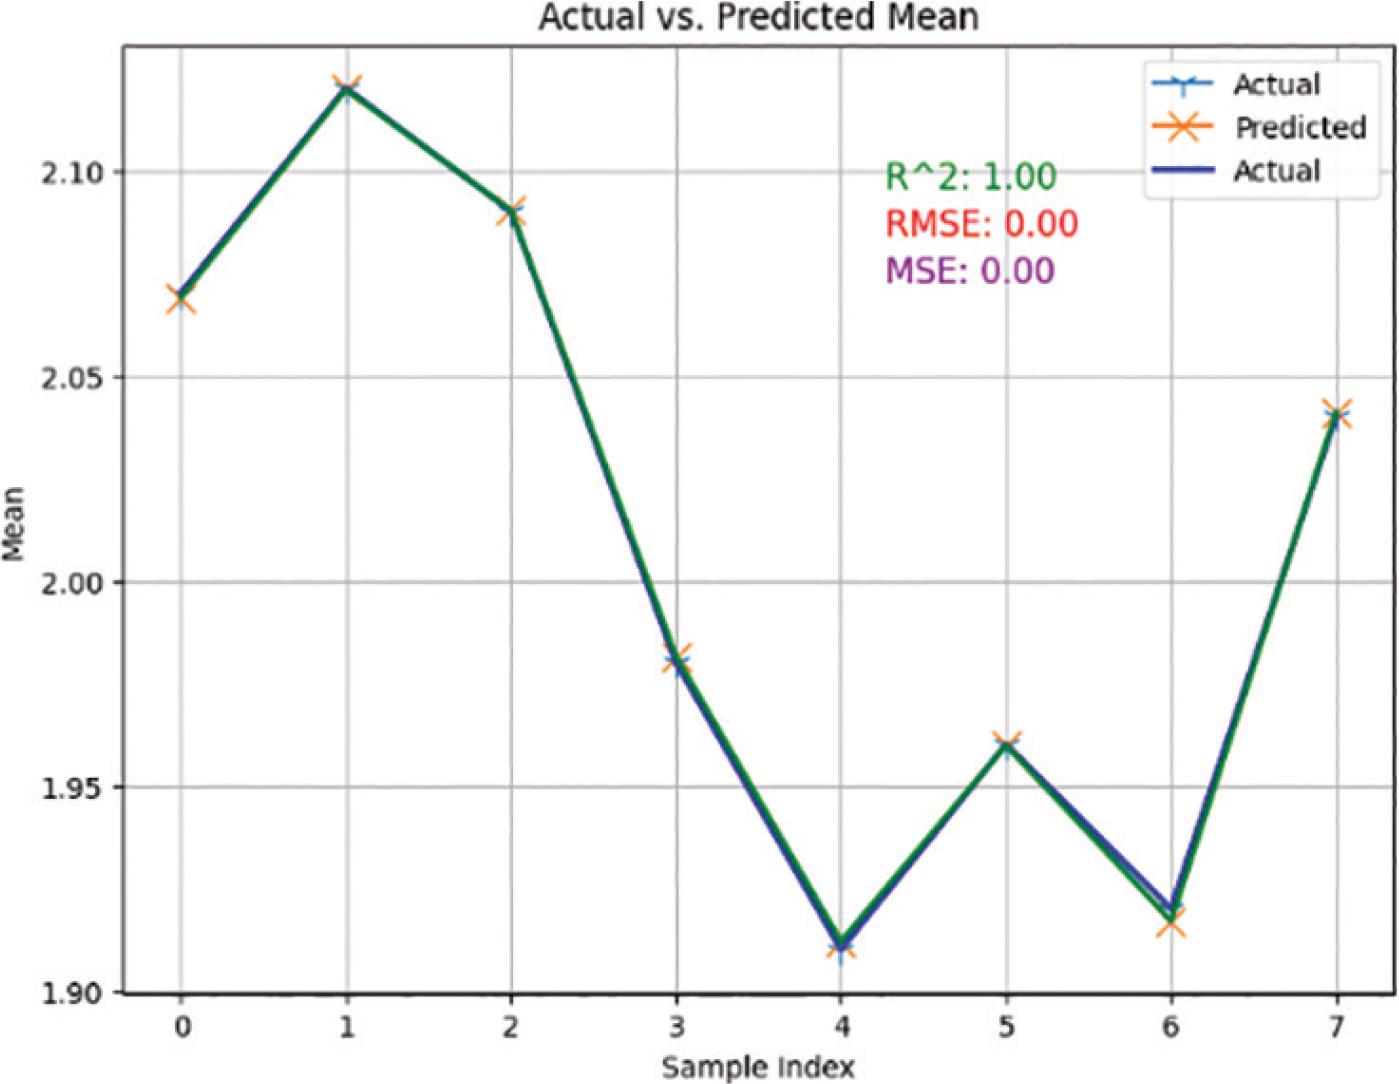
Fig. 7:
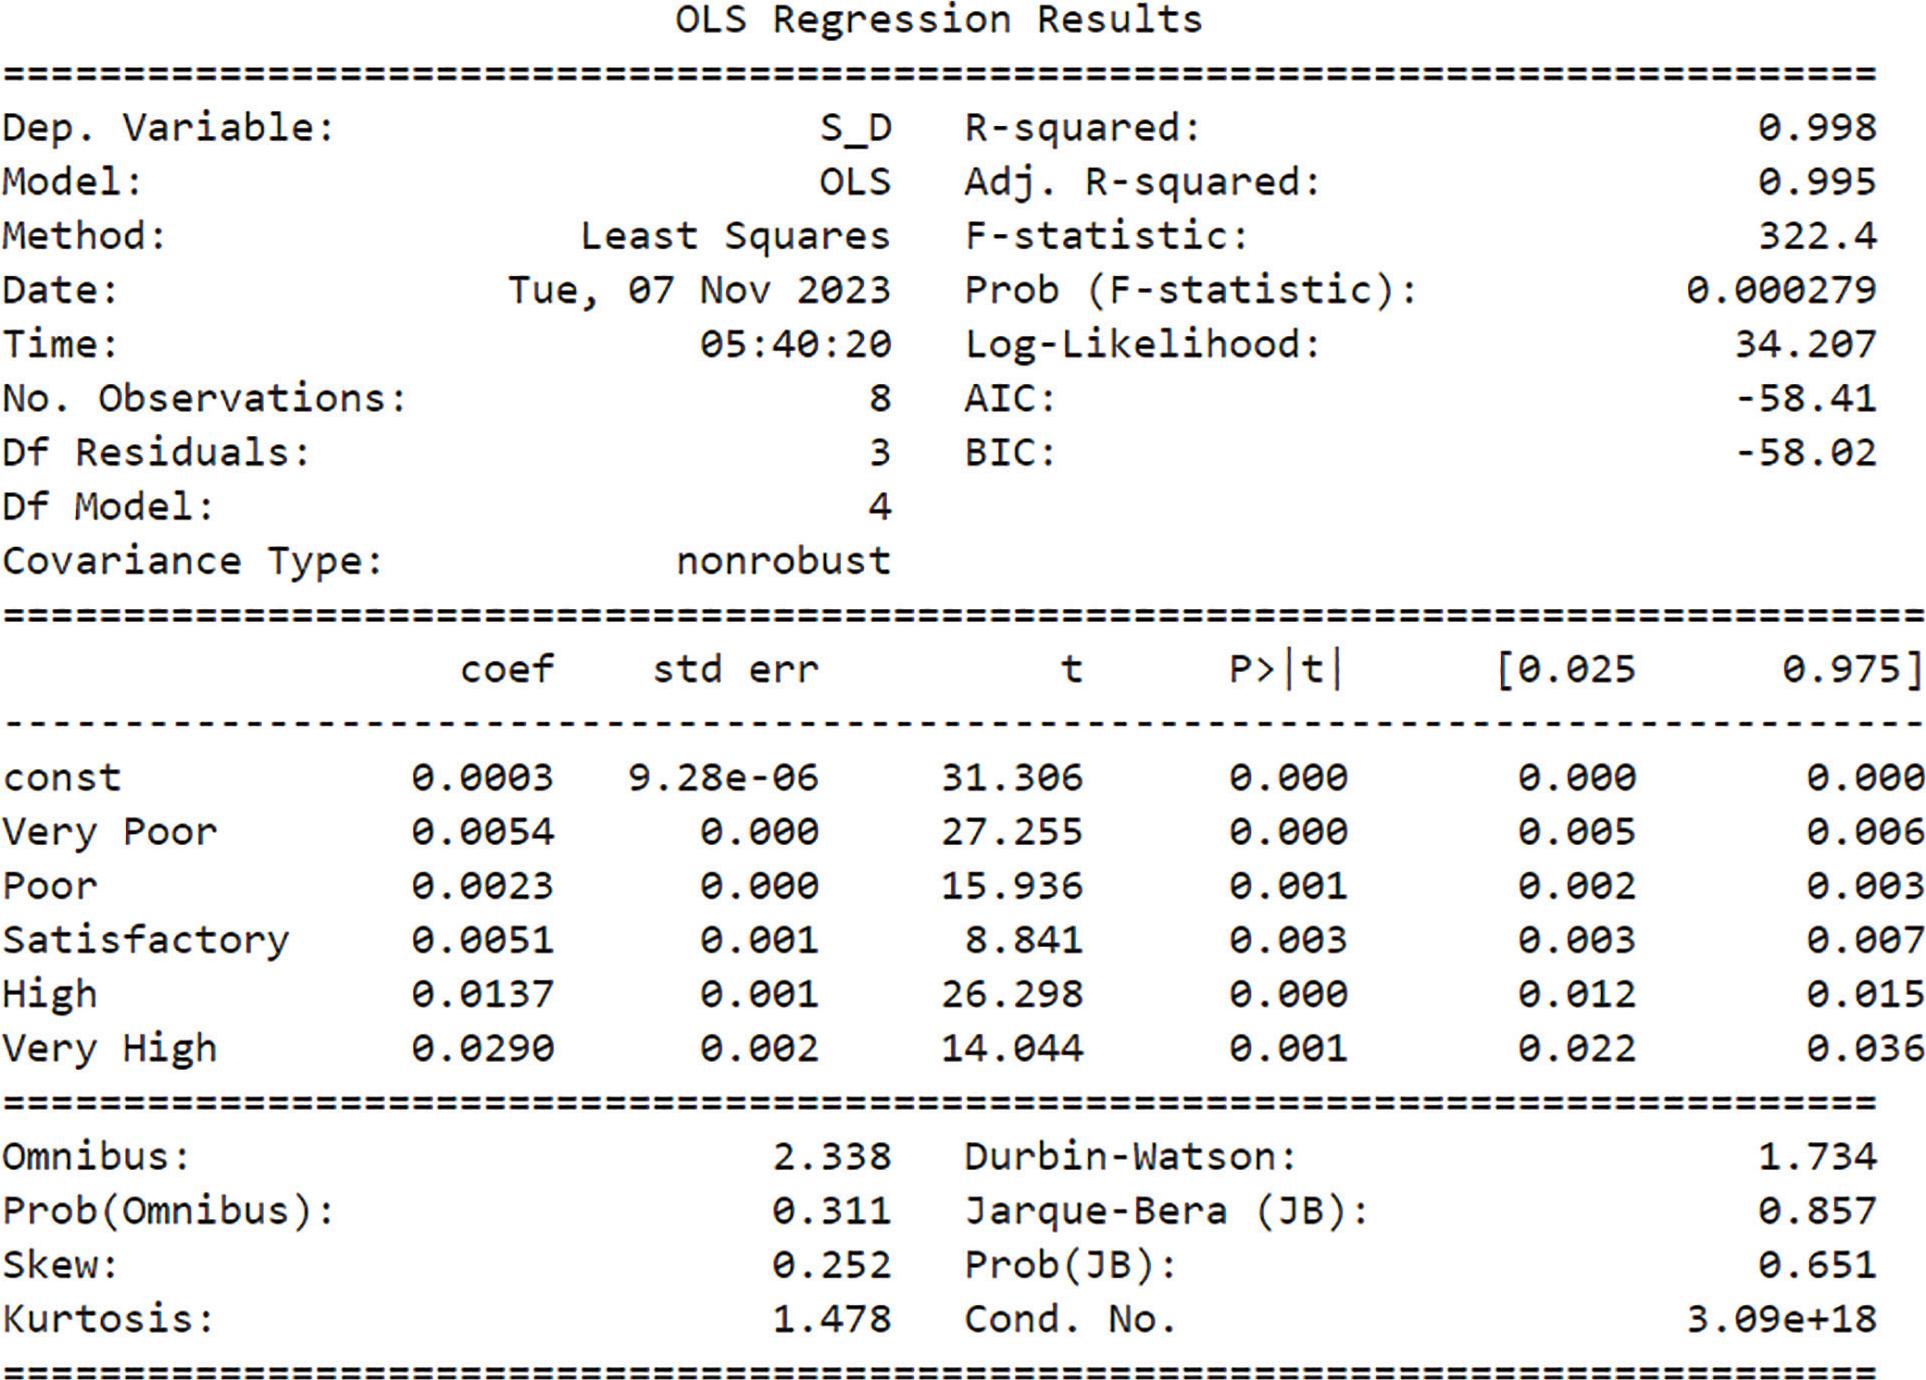
Fig. 8:
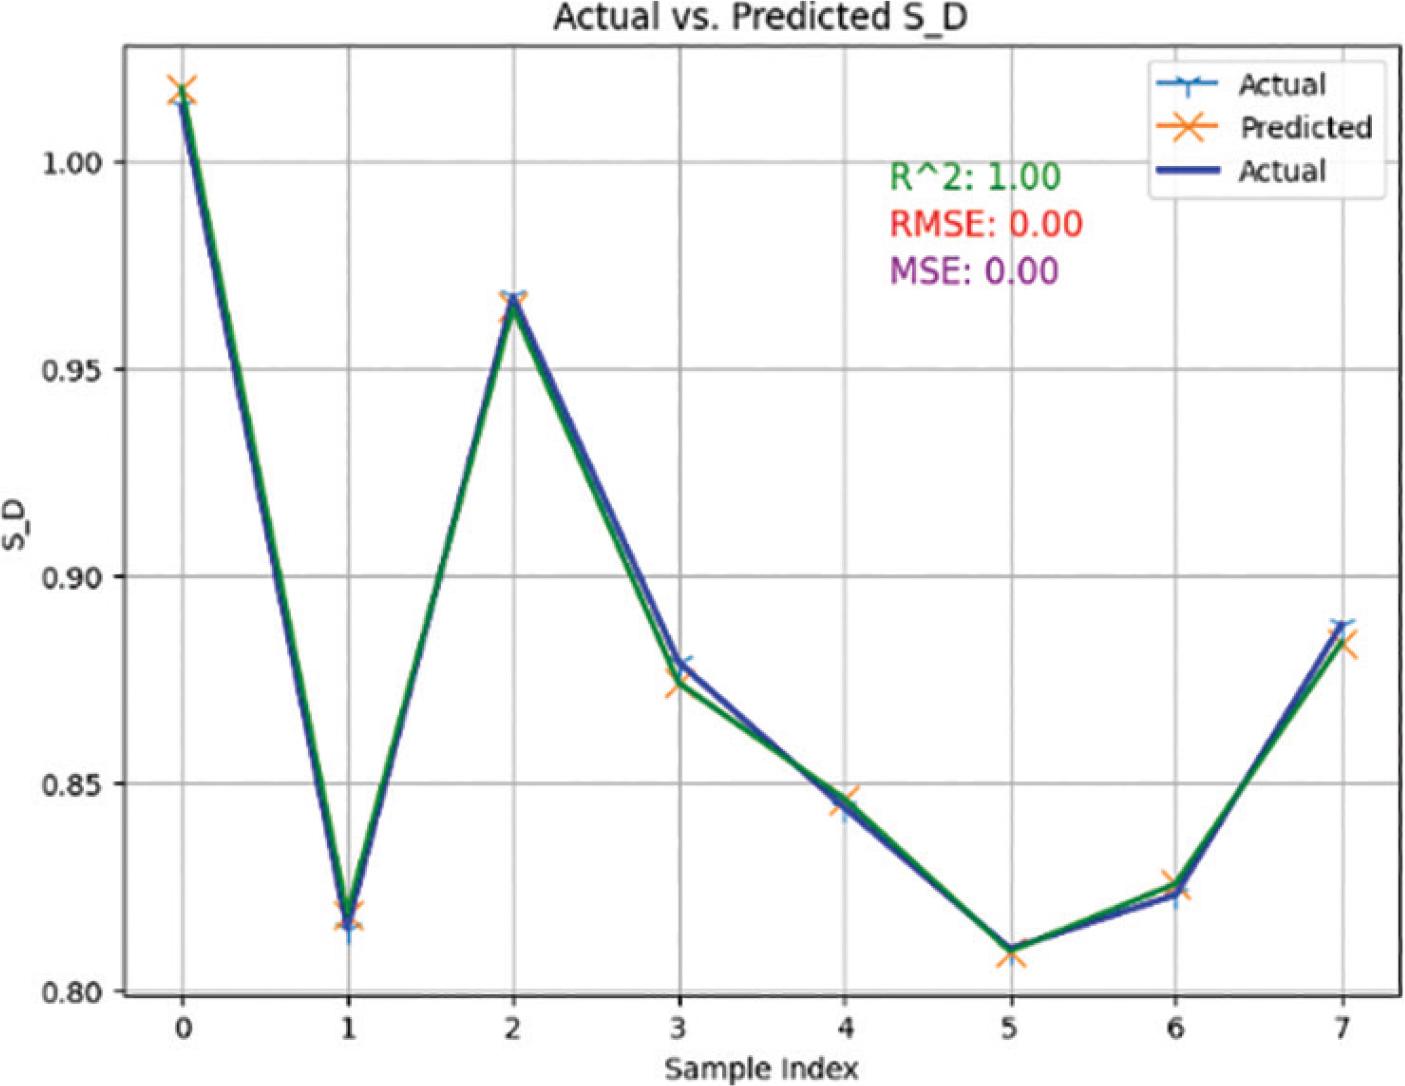
Fig. 9:
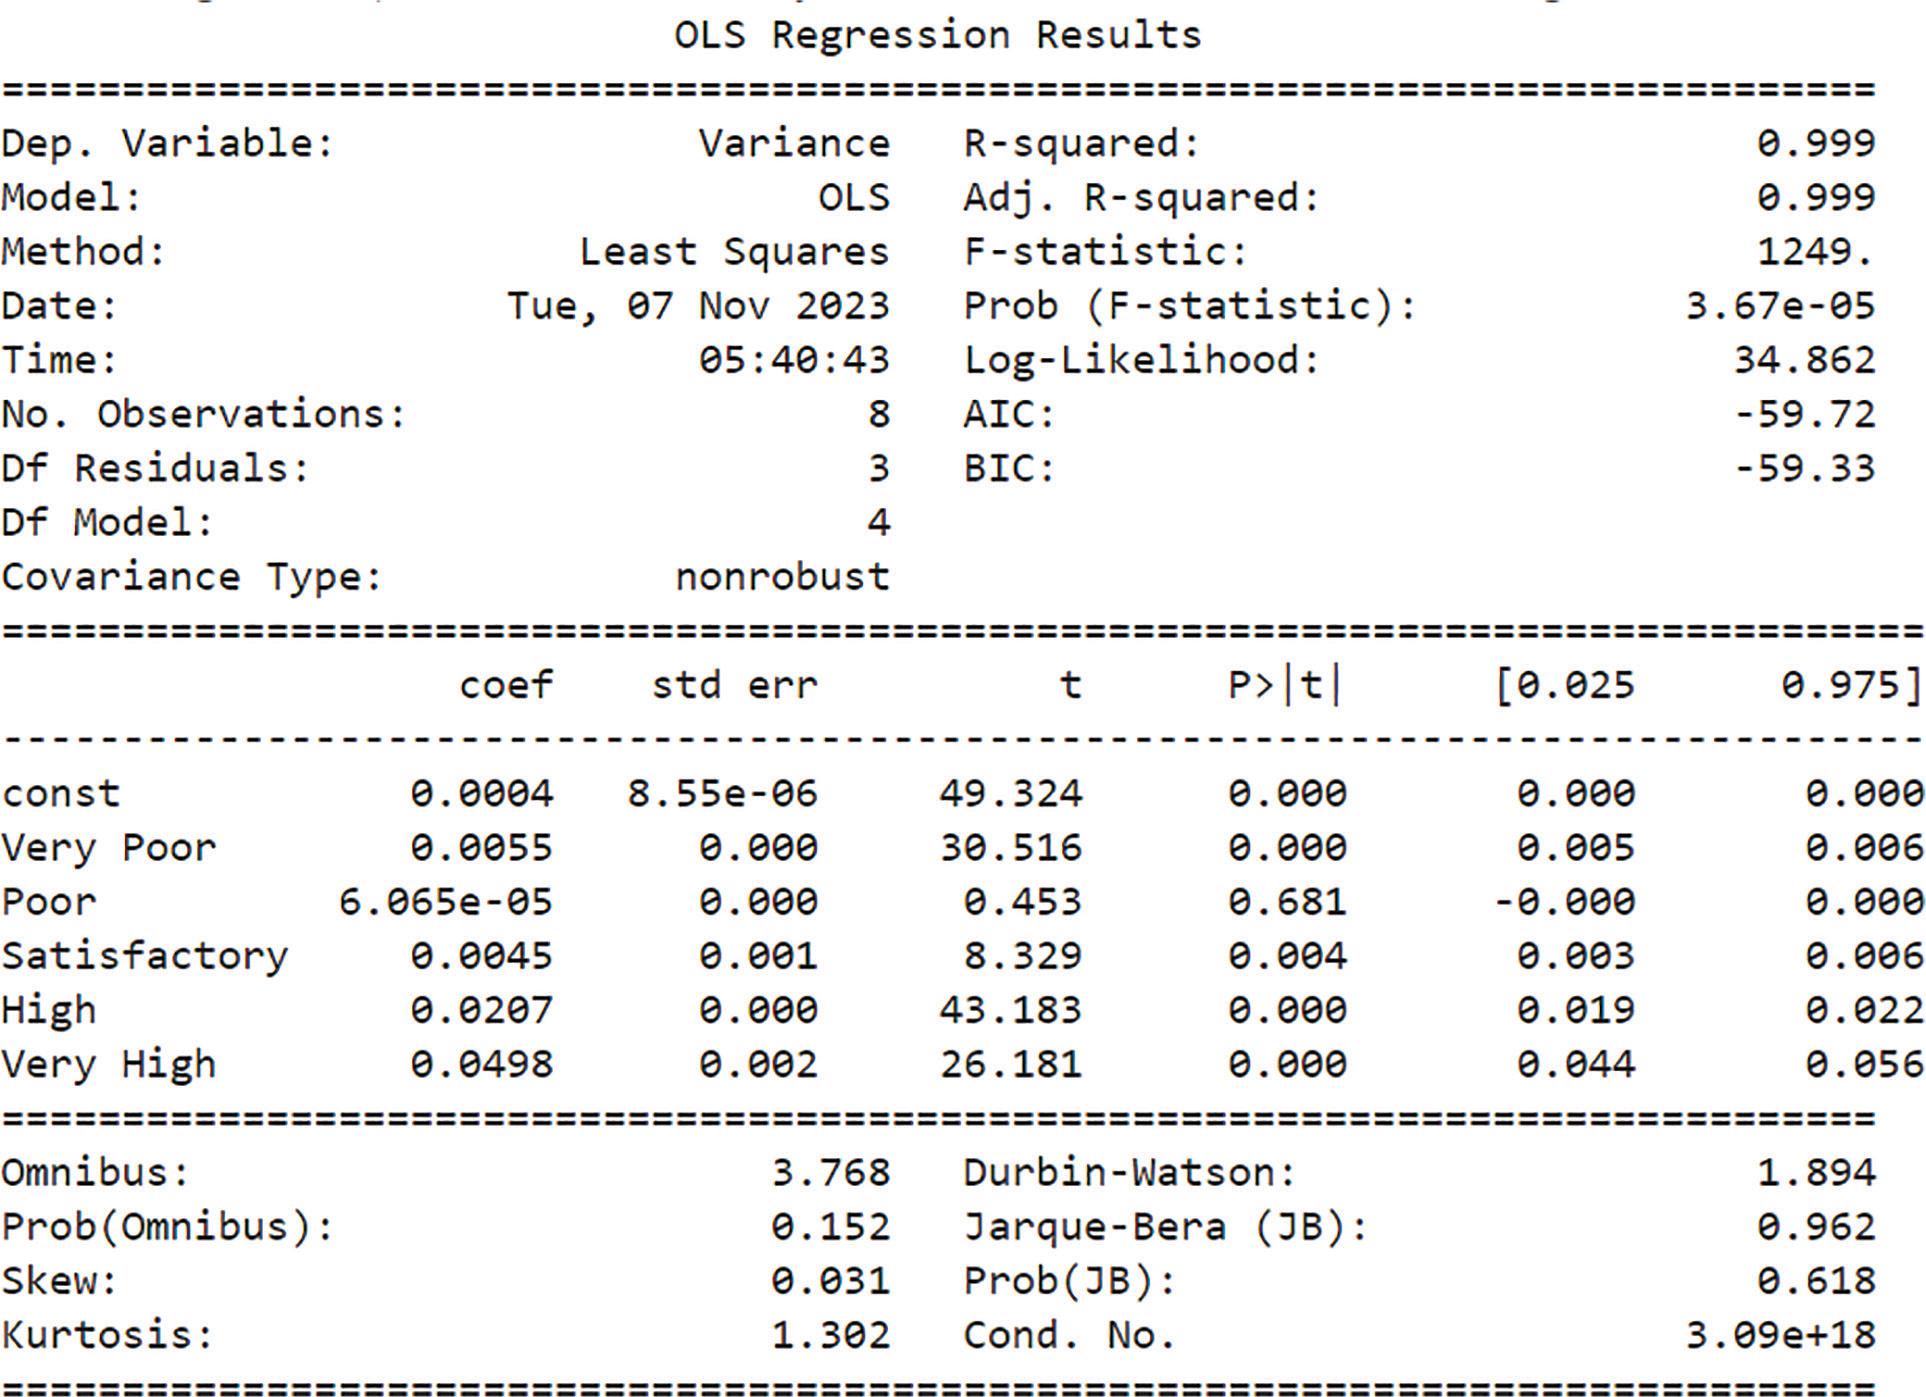
Fig. 10:
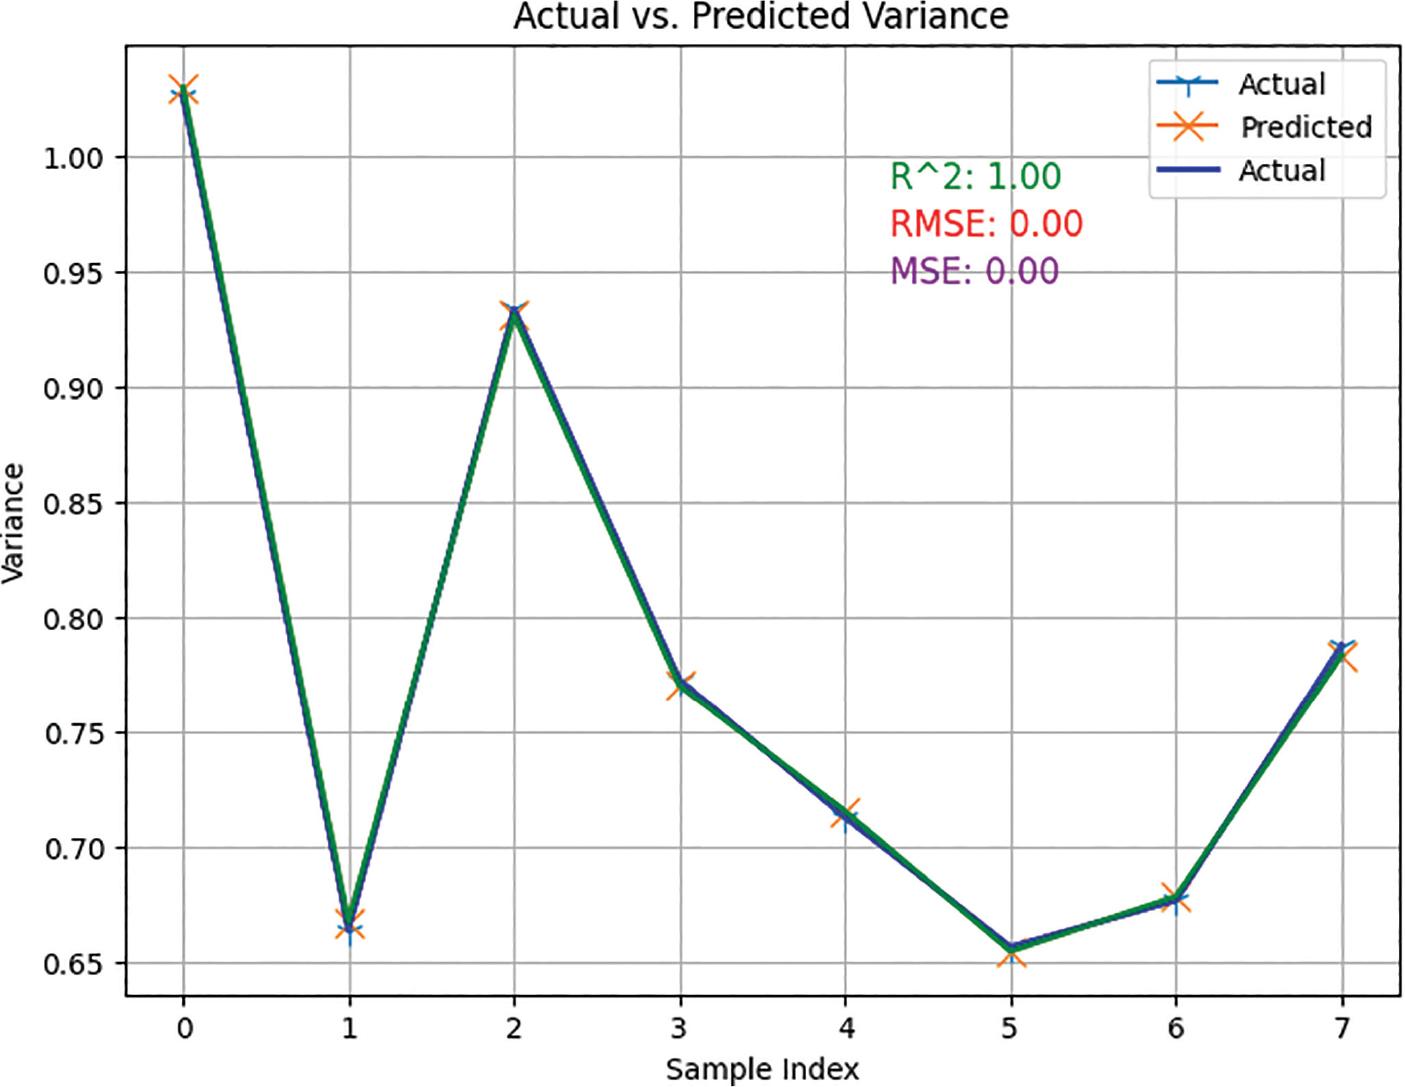
Fig. 11:
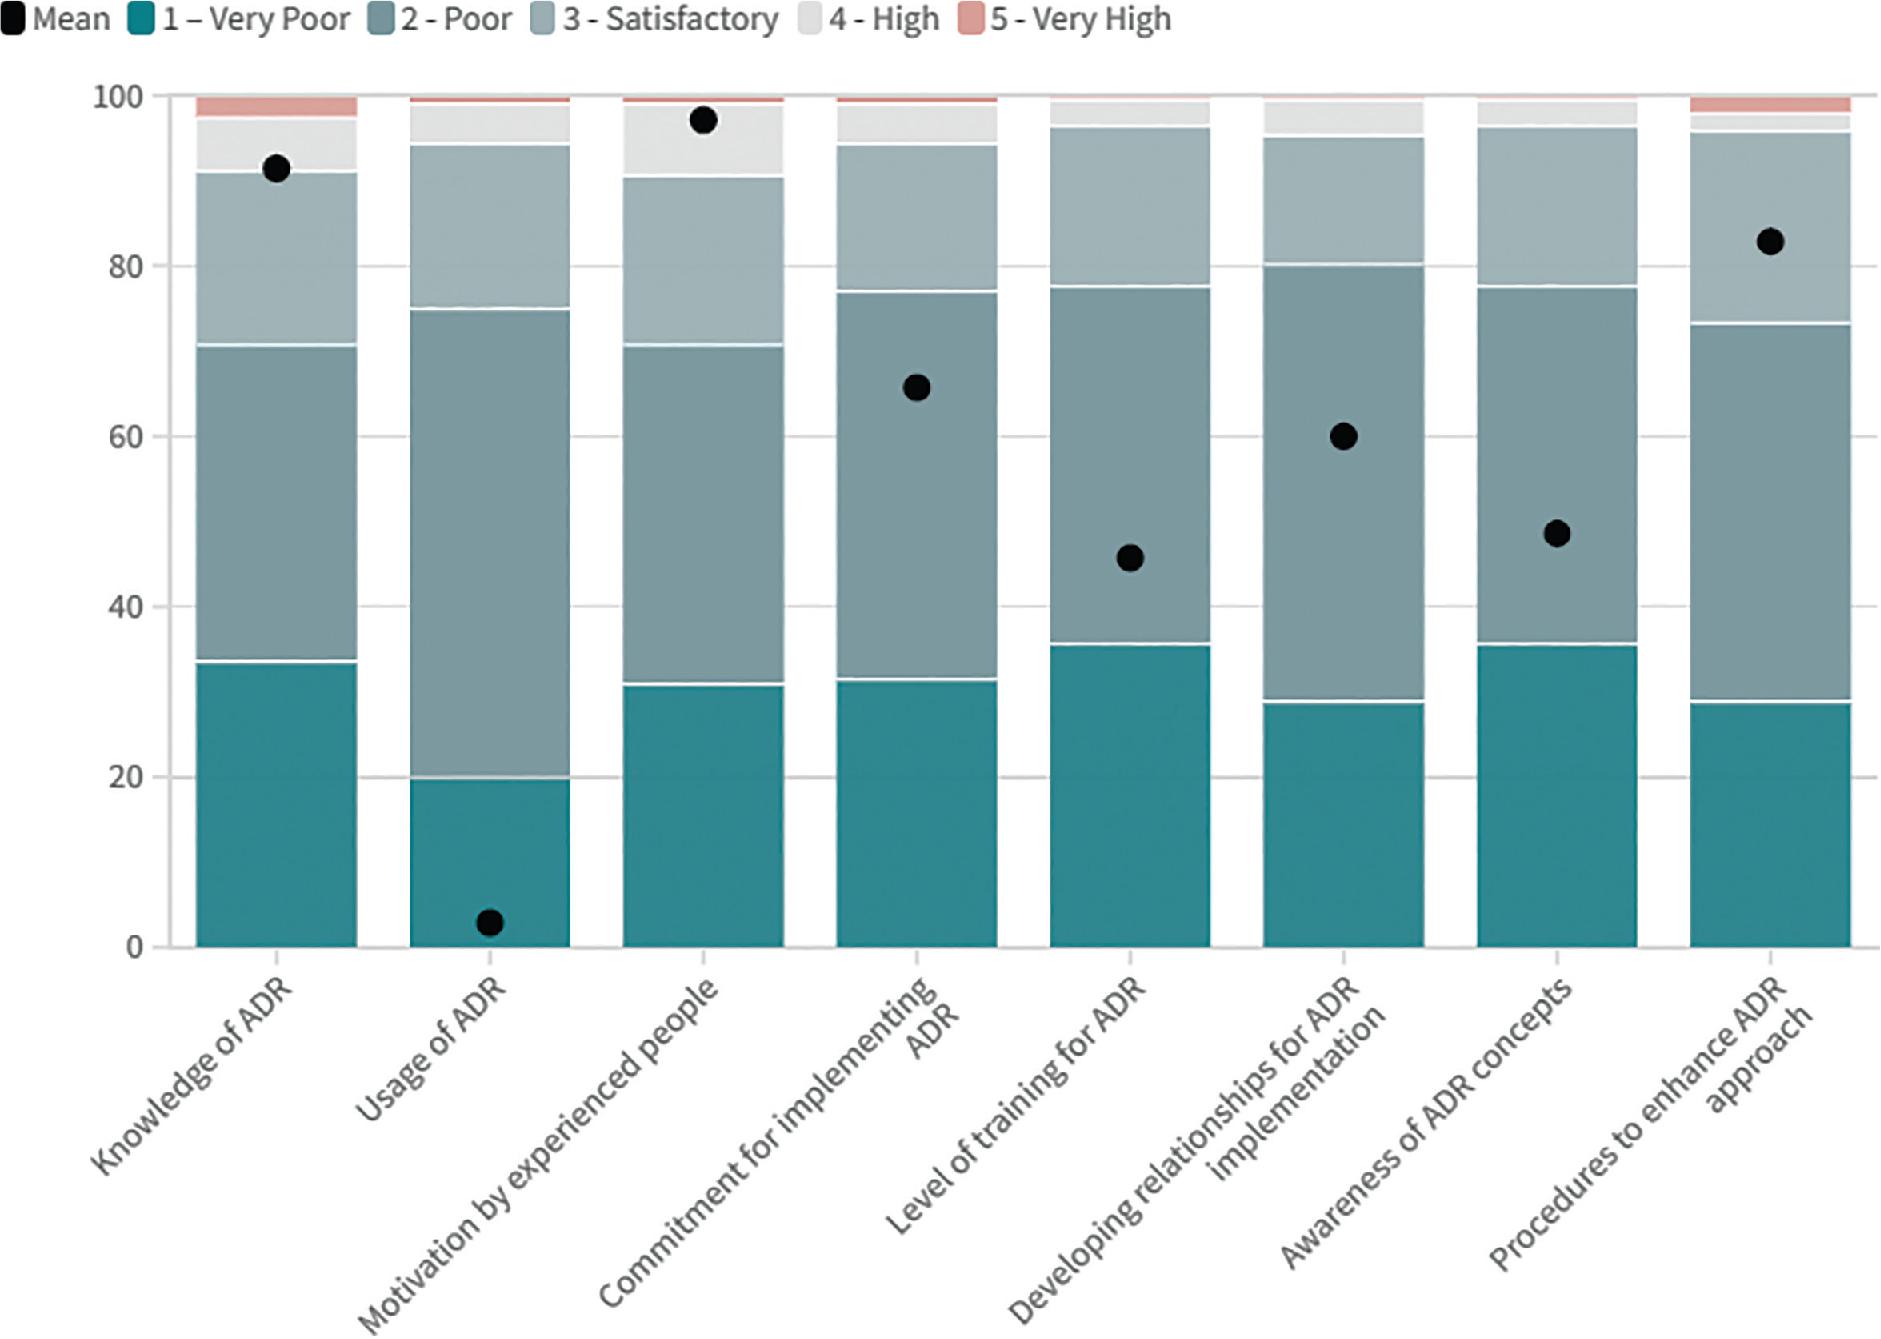
Fig. 12:
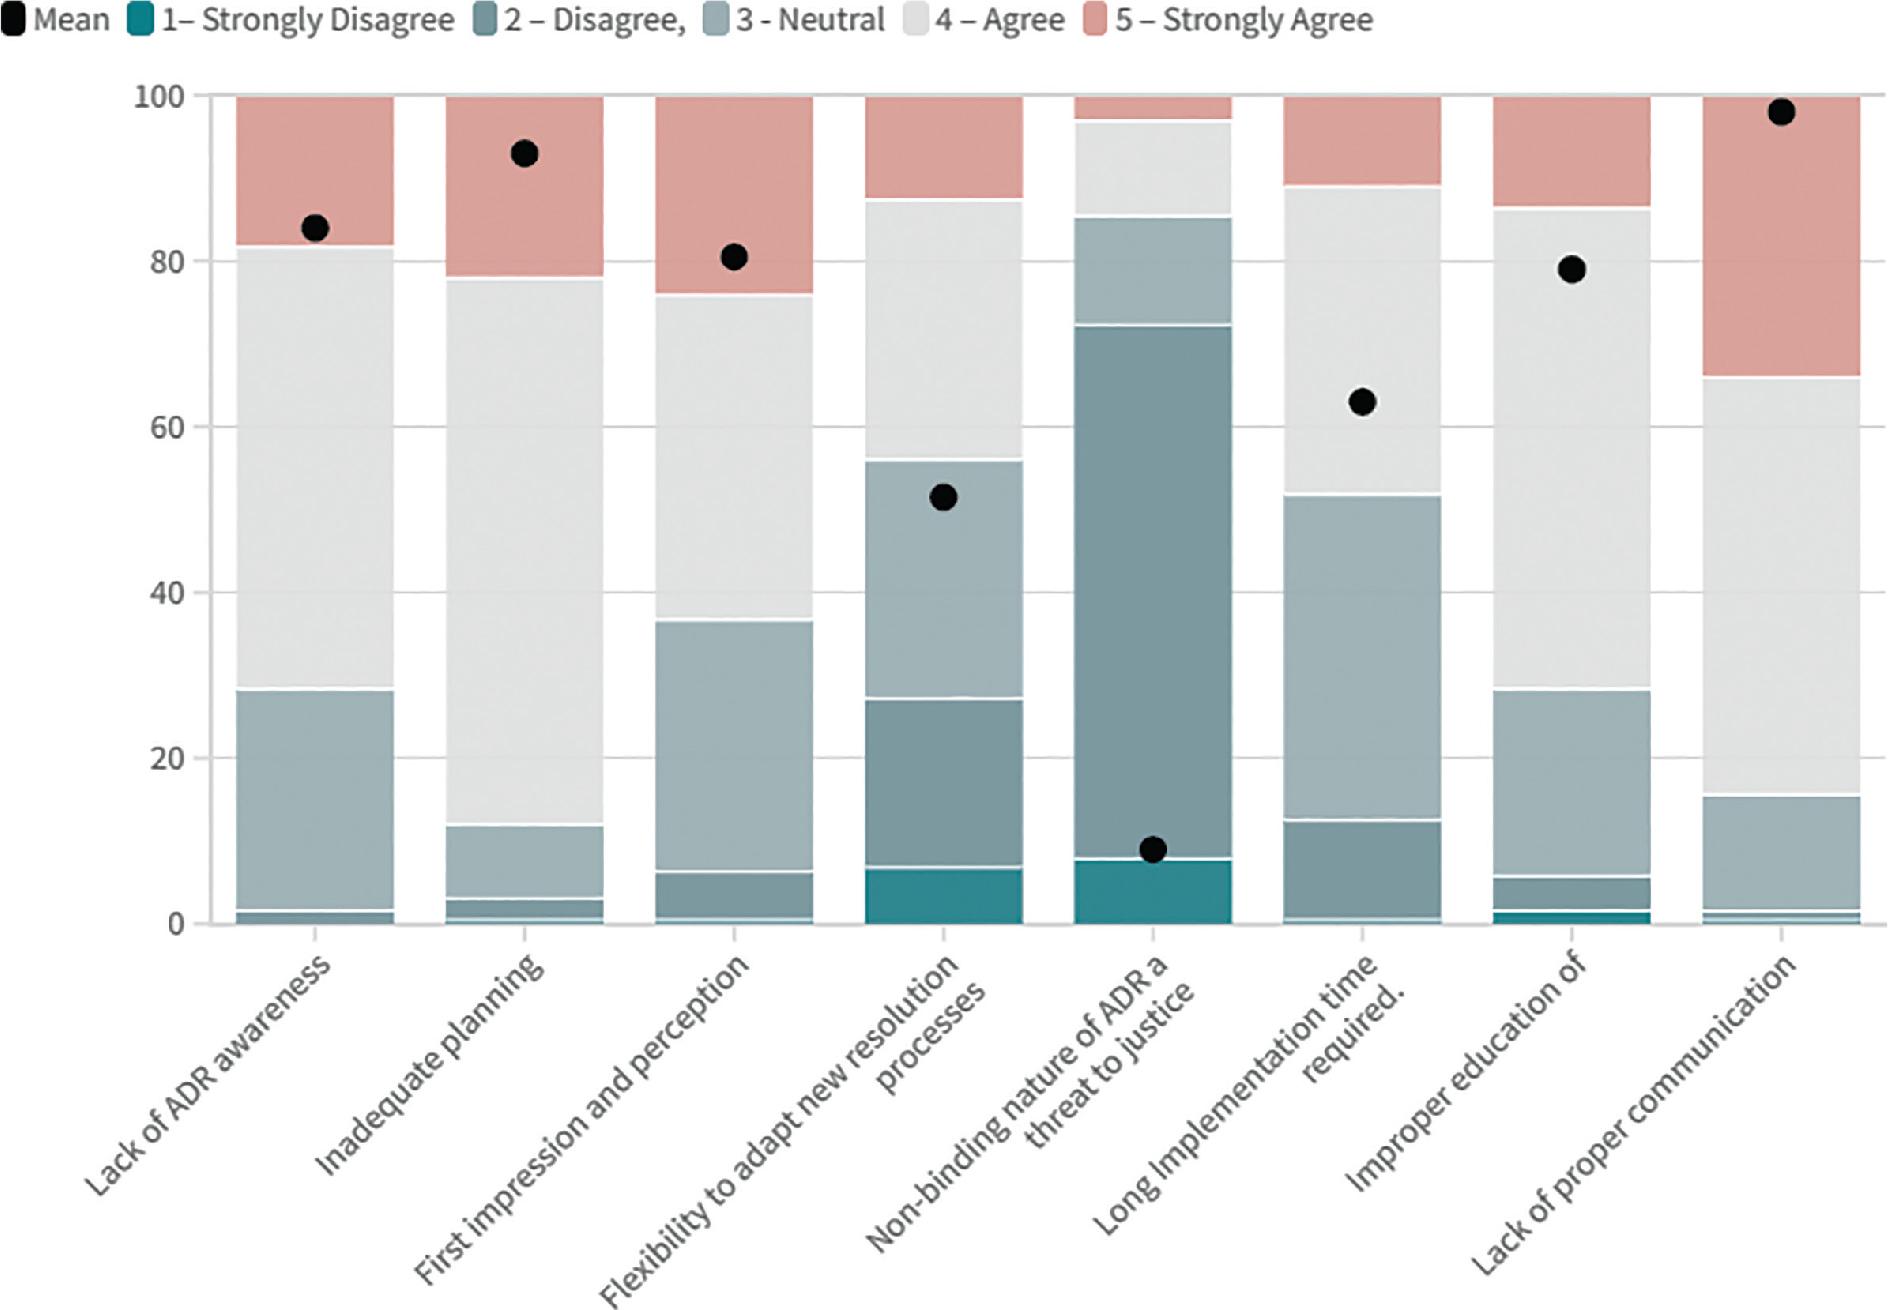
Fig. 13:
Descriptive statistics of variables of knowledge of ADR
| Variables | Role | Knowledge | Usage | Motivation | Commitment | Training | Relationship | Awareness | Procedures |
|---|---|---|---|---|---|---|---|---|---|
| Very poor | Input | 64 | 38 | 59 | 60 | 68 | 55 | 65 | 55 |
| Poor | Input | 71 | 105 | 76 | 87 | 80 | 98 | 84 | 85 |
| Satisfactory | Input | 39 | 37 | 38 | 33 | 36 | 29 | 36 | 43 |
| High | Input | 12 | 9 | 16 | 9 | 6 | 8 | 5 | 4 |
| Very high | Input | 5 | 2 | 2 | 2 | 1 | 1 | 1 | 4 |
| Mean | Output | 2.07 | 2.12 | 2.09 | 1.98 | 1.91 | 1.96 | 1.92 | 2.04 |
| SD | Output | 1.013 | 0.815 | 0.967 | 0.879 | 0.844 | 0.81 | 0.823 | 0.888 |
| Variance | Output | 1.026 | 0.664 | 0.934 | 0.773 | 0.713 | 0.657 | 0.677 | 0.788 |
Respondent’s profile
| Current role | |
|---|---|
| Contractors | 36.6% |
| Lawyer/advocate | 39.3% |
| Civil engineer | 24.1% |
| Work experience (in years) | |
| 1–5 | 34.0% |
| 6–10 | 11.5% |
| 11–15 | 20.4% |
| 16–20 | 19.4% |
| >20 | 14.7% |
| Educational qualification | |
| Bachelor’s degree | 82.7% |
| Master’s degree | 13.1% |
| Diploma | 2.6% |
| Others | 1.0% |
| PhD | 0.5% |
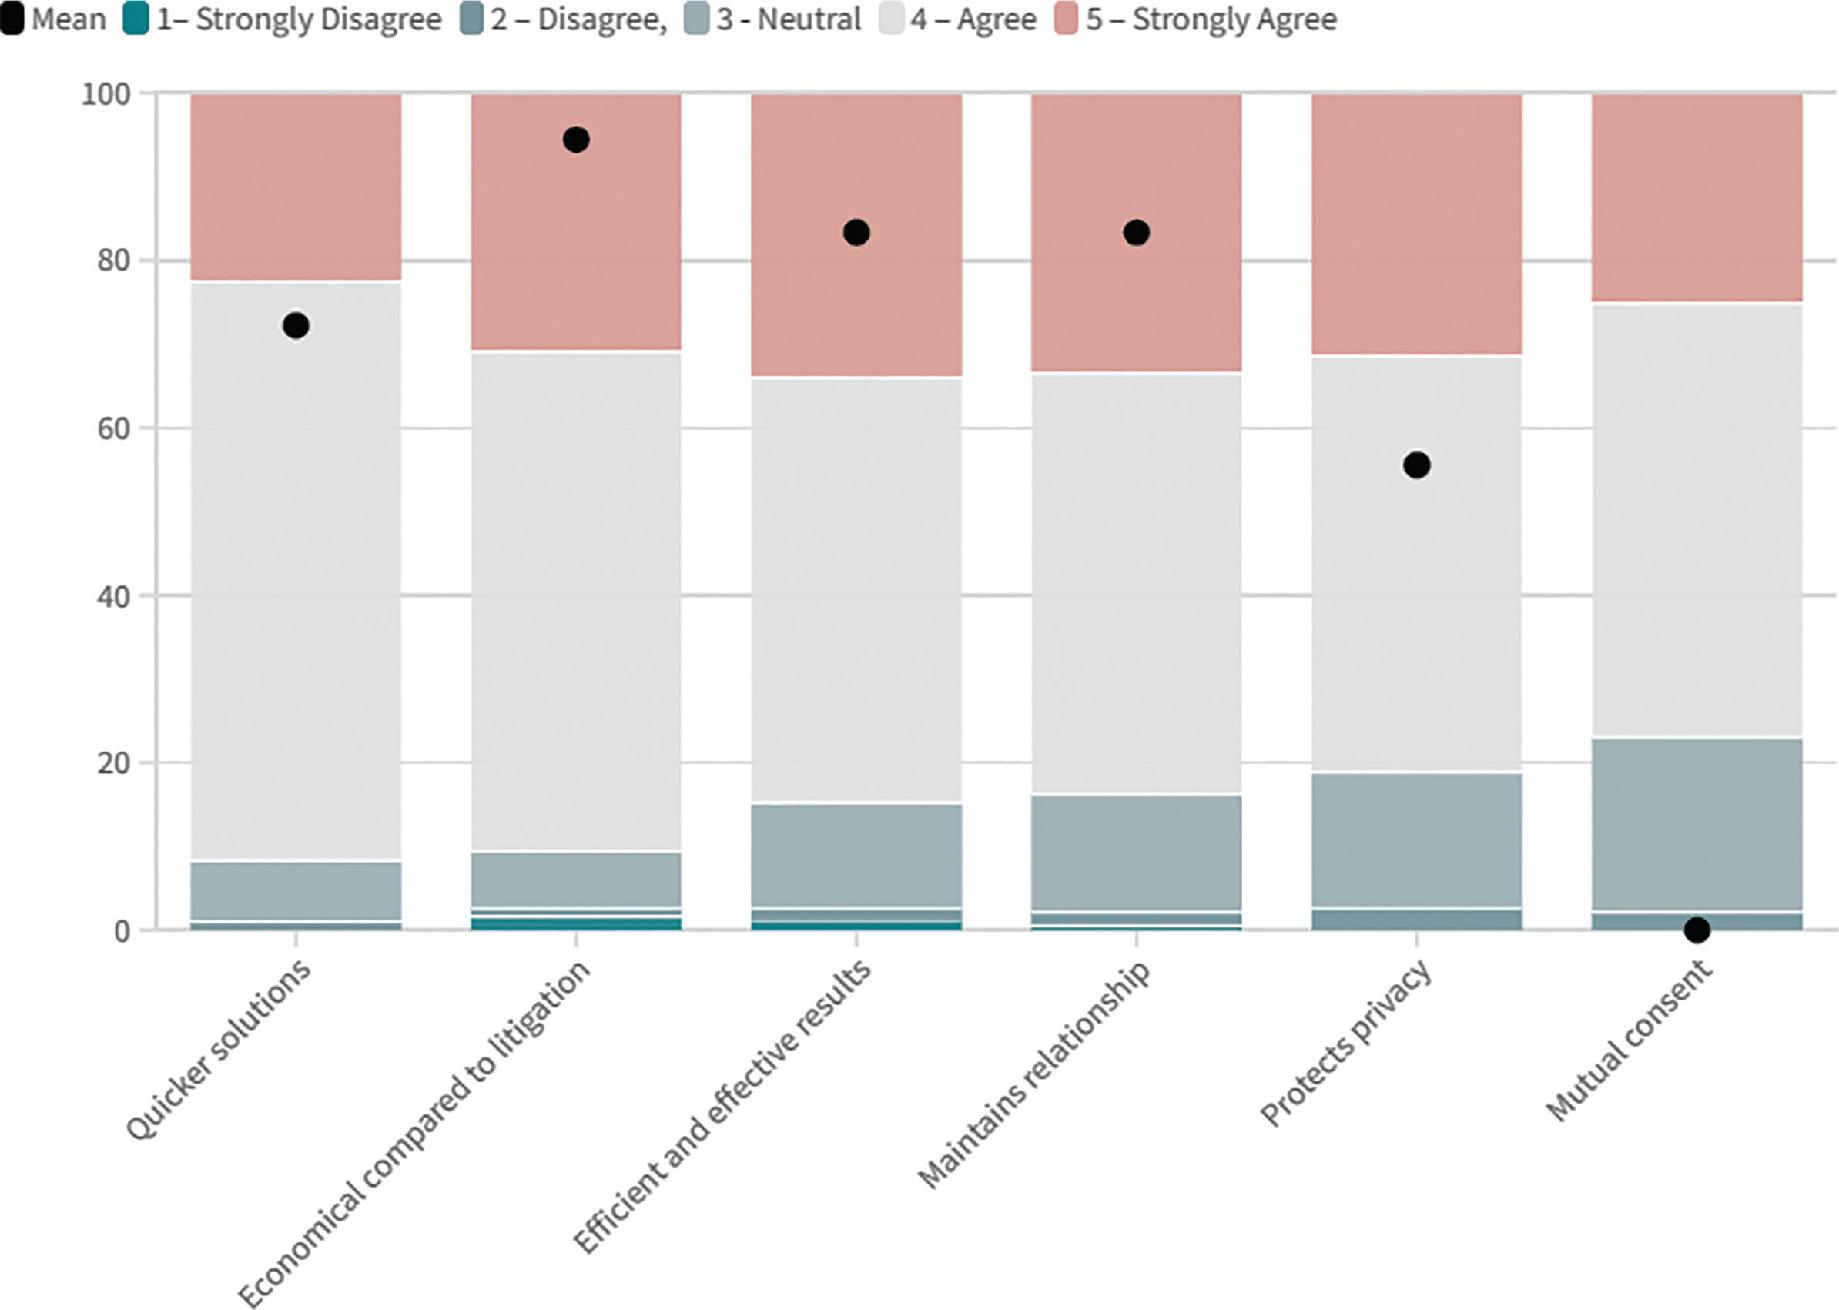
Descriptive statistics of variables of outcomes of ADR
| Variables | Quick | Economical | Efficient | Relationship | Privacy | Consent |
|---|---|---|---|---|---|---|
| Strongly disagree | 0 | 1 | 1 | 13 | 15 | 1 |
| Disagree | 3 | 5 | 11 | 39 | 123 | 23 |
| Neutral | 51 | 17 | 58 | 55 | 25 | 75 |
| Agree | 102 | 126 | 75 | 60 | 22 | 71 |
| Strongly agree | 35 | 42 | 46 | 24 | 6 | 21 |
| Mean | 4.13 | 4.17 | 4.15 | 4.15 | 4.10 | 4.00 |
| SD | 0.570 | 0.730 | 0.777 | 0.754 | 0.758 | 0.740 |
| Variance | 0.325 | 0.533 | 0.603 | 0.568 | 0.574 | 0.547 |
Descriptive statistics of variables of barriers of ADR
| Variables | Awareness | Planning | Perception | Flexibility | Non-binding | Implementation | Education | Communication |
|---|---|---|---|---|---|---|---|---|
| Strongly disagree | 0 | 1 | 1 | 13 | 15 | 1 | 3 | 1 |
| Disagree | 3 | 5 | 11 | 39 | 123 | 23 | 8 | 2 |
| Neutral | 51 | 17 | 58 | 55 | 25 | 75 | 43 | 27 |
| Agree | 102 | 126 | 75 | 60 | 22 | 71 | 111 | 96 |
| Strongly agree | 35 | 42 | 46 | 24 | 6 | 21 | 26 | 65 |
| Mean | 3.88 | 4.06 | 3.81 | 3.23 | 2.38 | 3.46 | 3.78 | 4.16 |
| SD | 0.709 | 0.678 | 0.888 | 1.118 | 0.903 | 0.863 | 0.791 | 0.740 |
| Variance | 0.502 | 0.459 | 0.789 | 1.249 | 0.815 | 0.745 | 0.625 | 0.570 |