
The construction industry faces complexity due to profit-driven participants, leading to envy instead of collaboration. This mindset fosters risks and disputes, hindering project completion (Cakmak and Cakmak 2014; Getahun 2017; Tayeh et al. 2022). Most often times, it is misunderstood that conflicts and disputes are the same. To be able to resolve the problem, the difference between conflicts and disputes needs to be clearly understood. According to a dominant interactionism theory, conflicts can be a constructive factor in organisational development in certain circumstances (Fenn et al. 1997). But this cannot be taken as a standard theory as it can be attributed to ideological conflicts arising during some brainstorming sessions, etc.; whereas, the conflict in the construction industry is often an unpleasant term that is generally attributed to disputes (Chaphalkar and Patil 2012; Najafzadeh et al. 2024). Conflicts can occur due to the difference of opinions or when there is rigidity in standpoints. They could be controlled or managed till the point of preventing a dispute. However, disputes are transformed from conflicts, which are majorly responsible for project delays (Harmon 2003a, 2003b; Menkel-Meadow 2015a). Claims are bound to happen in any project, and effective control and management of these claims will serve as a corner stone in dispute settlement procedures. Claims of any form, category and scale are metamorphosed into disputes, and when the claim management is effective, dispute arousal is unattainable (Mohamed et al. 2014).
Disputes in the construction industry are not a new phenomenon, and everyone is aware of it. For example, unclear documentation can lead to payment disputes. Delays in getting required approvals or permits from authorities can cause hindrances, thus affecting the project deadlines, incurring losses (Hemanth Sai Kalyan et al. 2024). The necessary steps that should be taken to avoid the occurrence of disputes are not given importance (Chou et al. 2016; Hemanth Sai Kalyan et al. 2022). The complexity of construction projects in today’s world has forced dispute resolution into being one of the duties of a project manager. It is imperative that dispute resolution has to be a part of the job description of any managerial position, and along with this, construction management training courses featuring dispute resolutions have to be included (Quapp and Holschemacher 2020; Shash and Habash 2021). Traditionally, litigation has been a go to method for dispute resolution. Litigation is a costly process, and some resources are allocated for the same during every contract. The fact that the legal system is burdened with many cases and the judge to the dispute ratio is almost one in a thousand, making it quite impossible for quick judgements (Hemanth Sai Kalyan and Arokia Prakash 2019). Among the different methodologies available to resolve a dispute, choosing the most suitable one is the hardest task, and if chosen properly, the job is half done. Various factors affecting the method selection include dispute type, contractual relationship of the parties and many other factors, which are not known until the dispute arrival (Chaphalkar and Iyer 2014; Lee et al. 2016).
The methodology used to resolve, if any dispute arises, is mentioned in the contract beforehand, which is in a way good, but given the circumstances and the peculiar nature of dispute, flexibility in choosing an alternative dispute resolution (ADR) has to be included in the contract (Sabri and Torp 2022). ADR is mostly utilised to minimise the resources spent on litigation in courts. Negotiation, mediation and dispute review boards (DRBs) could be categorised under preventive methodologies, which could prove effective in terms of saving money and time before the transformation of a conflict to a dispute (Harmon 2009; Agdas and Ellis 2013a, 2013b; Senarath and Francis 2024).
While providing insights into the perception of stakeholders in the construction industry regarding ADR, the objectives of this study also include understanding the knowledge levels, implementational challenges and advantages regarding the usage of ADR. The major stakeholders in this business concerning disputes are the contractors, lawyers and consultant engineers, each having their own points of view, which are considered for a wholesome understanding of the concept. Any shortcomings with respect to each of the stakeholder groups are identified for possible policy making strategies and increasing awareness among them.
ADR mostly is introduced to minimise the resources spent on litigation in courts (Cheeks 1998). Negotiation is probably the first step taken to minimise disputes. Due to its informal nature, it may not be as effective as some formal procedures like arbitration or conciliation due to the rigidity of the disputed parties (Cheung et al. 2007, 2009). Negotiation assistance is required to resolve conflict in the early stages. Pena-Mora and Wang (1998) provided enough information on this topic and developed a computer aided collaborative negotiation methodology named CONVINCER, which proposed few characteristics that must be considered during negotiation, the first being the relationship among the disputed parties, weather collaborative or competitive. Second is the dispute barrier, and finally, the outcome of the project, which is influenced by the strategy. A special kind of the warning mechanism could come in handy for the negotiator to avoid unwanted settlement influenced by the opposition’s strategy (Saeb et al. 2018). The mediation process is often considered the only ADR method; this kind of notion has ill effects of not exploring many other processes. The basic idea is not only providing alternated dispute mechanisms but also providing the matching processes according to the particular dispute for resolution (Nylund 2014). Mediation and conciliation are generally used to bridge the communication gap between the parties whose relationship prior to the conflict is a healthy one and to enhance the future prospects of both the parties in collaborating with each other again (Menkel-Meadow 2015b).
Arbitration is used when the resolving process requires factual findings on which the decision-making depends (Abwunza et al. 2021). Litigation is of little use to resolve conflicts if the parties have to maintain the same relationship with each other because it is very rare that both the parties are satisfied with the judgement given, which is usually favourable only to one of them (Harmon 2003a, 2003b). Arbitration has a slight deviation from the procedure of litigation in the case of evidence submission and scrutiny where strict rules do not apply. Any type of evidence is accepted, which could be deemed right by the arbitrators due to the fact of them possessing extensive experience in their field, and it does not call for experts to testify the authenticity of the evidence (Hansen 2019). In some cases, it is also influenced by the perception of the parties based on their fairness with respect to their behaviour (Abwunza 2020).
DRB technique is regarded as one of the effective tools in dispute resolution especially during the construction execution stages of a project, which helps in avoiding the dispute at an early stage (El-Sewafy et al. 2022). At the end of the contract, if there exists zero disputes that were solved simultaneously during construction phase, that could be termed as a successful achievement by the DRB (Harmon 2011). Although it has major prospects, it is underutilised by contractors and owners citing to reasons such as prolonged dispute resolution process, unconvincing recommendations, time-consuming preparation of hearing process, etc. The money spent is also high in this process, which in some cases, urges an unlikely recommendation that is poorly crafted just for the sake of convincing either side (Agdas and Ellis 2013a, 2013b).
In the construction industry, artificial intelligence (AI) is used in project management to assist in several activities, e.g., planning, quality control, quantity measurement, etc. (Giwa et al. 2024). Collaboration of AI with the construction industry especially dispute resolution is not a new phenomenon (Abd Jamil and Fathi 2020; Padhy et al. 2021; Branting et al. 2023). Especially with the use of neural networks and other optimisation algorithms, data analysis is immensely useful. Whenever the data set is small and more supportive data is difficult to obtain, these neural network algorithms are highly useful. Predictions, correlations, regressions and other similar analyses are some of the many that can be easily done using artificial neural networks (ANNs) (Mostofi et al. 2022). There is immense importance and scope for AI in dispute resolution but there has not been much attraction towards it. The effective use of ADR methods with a more efficient, systematic and analytical approach using AI can be beneficial (Arditi and Pulket 2005; Fan and Li 2013; Lee et al. 2021). Data mining is needed, which helps in collecting the disorganised data, whether numeric or textual, and transforms it into knowledge, which is incorporated into the machine learning applications through statistical methods, which then combines with crowd wisdom to arrive at a relevant, practical and positive decision support outcome (Curt 1995).
A model was proposed highlighting the importance of constant monitoring of claims and change orders (CCO), which gives an idea of how efficient is the chosen dispute resolution ladder (DRL). DRL is a combination of one or more ADR techniques according to the nature of the dispute. With monitoring, there can be multiple checks such as efficiency and economics involved (Menassa and Peña Mora 2010).
Okudan et al. (2021) has developed a risk management tool using case-based reasoning (CBR), which has a potential to uplift the RM effectiveness in construction projects and also be utilised in similar project-based industries with slight modifications accordingly. Similarly, delay management has got equal importance from researchers and scholars to develop a management tool that could identify the delays, classify them and analyse them in such a way the impact of the delay on the project is measured, and finally, the damages caused due to the delays are estimated.
One of the management tools used for dispute resolution is the decision support system (DSS). It is a bit different from the expert system in terms of operation as the DSS is based more on past knowledge and similar cases experience which serves as data; whereas, the expert system uses a more human behavioural approach by analysing the prospects of a particular query because of the AI factor. The DSS has a limited scope when compared to the expert system as it has interference engines that helps in storing and picking appropriate case data. According to the case type and complexity, the use of the DSS or expert system is determined. The DSS offers a conceptual basis for problem solving. Questions answered by experts in the field such as contract administrators, professional, contracts, etc. are utilised in formulation of primary rule sets. This procedure could be handy in resolving disputes rather than opting for litigation (Iyer et al. 2012; Zhu et al. 2021).
Among the many available delay analysis methods, the one that yields the best results in various parameters is selected, enhanced and a DSS is developed that could satisfy the above-mentioned criteria. Yousefi (2017) has been successful in developing one such integrated model, which helps in identifying reasonable and acceptable delays. Many instances where AI has shown its potential into solving disputes or in forecasting the dispute occurrence have been recorded. A framework proposed by Fan and Li (2013) for the retrieval of a construction accident case with the aid of text mining techniques serves as a great source of knowledge for construction safety information management.
Implementation of a rule set for dispute resolution is an important aspect, which should at least consist the following: published past decisions, decision makers should follow the past decisions and finally a body to implement these rules (Christie and Rotstein 2015). This is also useful for future predictions as they can be formed as a fuzzy logic rule to identify important decision parameters (Bagherian-Marandi et al. 2021; Wen et al. 2021). Even the identification of exculpatory clauses in the contract can be useful in understanding the sensitive aspects of a contract and thus be prepared for it (Padhy et al. 2021; Surve and Delhi 2024).
The legal factors influencing the litigation prediction outcomes analysed in the research of Mahfouz and Kandil (2012) could be harnessed and used for better prediction and thus compliment as data for future machine learning models. This methodology could well be applied to other fields outside the construction and adapted to their own specifications to basically automate the legal factor detection in each case. Similarly, Chou et al. (2013) has done research in the field providing evidence that an ensemble model will yield the best output than a singular model on its own. A new ADR method is not proposed but an effective prediction model is created, which will help in identifying the factors and causes for an arrival of the dispute in public private partnerships (PPPs). The existing methods such as support vector mechanisms (SVMs), ANNs and C5.0 have been statistically analysed for their effectiveness and efficiency to find out which method yields the best output. Upon investigation, it is seen that an ensemble model consisting of all the three models is the best suited system for predicting the disputes. Further research is needed to find the disputed category and the possible resolution method based on the first model. Similar prediction outcomes were tested using machine learning techniques that were tested and found that the RBF Kernel SVM with >90% accuracy stood first followed by polynomial kernel SVM and C4.5 with 89.91% and 88.98% accuracy, respectively (Ayhan et al. 2021).
Upon testing various machine learning models like ANN boosted decision trees (BDTs) and CBR, which were used to predict the litigation outcomes, BDT showed most efficiency with a prediction rate of almost 90%, while CBR and ANN also were promising. But these results were achieved when the cases were small in number. The performance will be tested when the data set is huge (Arditi and Pulket 2005).
A combination of settlement-oriented systems (SOS), method selection-oriented system (MSOS) and dispute evaluation-oriented system (DEOS) will yield the optimal AI application in construction dispute resolution. The reason is that SOS deals with the support extended only through negotiation and does not explore other methods. MSOS is predominantly used to find which is the best suited method for a particular dispute among the existing methods, which also include negotiation as in the case of SOS. The causes related to the construction dispute are identified, and the probable impact of that cause on that dispute could be analysed. All of this constitutes to DEOS AI application. Individually, there is dichotomy among these systems, but when combined together, the resolution system obtained is a comprehensive one that has a holistic approach (Ilter and Dikbas 2009). The combination of all resources and proportions can be pooled in together to obtain a comprehensive technique by using the system of systems (SoS) approach (Ilter 2016).
Without opting for arbitration or litigation, by the use of proposed expert system called DRMeX, the dispute resolution using alternative technique ADR saves time and costs by presenting the simplified results. This system could be used by construction companies as a dispute management tool that analyses the current status of a dispute and come up with an alternative procedure to resolving it (Elziny et al. 2016).
Upon review of various litigation outcome prediction models, the integrated prediction model has the highest percentage of correct predictions as compared to CBR, ANN and PSO. However, the CBR method shows a significant difference in the prediction process involving and not involving human brain, which proves that human brain replacement with machines in subject application has not yet reached its pinnacle (Alozn and Galadari 2019). The demand for new types of ADR is also being satisfied with the hybrid forms such as online mediation and public policy mediation to aid problem solving by involving more parties and their participation. Many large-scale companies are developing their own model of ADR which is suitable for the technicalities of their disputes (Menkel-Meadow 2015b).
There is a need for widespread implementation of ADR methods incorporated with AI for effective dispute resolution. For this, an understanding of ADR among the stakeholders in the industry needs to be studied.
The aim of this study is to gain insights into the perspectives of three key stakeholder groups: advocates/lawyers, contractors and civil engineers, through a questionnaire survey. The data obtained can provide understanding of ADR before implementation in the construction industry. The regression method of ordinary least square (OLS) regression employing ANN was used to forecast the knowledge of the stakeholders regarding ADR (Rijnhart et al. 2017; Zhang et al. 2017).
The research methodology will outline the steps taken to design, distribute and analyse the questionnaire survey, including details on the questionnaire structure, sampling, data collection and data analysis.
The aspects of ADR identified from the literature are divided into three main sections:
- (a)
Knowledge of ADR: This section aims to assess the respondents’ familiarity with ADR mechanisms.
- (b)
Barriers in ADR implementation: This section is used to identify the challenges and obstacles hindering the effective implementation of ADR in the construction industry.
- (c)
Advantages of ADR: This section aims to gather insights into the perceived benefits of ADR in construction disputes.
In the final part, questions related to the role of lawyers in ADR for construction disputes, along with perception regarding the use of AI in ADR assistance were asked.
The target participants included advocates/lawyers, contractors and civil engineers actively involved in the construction industry. A purposive sampling approach was used to select participants who had relevant experience and expertise in the construction industry. Participants were contacted through professional networks, industry associations and online platforms. The study area is confined to the states of Telangana, Andhra Pradesh and Tamil Nadu in India. A total of 191 responses were obtained, ensuring a diverse representation of each stakeholder group. The survey was distributed electronically, ensuring easy access for respondents. The questionnaire was designed using online survey tools, and participants were sent personalised invitations with a link to the survey.
Overall, most of the respondents were lawyers/advocates in Civil law (39.3%), with the remainder being contractors (36.6%) and civil engineers (24.1%). Out of 191 respondents, most were bachelor degree holders (82.7%). Table 1 shows the complete background information of the respondents.
Respondent’s profile
| Current role | |
|---|---|
| Contractors | 36.6% |
| Lawyer/advocate | 39.3% |
| Civil engineer | 24.1% |
| Work experience (in years) | |
| 1–5 | 34.0% |
| 6–10 | 11.5% |
| 11–15 | 20.4% |
| 16–20 | 19.4% |
| >20 | 14.7% |
| Educational qualification | |
| Bachelor’s degree | 82.7% |
| Master’s degree | 13.1% |
| Diploma | 2.6% |
| Others | 1.0% |
| PhD | 0.5% |
A 5-point Likert scale was used for respondents to rate their responses. This scale allowed for quantification of opinions and perceptions. The data collected from the Likert scale responses were analysed quantitatively.
For the first category, the perspectives of the stakeholders regarding their knowledge of ADR needed to be understood. Eight questions regarding the same were posed to the participants with a 5-point Likert scale ranging from ‘Very High’ to ‘Very Poor’. The questions were as follows:
Knowledge of ADR among the respective working community
Usage of ADR among the respective working community
Motivation by experienced people for the usage of ADR
Commitment of associations for implementing ADR
Level of training given by associations for ADR
Developing relationships for ADR implementation
Awareness of ADR concepts among the respective working community
Procedures to enhance ADR approach
Similarly, the perspectives of the stakeholders regarding barriers in ADR implementation needed to be understood. Eight questions regarding the same were posed to the participants with a 5-point Likert scale ranging from ‘Strongly Agree’ to ‘Strongly Disagree’. The questions were as follows:
Lack of ADR awareness among the respective working community
Inadequate planning in implementation of ADR
First impression and perception of the disputed parties for effective dispute resolution
Flexibility to adapt new resolution processes
A perception of ‘non-binding nature of ADR a threat to justice’
Long implementation time required
Improper education of ADR
Lack of proper communication
Finally, the perspectives of the stakeholders regarding the advantages of ADR had to be studied for effective implementation. Six statements regarding the same were posed to the participants with a 5-point Likert scale ranging from ‘Strongly Agree’ to ‘Strongly Disagree’. They were as follows:
ADR gives quicker solutions
ADR is economical compared to litigation
ADR provides efficient and effective results
ADR maintains the relationship among disputed parties
ADR protects privacy of the disputed parties
ADR gives mutually consented decisions
For each of these three categories, mean scores were calculated for each question. This provided an average rating of responses. Standard deviations (SDs) were calculated to measure the variability or dispersion of responses for each question, indicating the consensus or divergence of opinions. A comparative analysis of mean scores and SDs across the three stakeholder groups (advocates/lawyers, contractors and civil engineers) was done to identify potential variations in perspectives. In addition to the Likert scale responses, open-ended questions were included in the survey to gather qualitative insights.
From the questionnaire data, statistical analysis and regression analysis were performed to predict the knowledge of ADR among the stakeholders. The dataset used in the current study is derived from experimental investigations. The dataset comprises five independent/input variables of the Likert scale (very poor, poor, satisfactory, high and very high) and three dependent/output variables (mean, SD and variance). Table 2 provides a statistical summary of the collected data, detailing input and output variables’ ranges, averages and SD.
Descriptive statistics of variables of knowledge of ADR
| Variables | Role | Knowledge | Usage | Motivation | Commitment | Training | Relationship | Awareness | Procedures |
|---|---|---|---|---|---|---|---|---|---|
| Very poor | Input | 64 | 38 | 59 | 60 | 68 | 55 | 65 | 55 |
| Poor | Input | 71 | 105 | 76 | 87 | 80 | 98 | 84 | 85 |
| Satisfactory | Input | 39 | 37 | 38 | 33 | 36 | 29 | 36 | 43 |
| High | Input | 12 | 9 | 16 | 9 | 6 | 8 | 5 | 4 |
| Very high | Input | 5 | 2 | 2 | 2 | 1 | 1 | 1 | 4 |
| Mean | Output | 2.07 | 2.12 | 2.09 | 1.98 | 1.91 | 1.96 | 1.92 | 2.04 |
| SD | Output | 1.013 | 0.815 | 0.967 | 0.879 | 0.844 | 0.81 | 0.823 | 0.888 |
| Variance | Output | 1.026 | 0.664 | 0.934 | 0.773 | 0.713 | 0.657 | 0.677 | 0.788 |
ADR, alternative dispute resolution; SD, standard deviation.
Reliability analysis is used to measure the internal consistency of the items in each category with the help of the Cronbach’s alpha value. This tells us how well the items within each category measure the same underlying concept. The reliability of the data was checked using the Cronbach’s alpha values, which were found to be 0.863, 0.784 and 0.899 for the three respective categories mentioned above, which is >0.6, hence making the data set an acceptable one (Taber 2018). For the first group in the category of understanding ADR, a value of 0.863 was obtained, which suggests very good internal consistency. It means that the items in the first category are highly correlated and measure the same underlying concept reliably. For the second group in the category of understanding of ADR, a value of 0.784 was obtained. While it is slightly <0.863, it still shows that the items in the second category are well-correlated and reliable. For the final category, a value of 0.899 was obtained. This value suggests excellent internal consistency. It means that the items in the third category are extremely well-correlated and very reliably measure the same underlying concept.
The statistical analysis involves studying the descriptive statistics of the dataset to understand the distribution and characteristics of the variables. Key statistics, such as the mean, SD, minimum, maximum and quartiles, are calculated for both the input and the output variables. These statistics provide insights into the central tendency, variability and distribution of the data. Table 2 presents the statistical characteristics of the data gathered for predicting the knowledge of ADR among the stakeholders using the ANN models. The dataset consists of three output variables and five input variables. The variables listed are used to analyse the understanding of stakeholders regarding ADR. The Likert scale data are included in the input factors. However, the output variable is the mean SD and variance.
Table 3 shows the descriptive statistics for the attributes of barriers to ADR. This domain has eight variables, and the responses are gathered similarly to the first domain on a 5-point Likert scale ranging from strongly disagree to strongly agree.
Descriptive statistics of variables of barriers of ADR
| Variables | Awareness | Planning | Perception | Flexibility | Non-binding | Implementation | Education | Communication |
|---|---|---|---|---|---|---|---|---|
| Strongly disagree | 0 | 1 | 1 | 13 | 15 | 1 | 3 | 1 |
| Disagree | 3 | 5 | 11 | 39 | 123 | 23 | 8 | 2 |
| Neutral | 51 | 17 | 58 | 55 | 25 | 75 | 43 | 27 |
| Agree | 102 | 126 | 75 | 60 | 22 | 71 | 111 | 96 |
| Strongly agree | 35 | 42 | 46 | 24 | 6 | 21 | 26 | 65 |
| Mean | 3.88 | 4.06 | 3.81 | 3.23 | 2.38 | 3.46 | 3.78 | 4.16 |
| SD | 0.709 | 0.678 | 0.888 | 1.118 | 0.903 | 0.863 | 0.791 | 0.740 |
| Variance | 0.502 | 0.459 | 0.789 | 1.249 | 0.815 | 0.745 | 0.625 | 0.570 |
ADR, alternative dispute resolution; SD, standard deviation.
Table 4 shows descriptive statistics for the attributes of successful outcomes to ADR. This domain has six variables, and the responses are gathered similarly to the first domain on a 5-point Likert scale ranging from strongly disagree to strongly agree.
Descriptive statistics of variables of outcomes of ADR
| Variables | Quick | Economical | Efficient | Relationship | Privacy | Consent |
|---|---|---|---|---|---|---|
| Strongly disagree | 0 | 1 | 1 | 13 | 15 | 1 |
| Disagree | 3 | 5 | 11 | 39 | 123 | 23 |
| Neutral | 51 | 17 | 58 | 55 | 25 | 75 |
| Agree | 102 | 126 | 75 | 60 | 22 | 71 |
| Strongly agree | 35 | 42 | 46 | 24 | 6 | 21 |
| Mean | 4.13 | 4.17 | 4.15 | 4.15 | 4.10 | 4.00 |
| SD | 0.570 | 0.730 | 0.777 | 0.754 | 0.758 | 0.740 |
| Variance | 0.325 | 0.533 | 0.603 | 0.568 | 0.574 | 0.547 |
ADR, alternative dispute resolution; SD, standard deviation.
The regression analysis used for predicting the knowledge of ADR among the stakeholders will only be reliable when the variables are within the prediction interval. Statistical data analysis helps derive these data. As depicted in Figure 1, the histograms illustrate the distribution of each input variable.
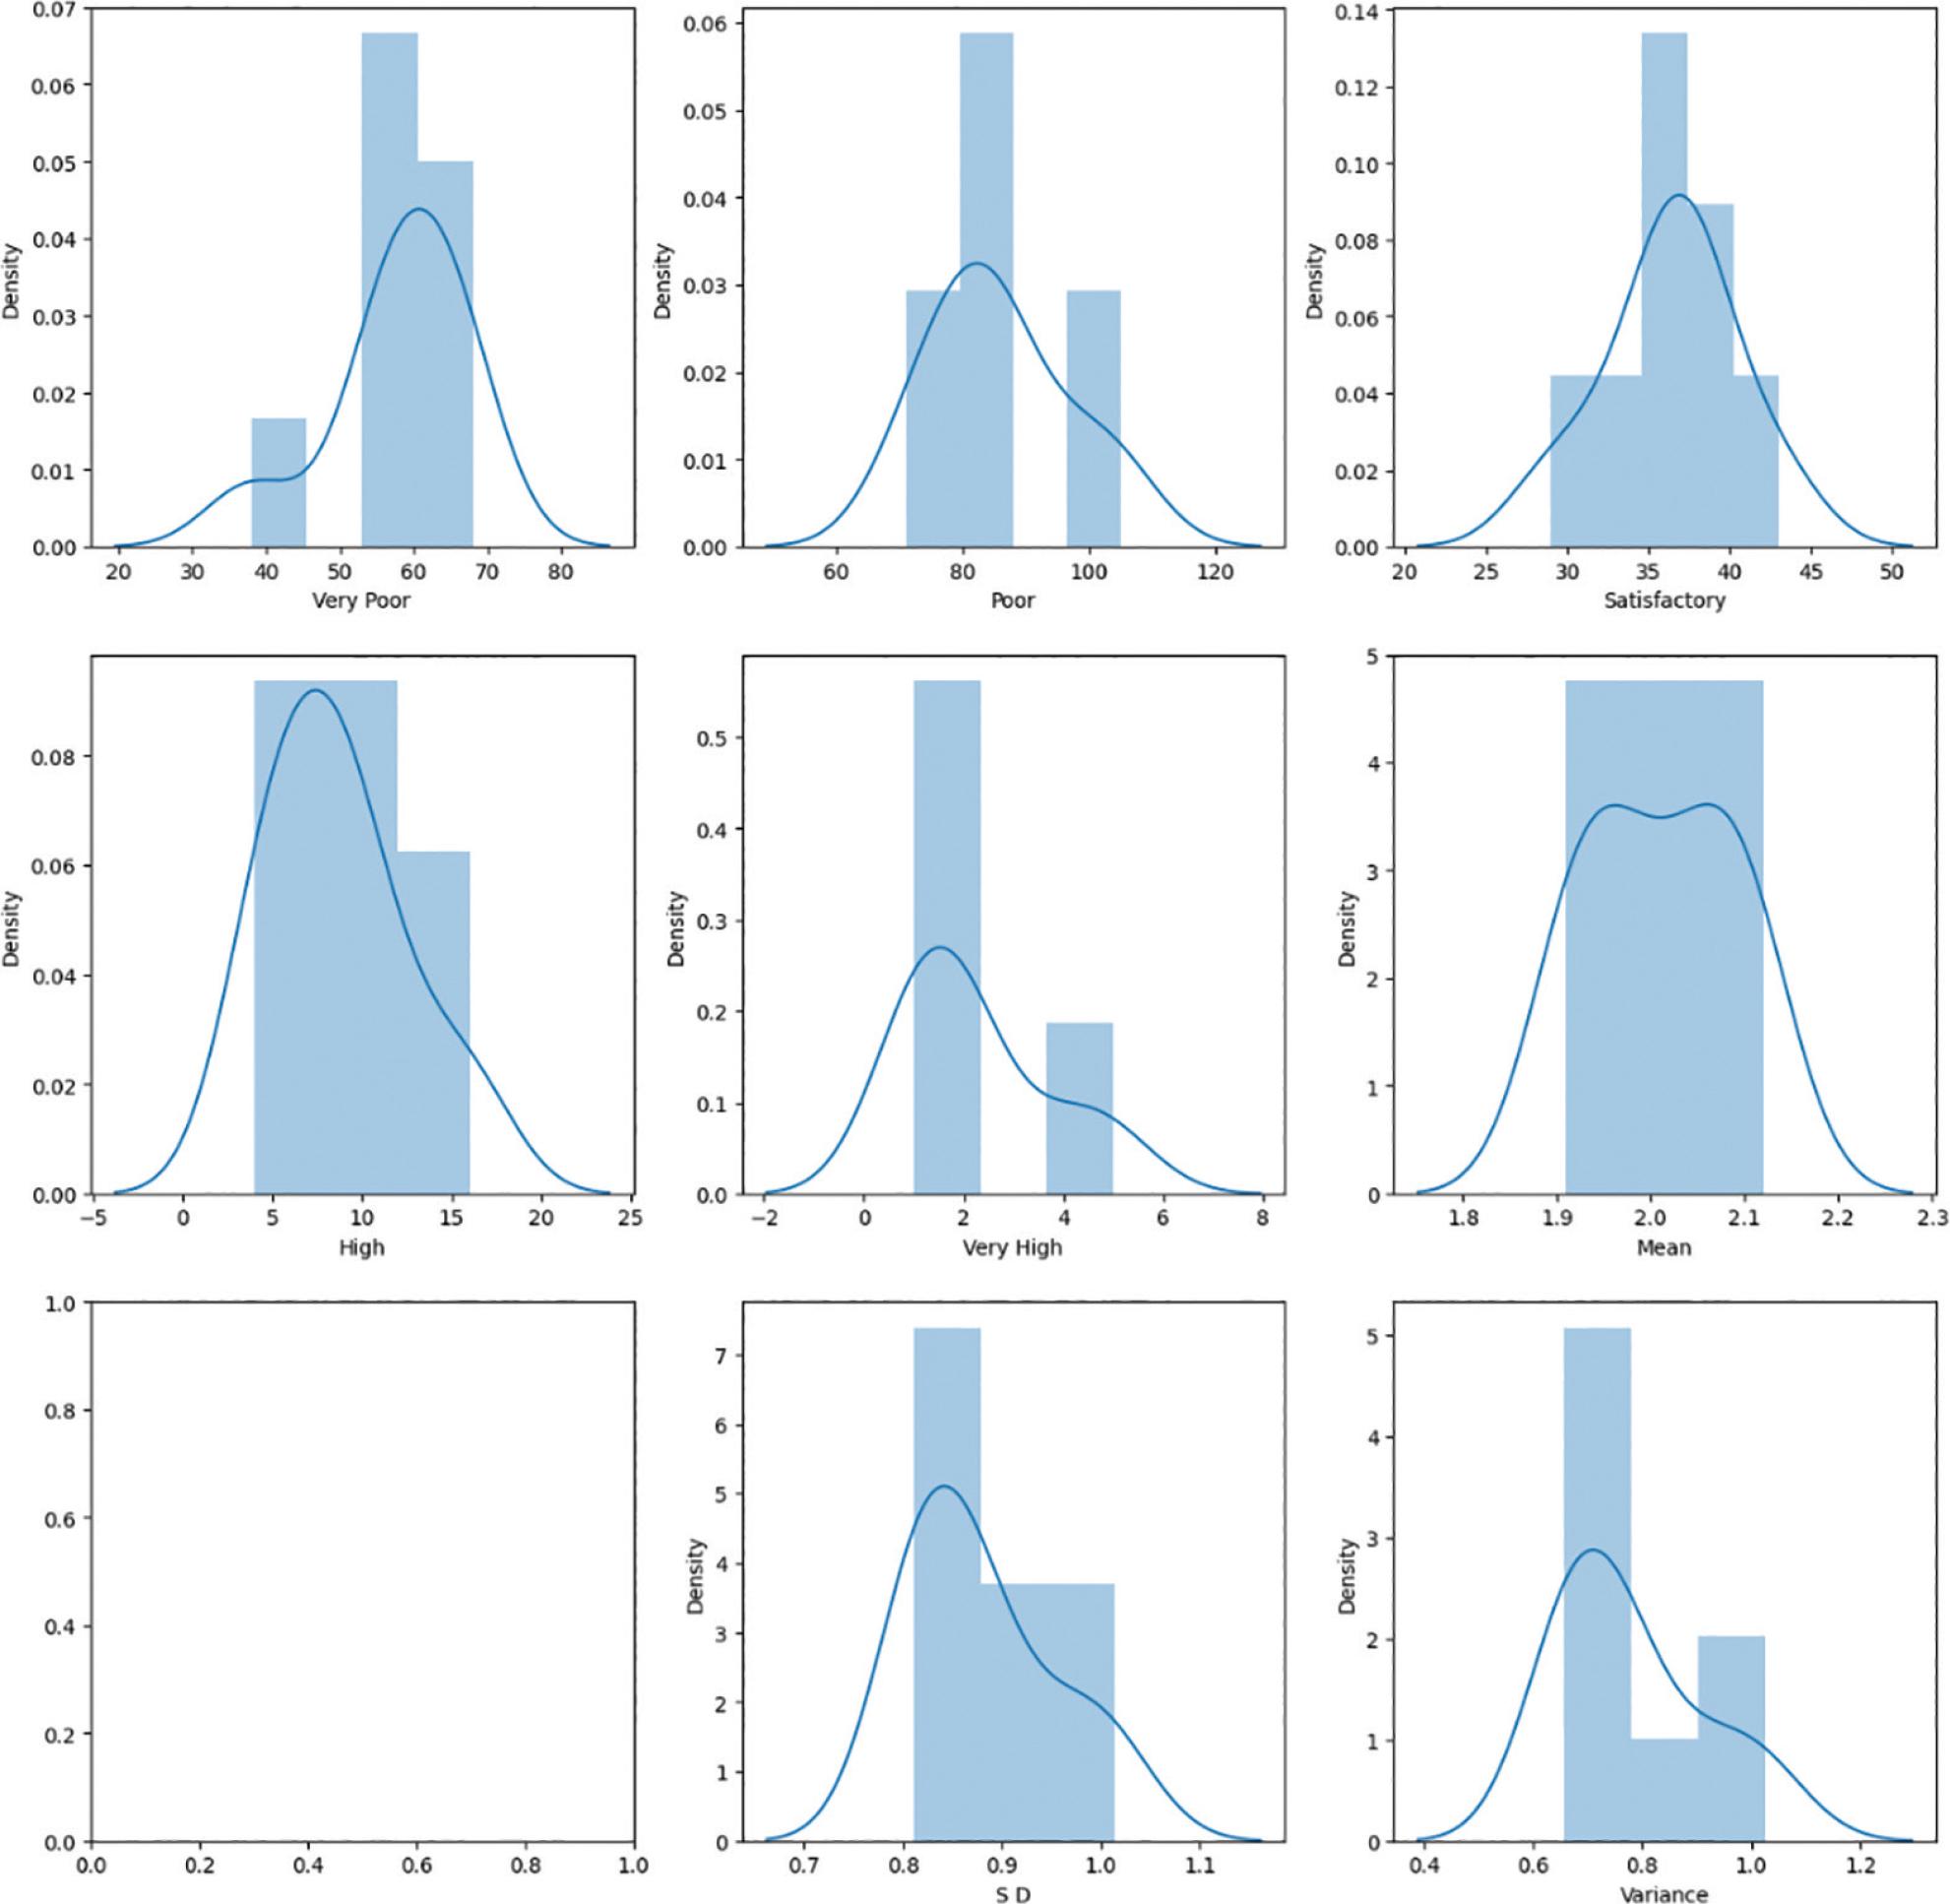
Distribution of Likert scale attributes of ADR. ADR, alternative dispute resolution.
Figure 1 depicts the observed deviations from a perfectly normal distribution, and the presence of asymmetry in the data may be attributed to several factors. Additionally, variations in data collection and measurement errors could contribute to the observed asymmetry and deviations. A slight negative skew is seen for very poor category. For poor, high, very high, SD and variance, there is slight positive skew. However, satisfactory and mean depict almost zero skew signifying the normal distribution. The dataset consists of 64 data variables, split randomly into subgroups for training and testing of data. Notably, 70% of the data was used for training purpose and developing the ANN model, while the remaining 30% of the data was used to evaluate the predictive model’s performance.
The combination of quantitative and qualitative data allowed for a comprehensive understanding of the stakeholders’ perspectives on ADR in the construction industry. Patterns, trends and outliers were identified and interpreted to draw meaningful conclusions.
Validating the dataset is a critical step before building the ANN models. It should be in sync with the output and input trends. The coefficient of determination R2 is one of the metrics which is used to evaluate the relationships among the variables. If the R2 value is approximately near to 1, it indicates a perfect fit of the data. Figure 2 shows the correlation matrix for the present data set. The correlation signifies the extent of general perception of ADR among the stakeholders. It is performed to understand disparity between the levels of perception. The output parameters of mean, SD and variance are highly correlated to each other. Among the input parameters, ‘high’ is significantly correlated to ‘very high’. In case of negative correlation, ‘poor’ is significant with respect to ‘satisfactory’.
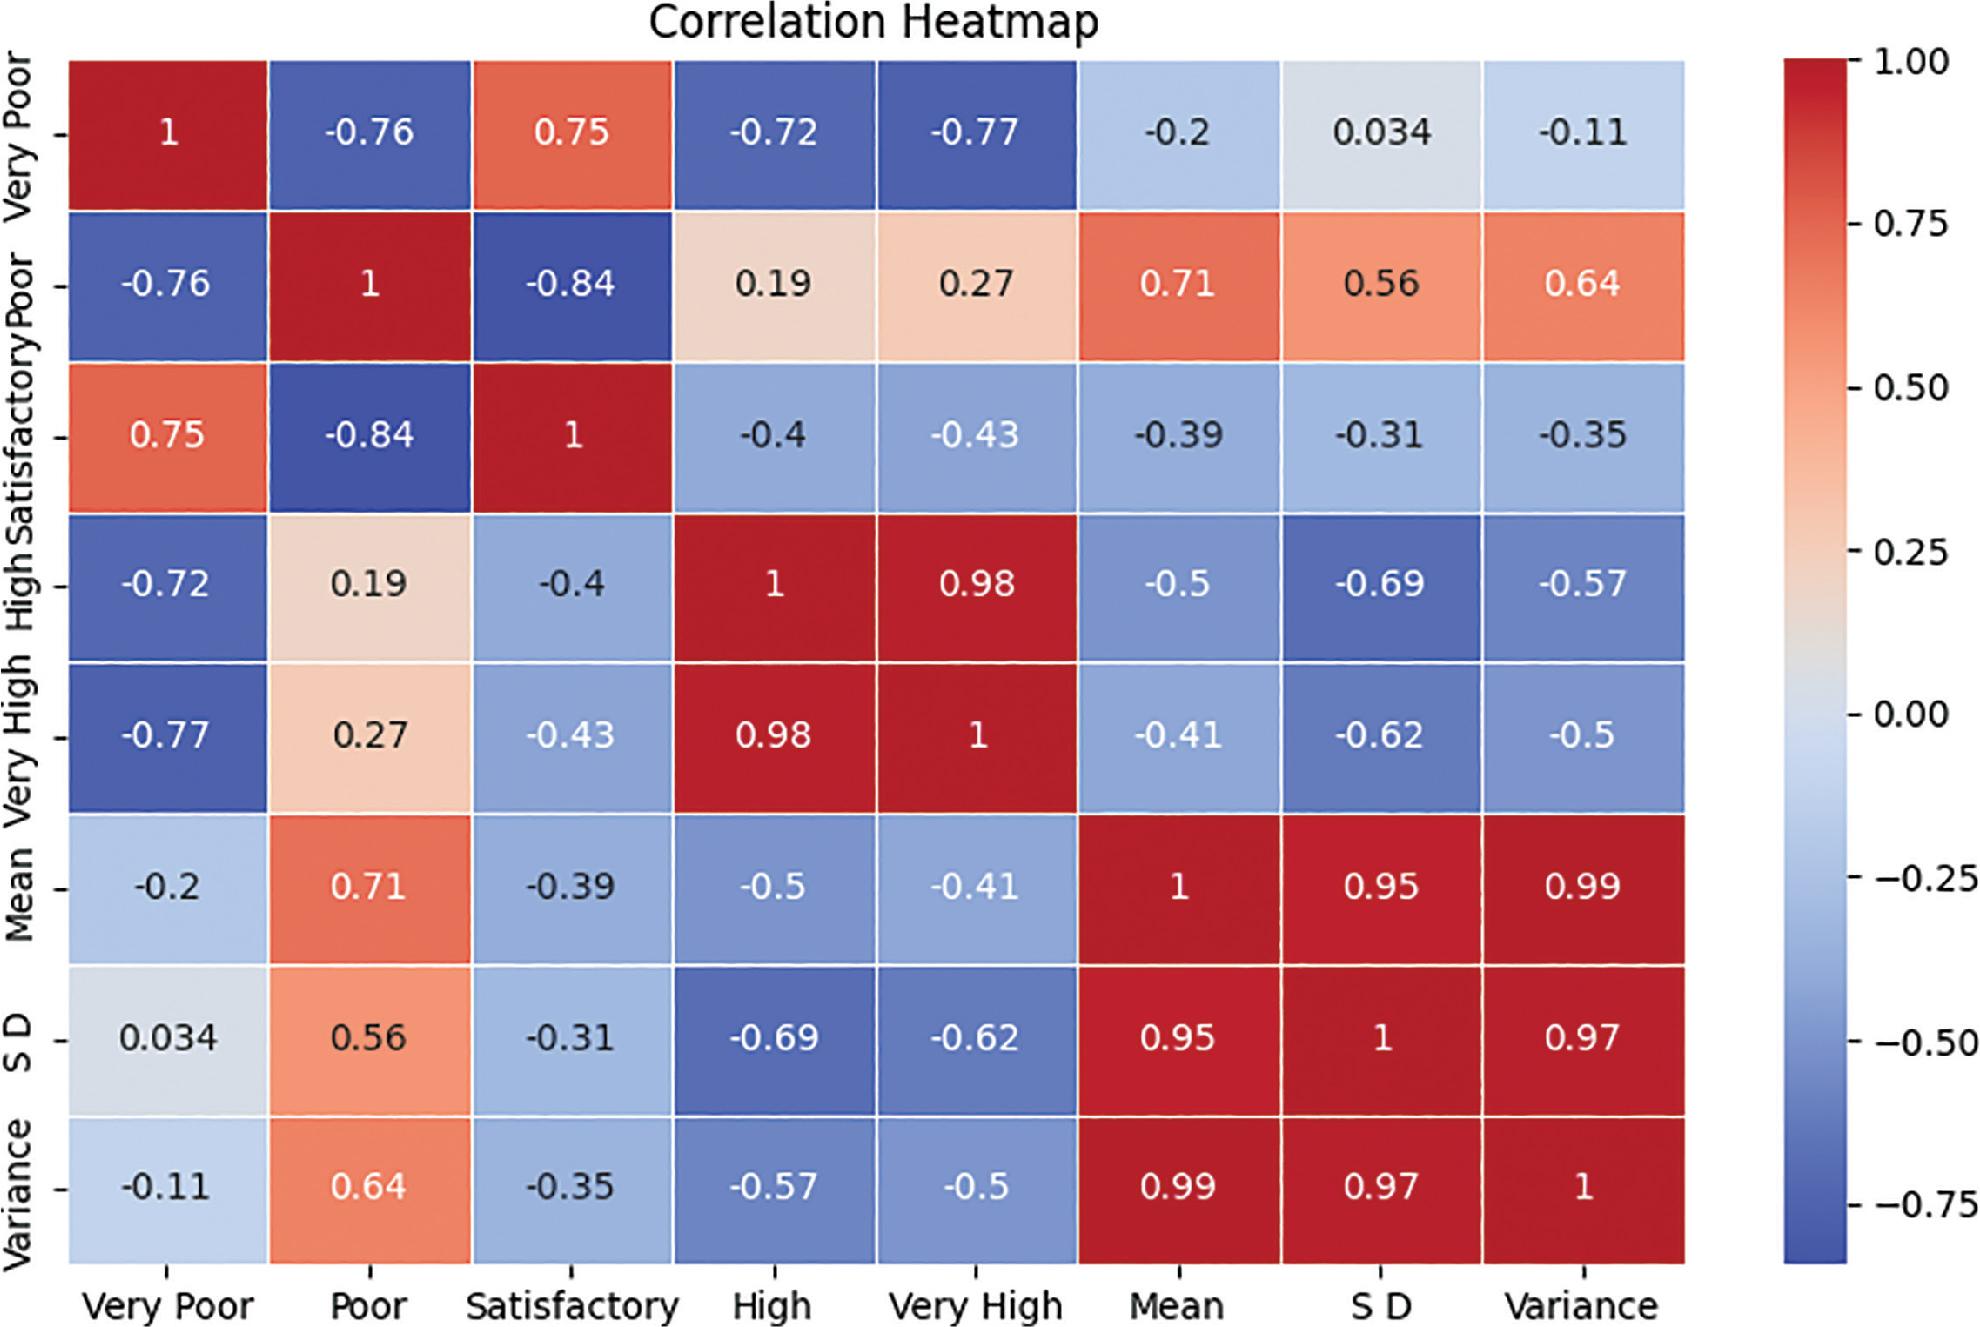
Correlation of Likert scale attributes of ADR. ADR, alternative dispute resolution; SD, standard deviation.
ANOVA tests conducted in one method were used to assess the interdependence of the variables. Figure 3 shows the description of one-way ANOVA results that were performed for the data set to see if the Likert scale responses differ across the groups. The p-value is 0.428325 and the F-statistic is 0.72121 for extremely poor. The fact that the p-value is >0.05 indicates that there is not a substantial disparity between the group means. In contrast, the p-value is 0.020305 and the F-statistic is 9.801667 for the poor group. Additionally, there is not a substantial distinction between the group means because the p-value is below 0.05. The F-statistic for high and very high is 5.025962, the p-value is 0.066177 for high and the F-statistic for very high is 7.469554 with the p-value of 0.034048.
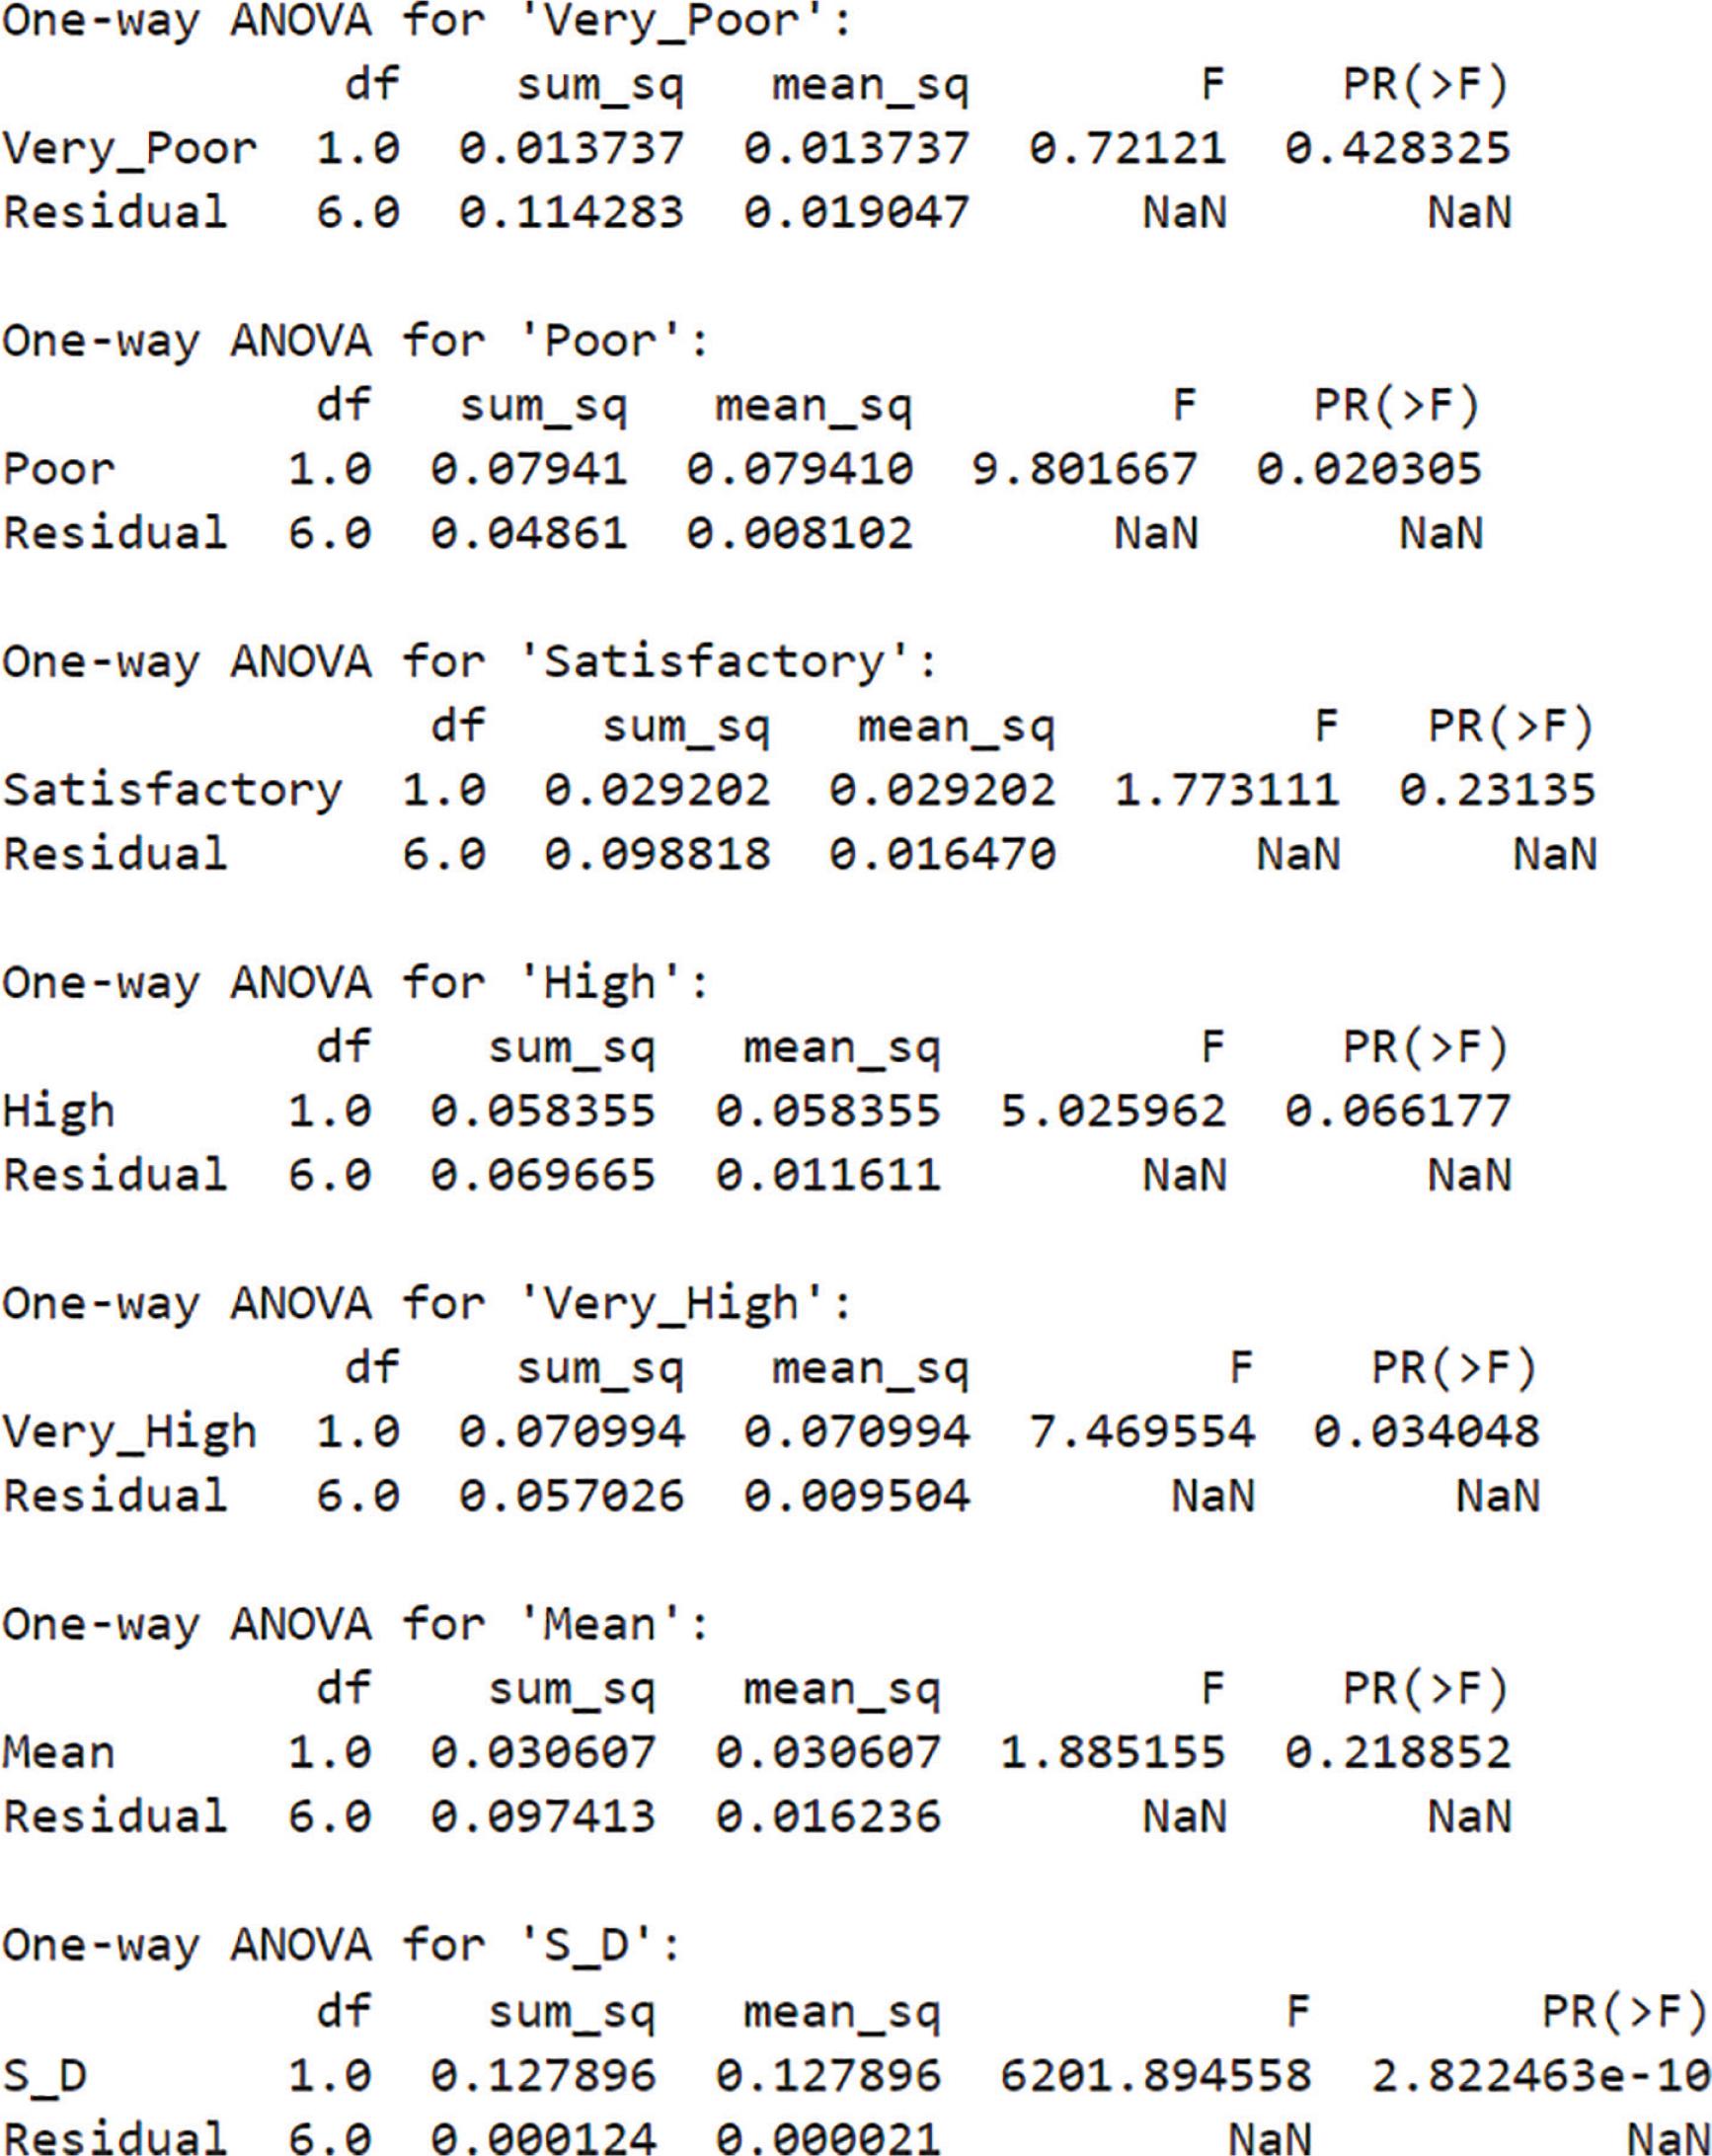
One-way ANOVA for the variables.
One-way ANOVA results represented graphically in Figure 4 depict the comparison of variances in the data set. For the Likert attributes as well as Mean values, a lower F-value suggests that the group means are not much different from each other compared to the variability within the groups. Similarly, for higher p-value around 0.05, there exists a slight difference between the group means. When the p-value is extremely high and <0.05, it indicates a substantial difference between the group means. The p-value for the satisfactory category is 0.231350 and the F-statistic is 1.773111. Since the p-value is >0.05, the group means do not differ significantly from one another. The means of the groups for SD, very high and poor all varied significantly. For high, there is a slightly significant variation between the group means. For very poor, satisfactory and mean, there is no discernible difference in the group means.
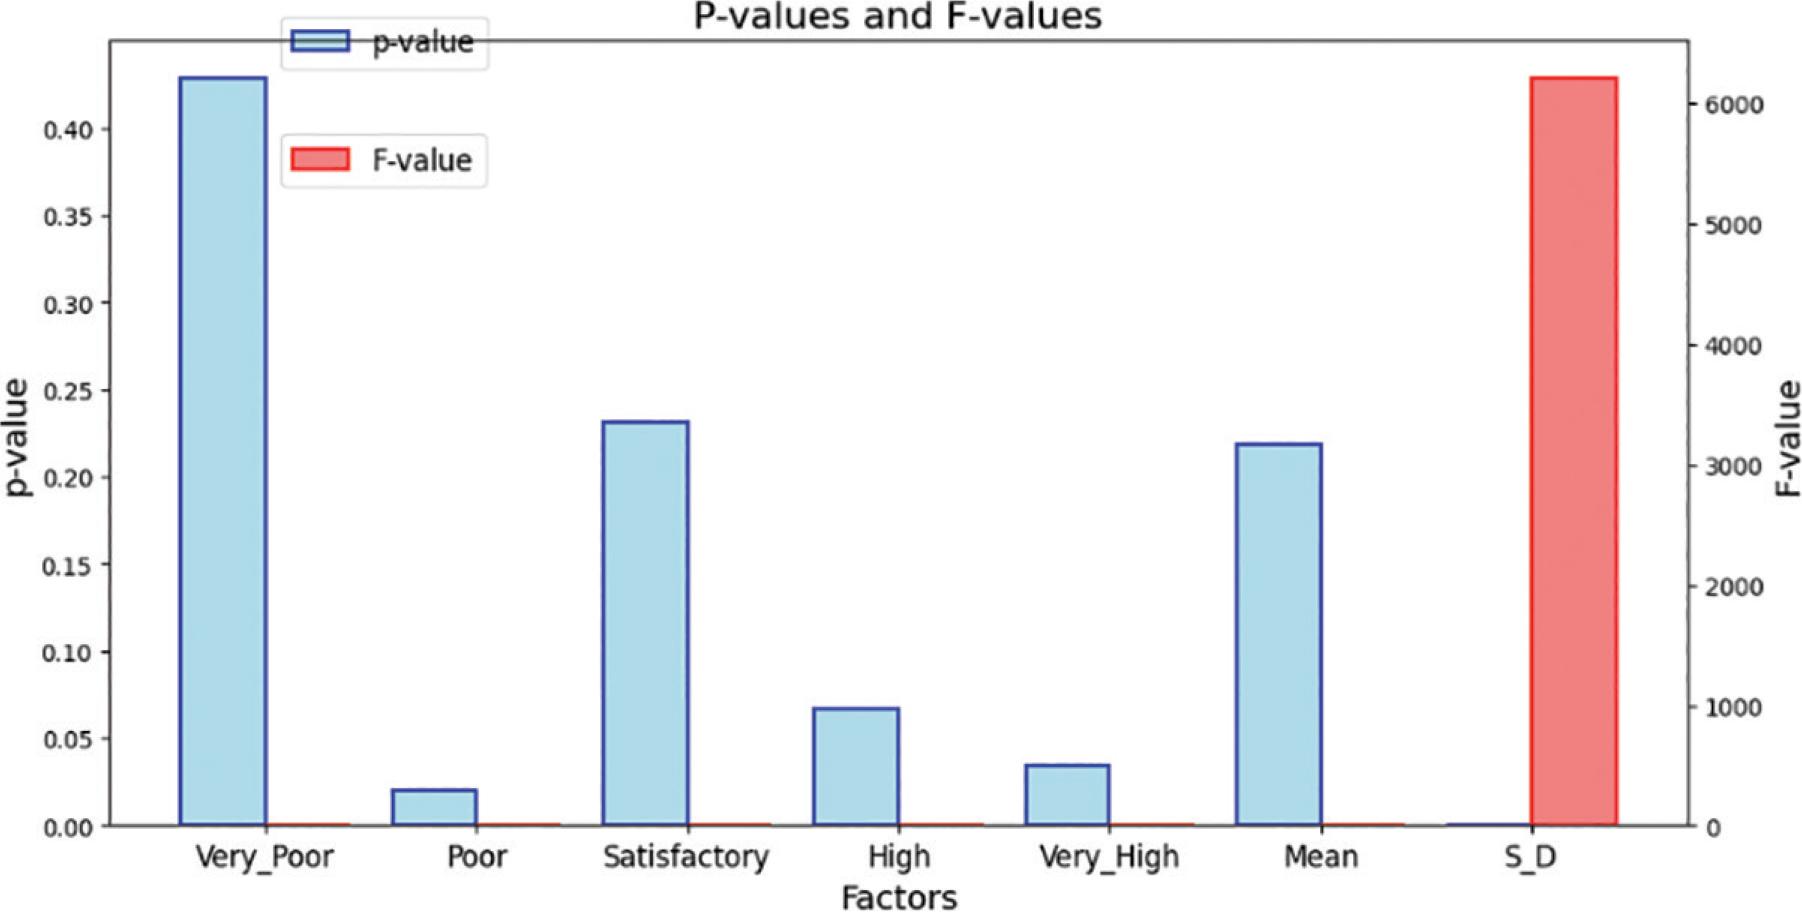
Graphical representation of one-way ANOVA results.
The OLS regression method is a statistical method for modelling relationships between variables. To start, a linear equation describing the relationship among one or more independent as well as dependent variables must be defined. The aim of this study is find the coefficients that reduce the sum of squared discrepancies between actual and anticipated values. Assuming that all other variables remain constant, these coefficients depicts the effects of dependent over independent variables. OLS is frequently used in disciplines like economics and social sciences because of its simplicity and interpretability. However, it is dependent on several important assumptions, including linearity and normally distributed errors. This methodology uses Eq. (1) to fit the best-fitting linear model to the data, which aids in quantifying and comprehending correlations between variables (Hayes and Cai 2007).
Yi signifies the value of the dependent variable for the ith case; β0 is the regression’s constant term; xij is the ith case’s score on the jth predictor variable out of the p predictors in the model; βj is the regression coefficient for the jth predictor variable and εi is the ith case’s error term. In a matrix representation, Eq. (2) can be restated as follows:
From the equation:
Y = vector of result observed results (n × 1).
X = matrix of values for the predictor variable (n × (p + 1)), which includes a column of ones for the regression constant.
= error vector (n × 1).
n = The sample size.
p = The number of predictor variables.
= The coefficients show distinct associations between each of the predictor variables and the outcome variable.
Through the combination of a sample-derived estimate and an estimate of the sample variance, OLS regression is frequently used by researchers to test the null hypothesis that a certain element in β is zero or to construct a confidence range for that element.
The dataset is split into ‘features (X)’ and the ‘target variable (Y)’ within the parameters of the study. The data are then split using a typical training-test split approach into a training set and a test set. The programme is run using the simple estimator to initialise the model and assume n = 100. The Fit () method is used to train the model using the training data after the base estimator has been started. Evaluation metrics like MSE, RMSE and R2 are calculated from the model that is demonstrated by Eqs. (3)–(5).
The OLS regression results for ‘mean’ in the graph shows that a dependent variable’s variance can be fully explained by the model when the R2 value is 1.000 as shown in Figure 5. Additionally, the model’s adjusted R2 value of 0.999 is very high, suggesting that the data fit the model well. The probability value is <0.0001, and the 1929 F-statistic is extremely high. This indicates that all of the coefficients are statistically significant. In other words, there is a very low probability that any of the coefficients are equal to zero. There is a high degree of multicollinearity in the data, which can make it difficult to interpret the individual coefficients. The actual vs prediction graph is shown in Figure 6.
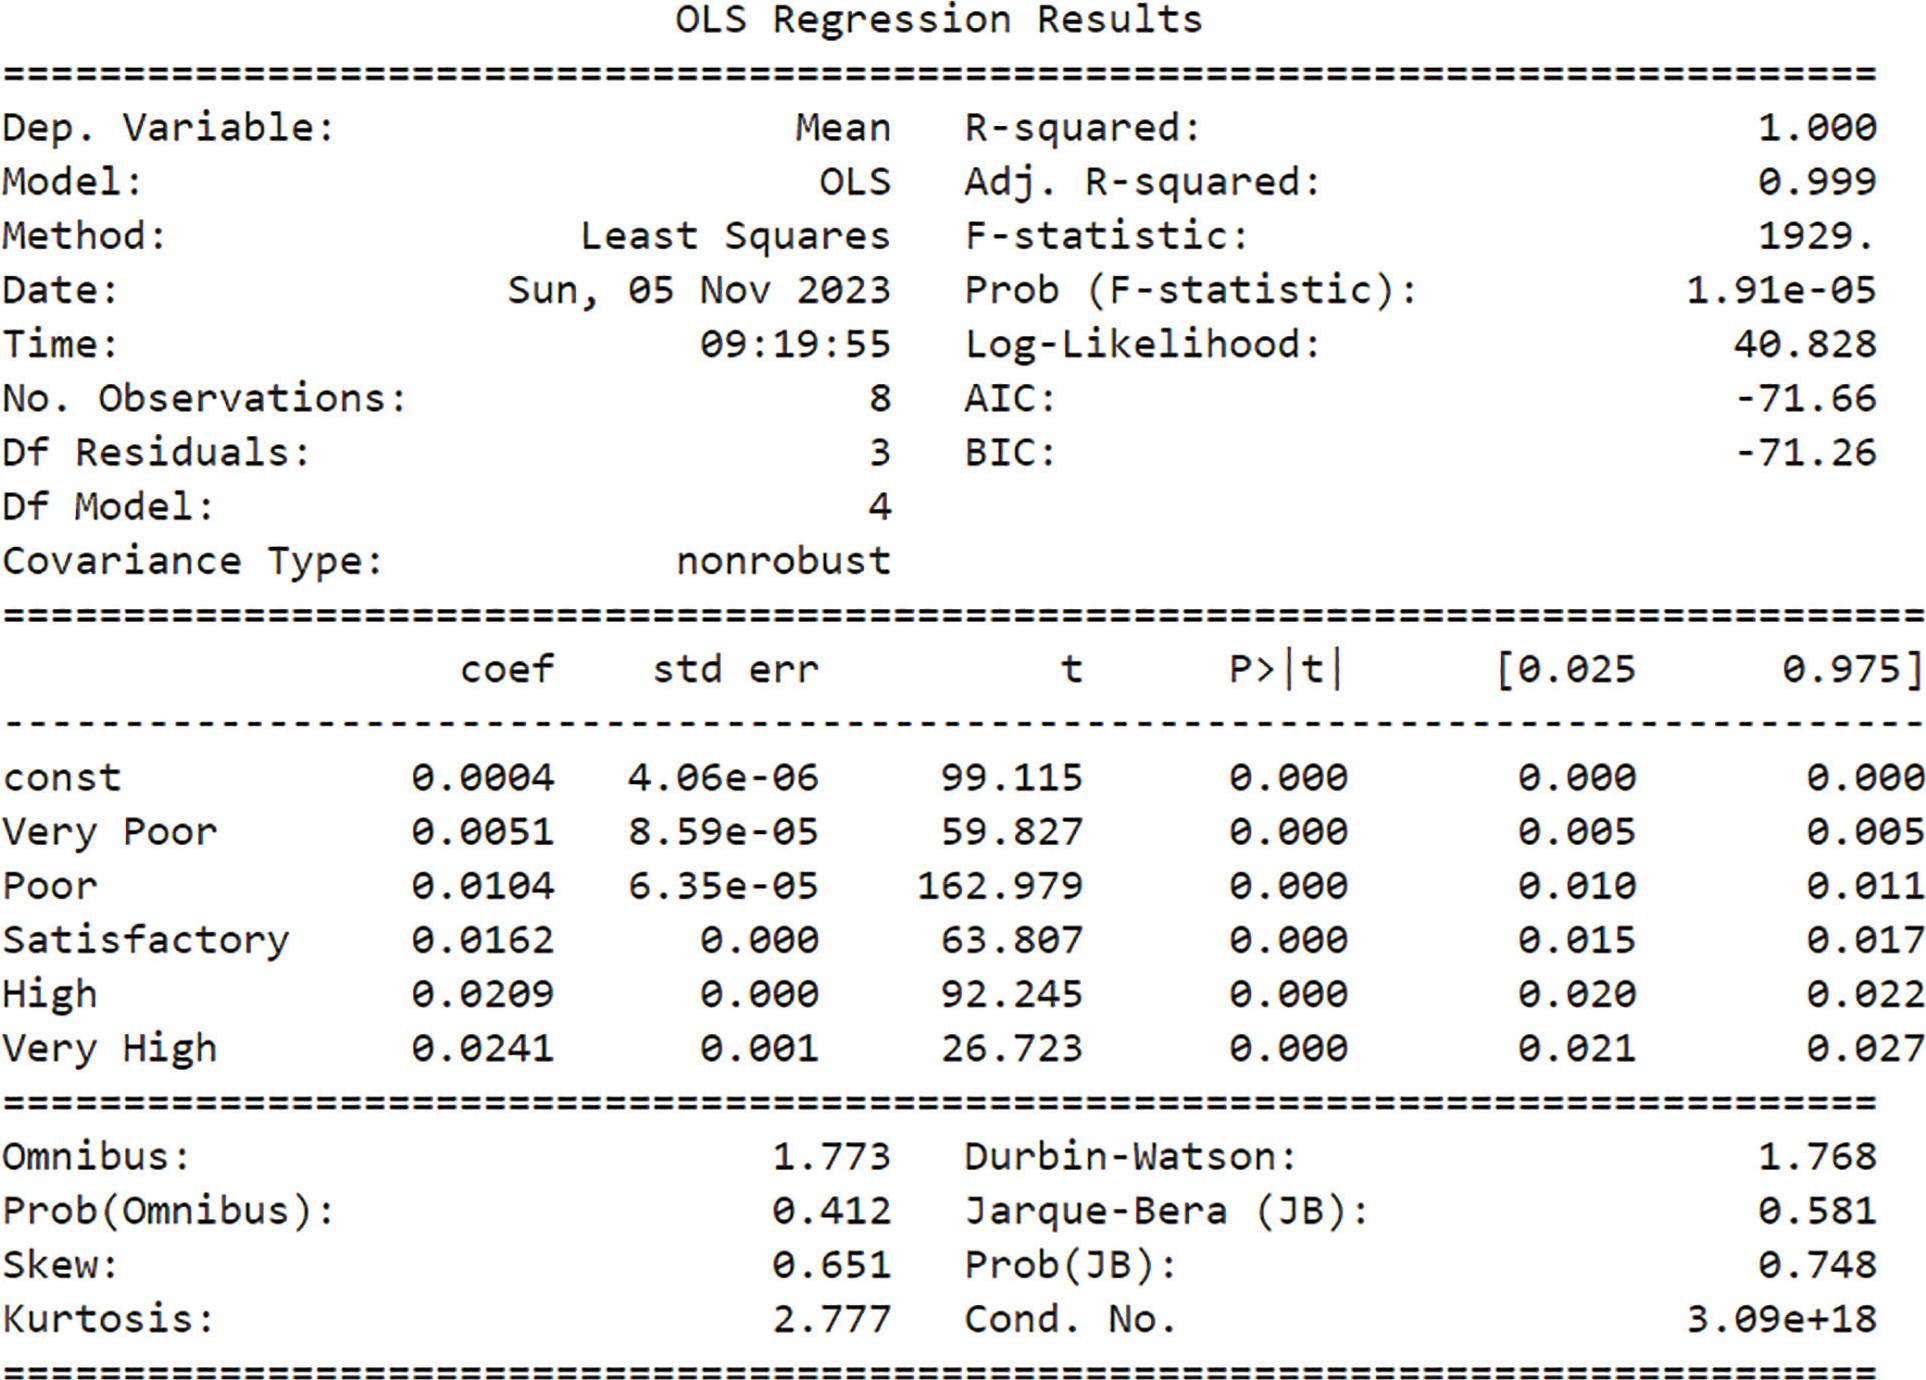
OLS regression results for mean. JB, Jarque-Bera; OLS, ordinary least square.
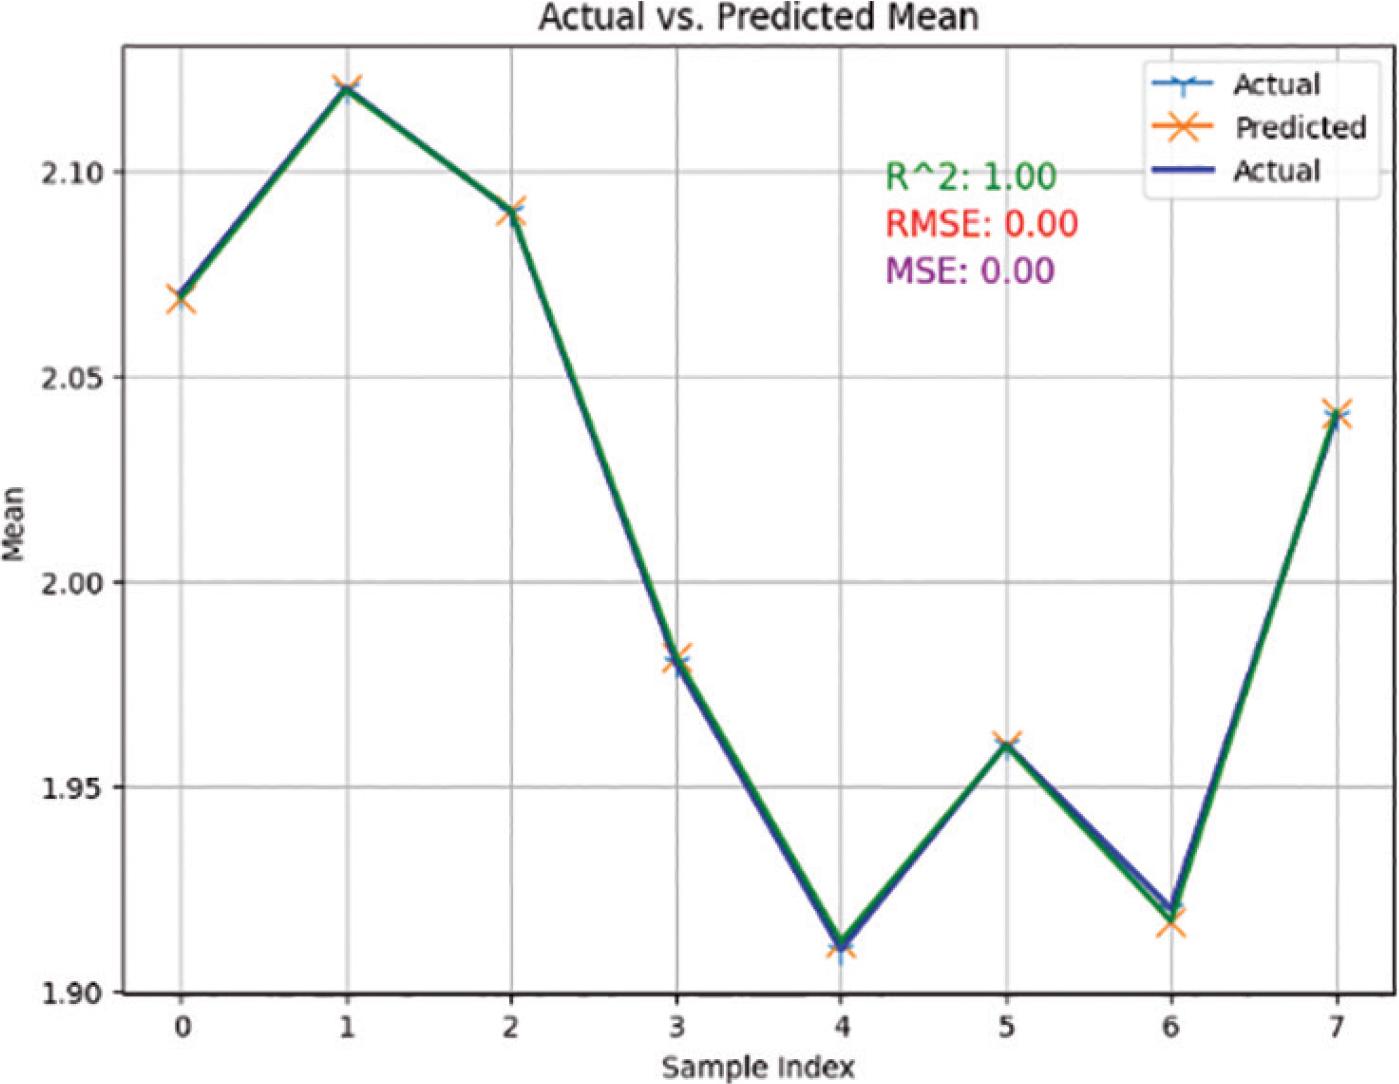
Actual vs prediction graph for OLS regression results for mean. OLS, ordinary least square.
The results for the ‘standard deviation’ output have an R2 of 0.998, and the dependent variable’s variance is explained by the model 99.8% of the time as shown in Figure 7. Additionally, the model’s adjusted R2 value of 0.995 is very high, suggesting that the data fit the model well. The probability value is <0.001, and the F-statistic of 322.4 is extremely high. This suggests that there is a statistical significance in the model. There is a very low probability that any of the coefficients are equal to zero. All of the variables that are independent are statistically significant, and the model fits the data well overall, according to the OLS regression results. However, there is a high degree of multicollinearity in the data, which can make it difficult to interpret the individual coefficients. The actual vs prediction graph is shown in Figure 8.
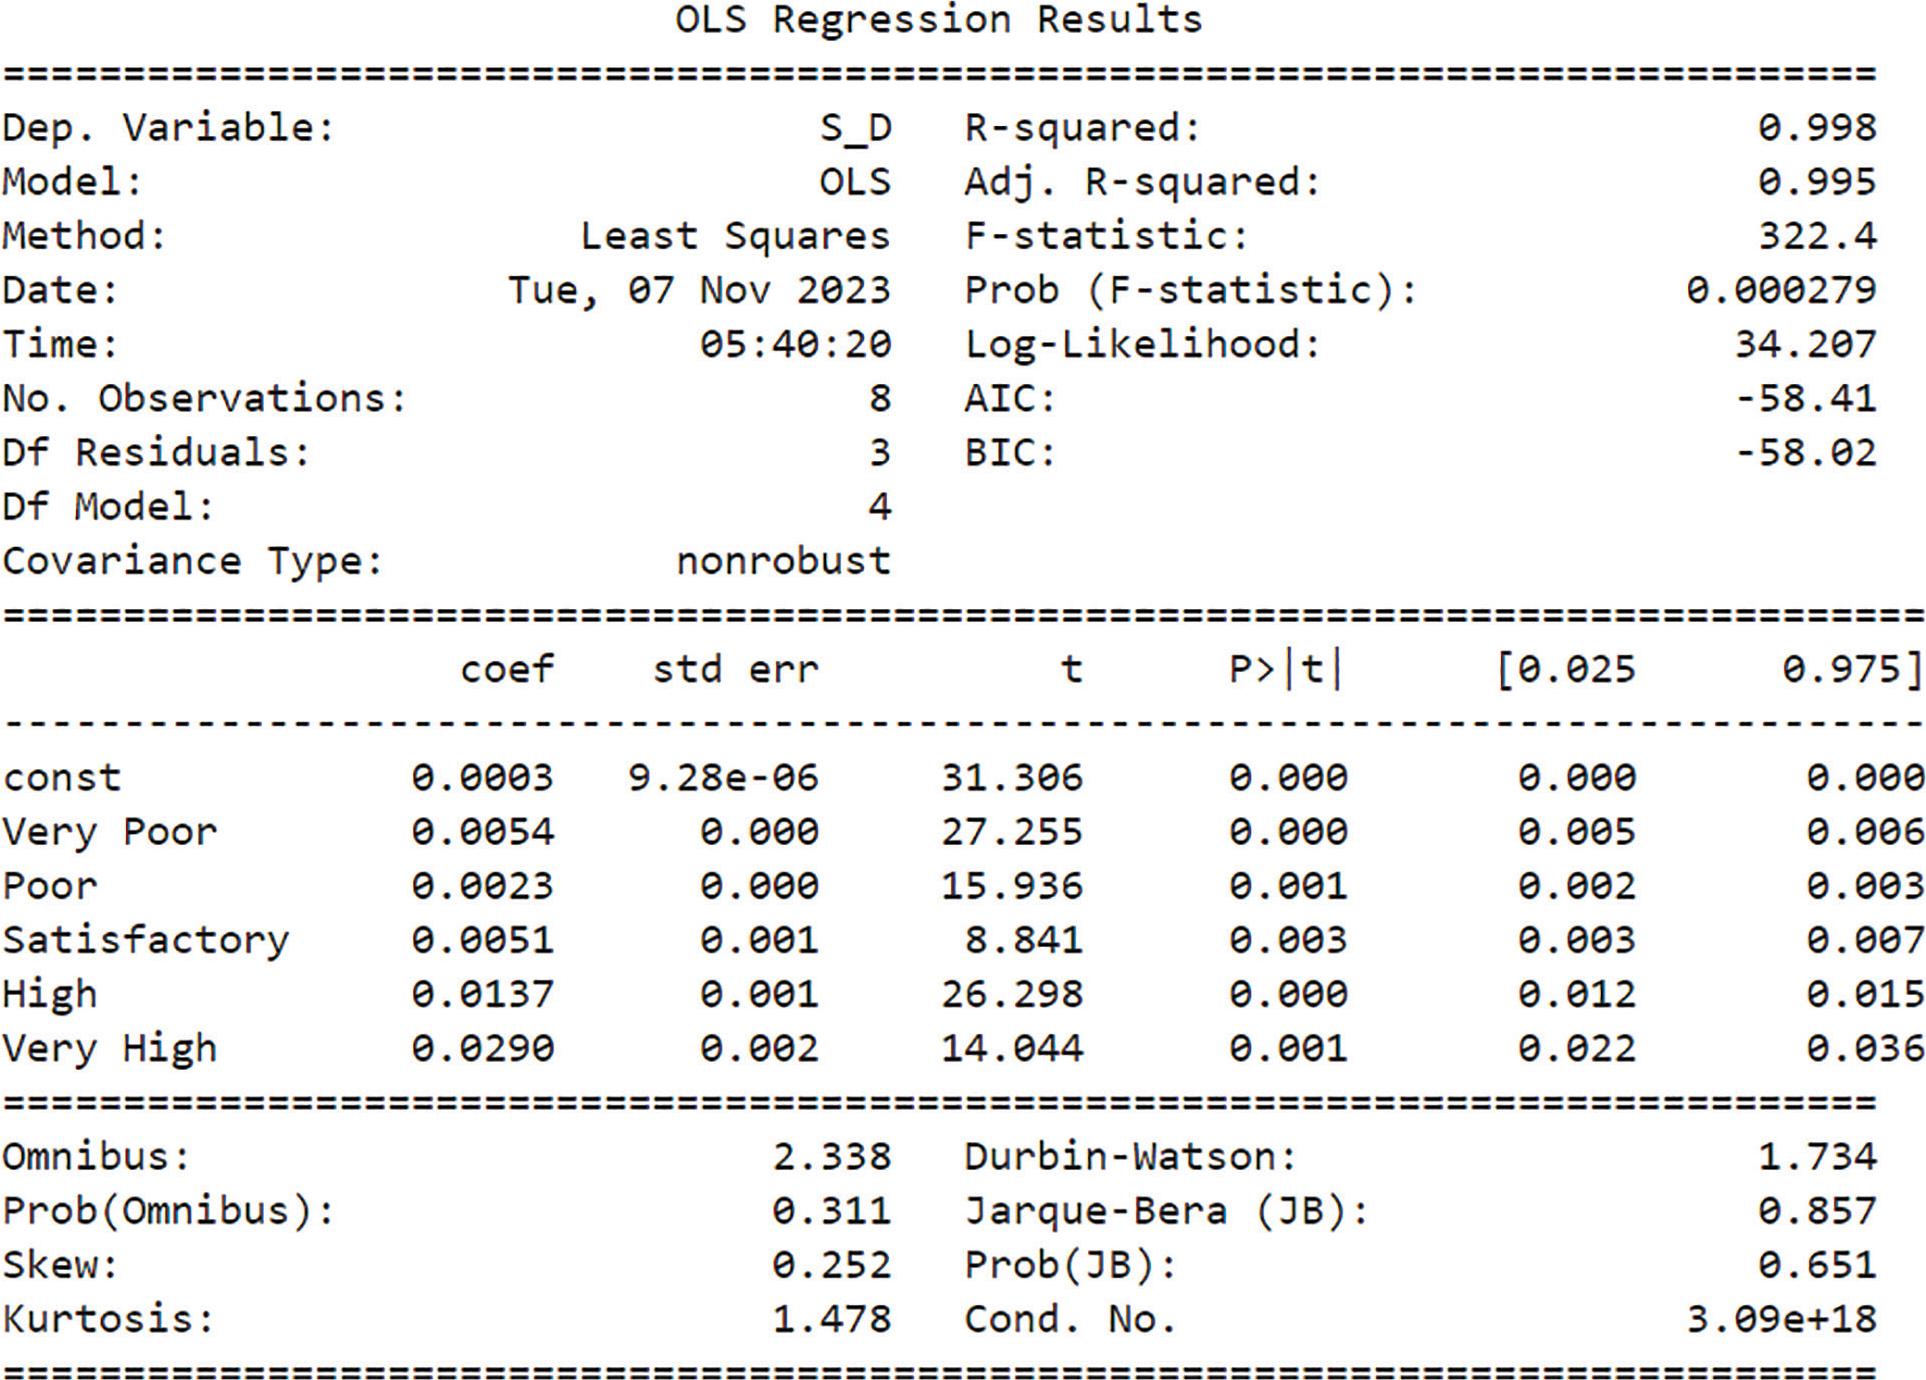
OLS regression results for SD. JB, Jarque-Bera; OLS, ordinary least square; SD, standard deviation.
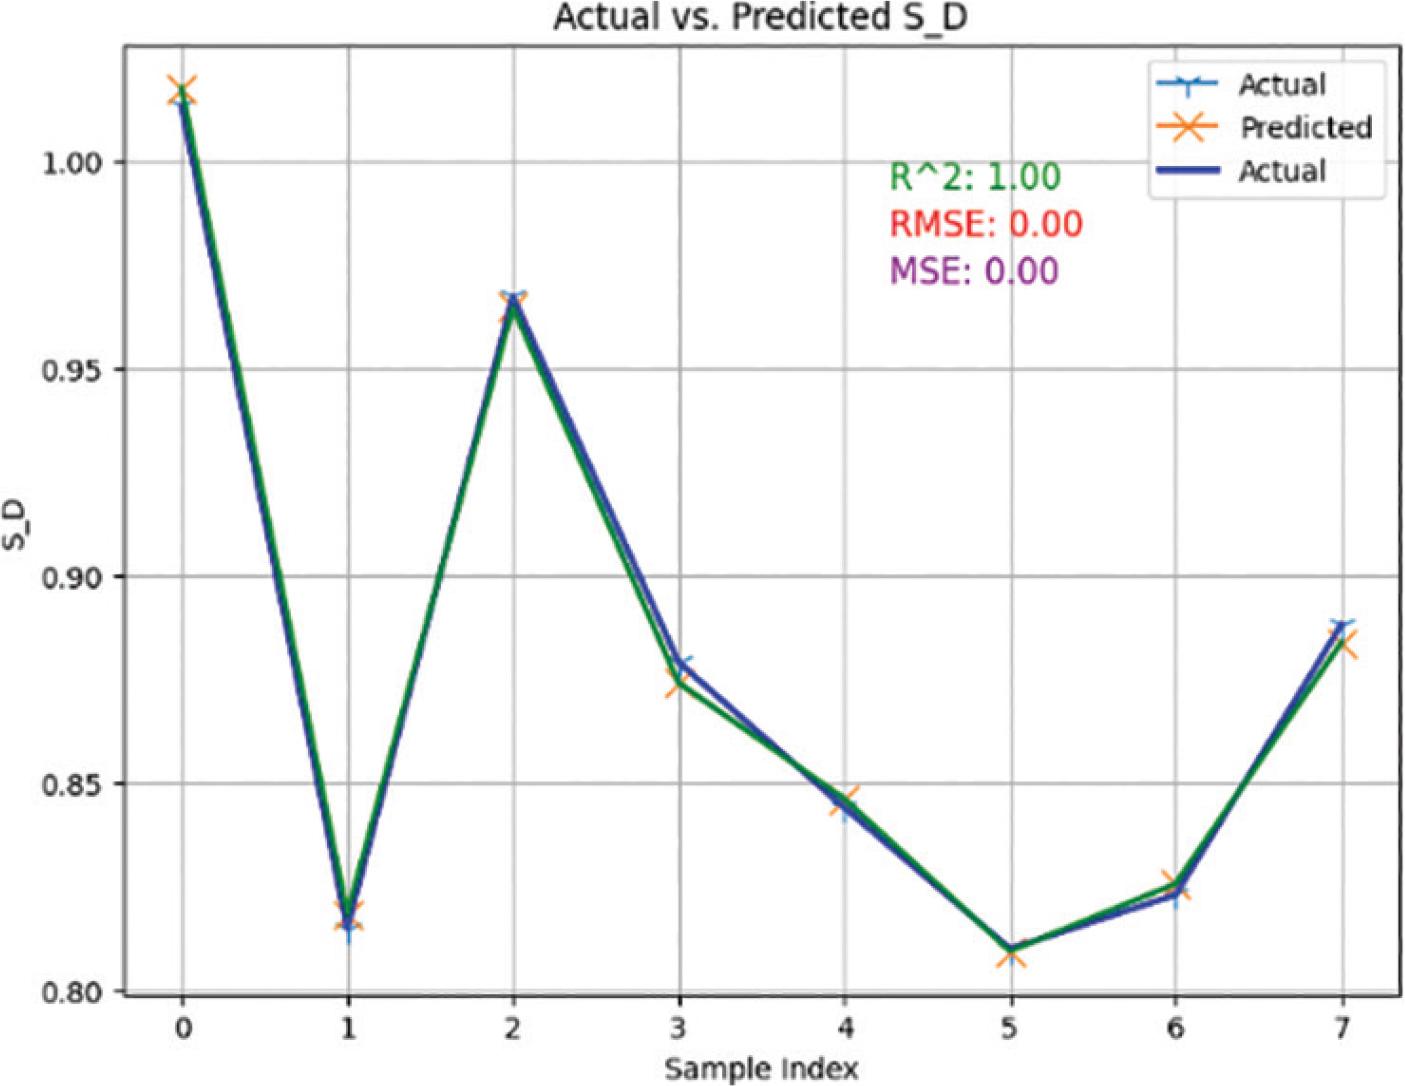
Actual vs prediction graph for OLS regression results for SD. OLS, ordinary least square; SD, standard deviation.
The results for the ‘variance’ output has an R2 of 0.999, and the dependent variable’s variance is explained by the model 99.9% of the time as shown in Figure 9. Additionally, the model’s adjusted R2 value of 0.999 is very high, suggesting that the data fit the model well. The probability value of 1,249 is <0.0001, and the F-statistic is extremely high. This suggests that there is a statistical significance in the model. The OLS regression results show that, with the exception of the ‘Poor’ variable, all of the variables that are independent are statistically significant and that the model fits the data well. The data, however, exhibit a high degree of multicollinearity, which can make it challenging to understand the significance of each individual coefficient. The actual vs prediction graph is shown in Figure 10.
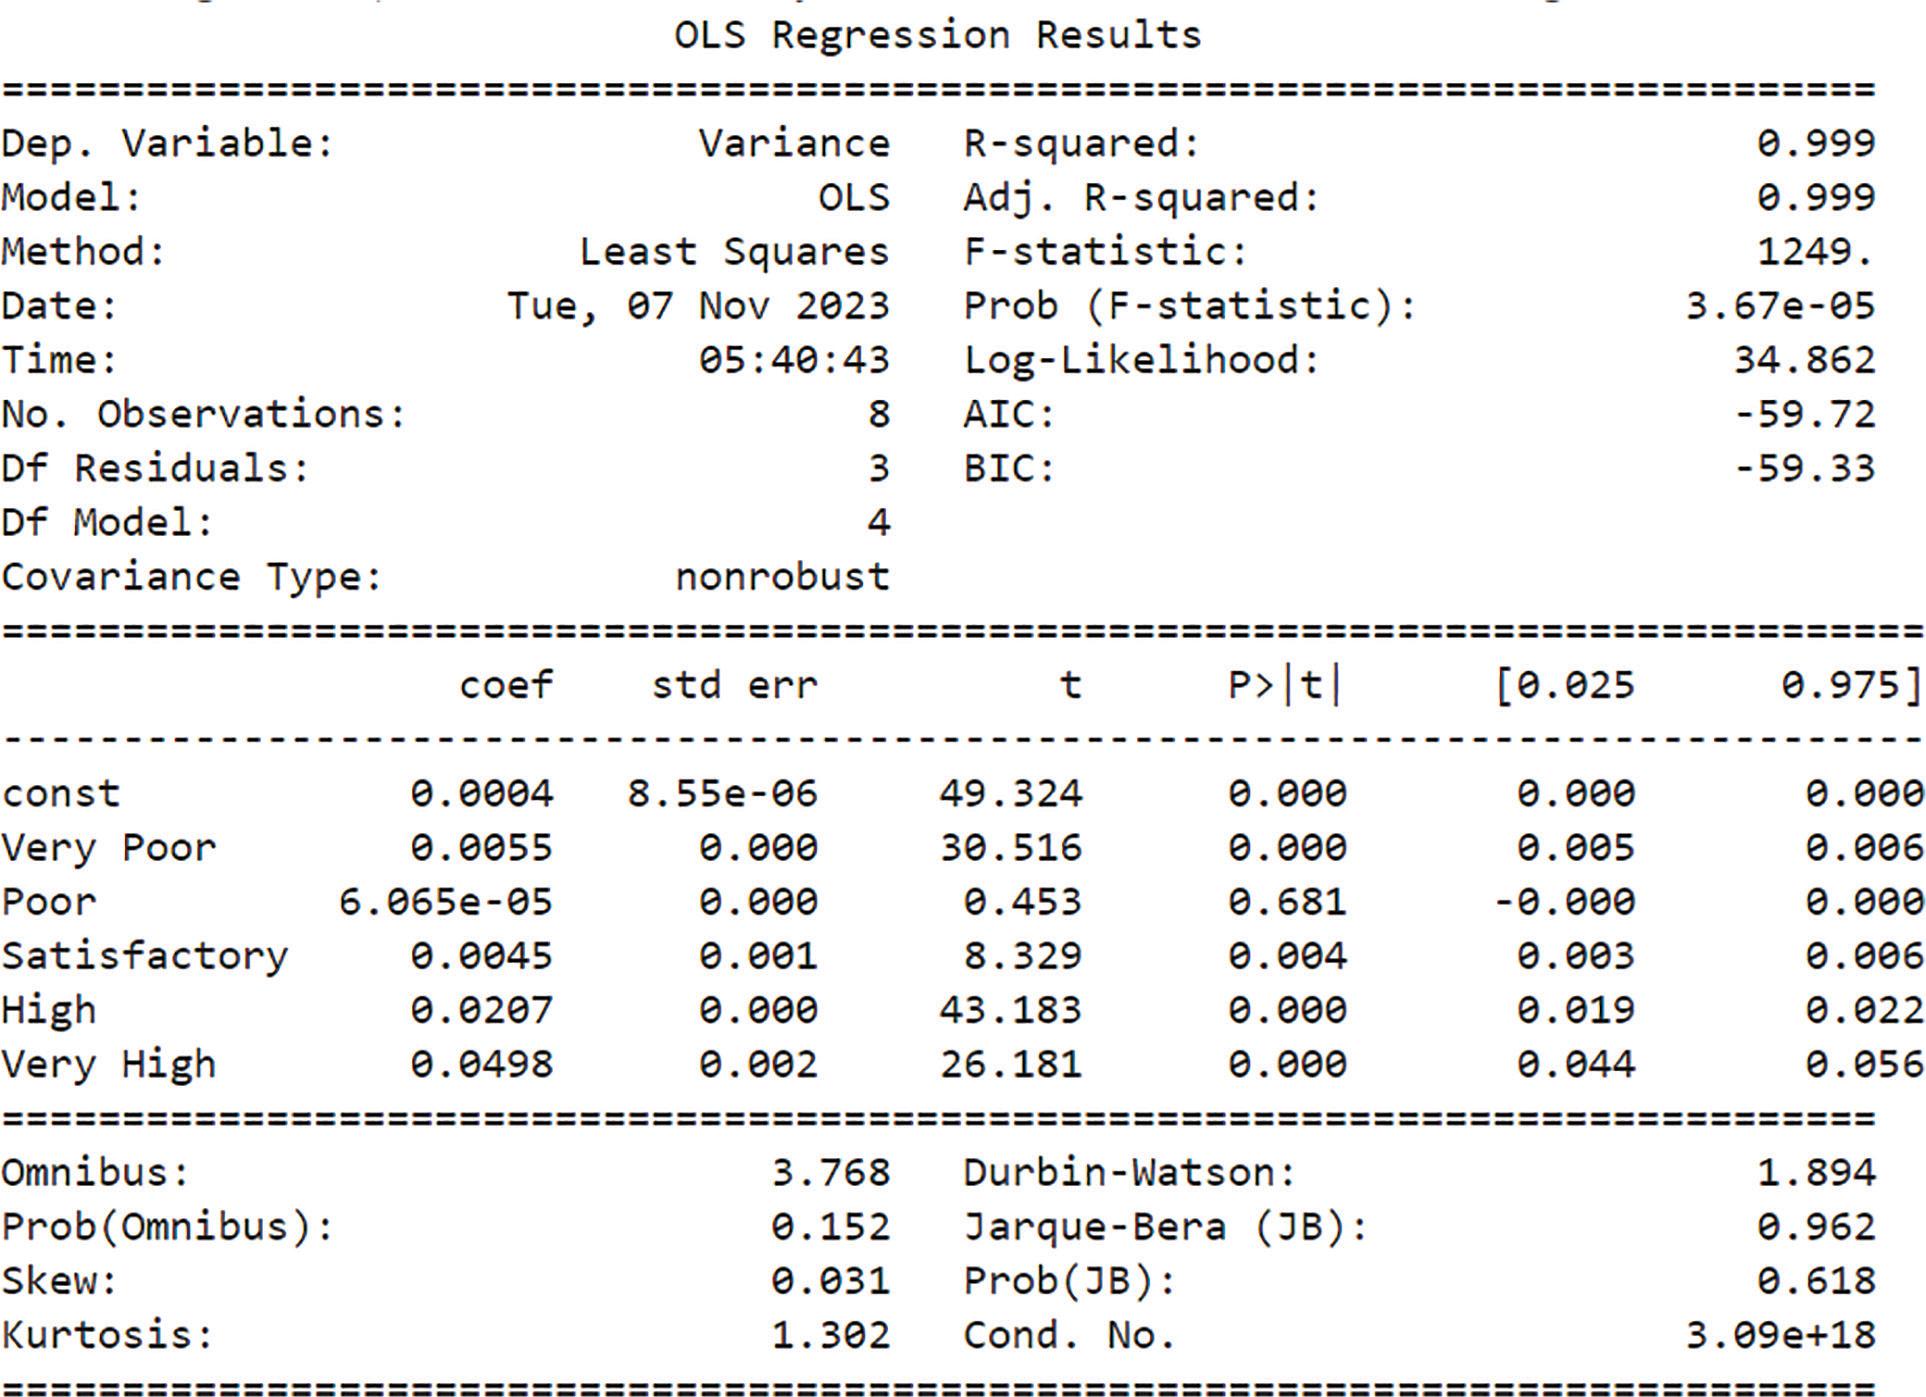
OLS regression results for variance. JB, Jarque-Bera; OLS, ordinary least square.
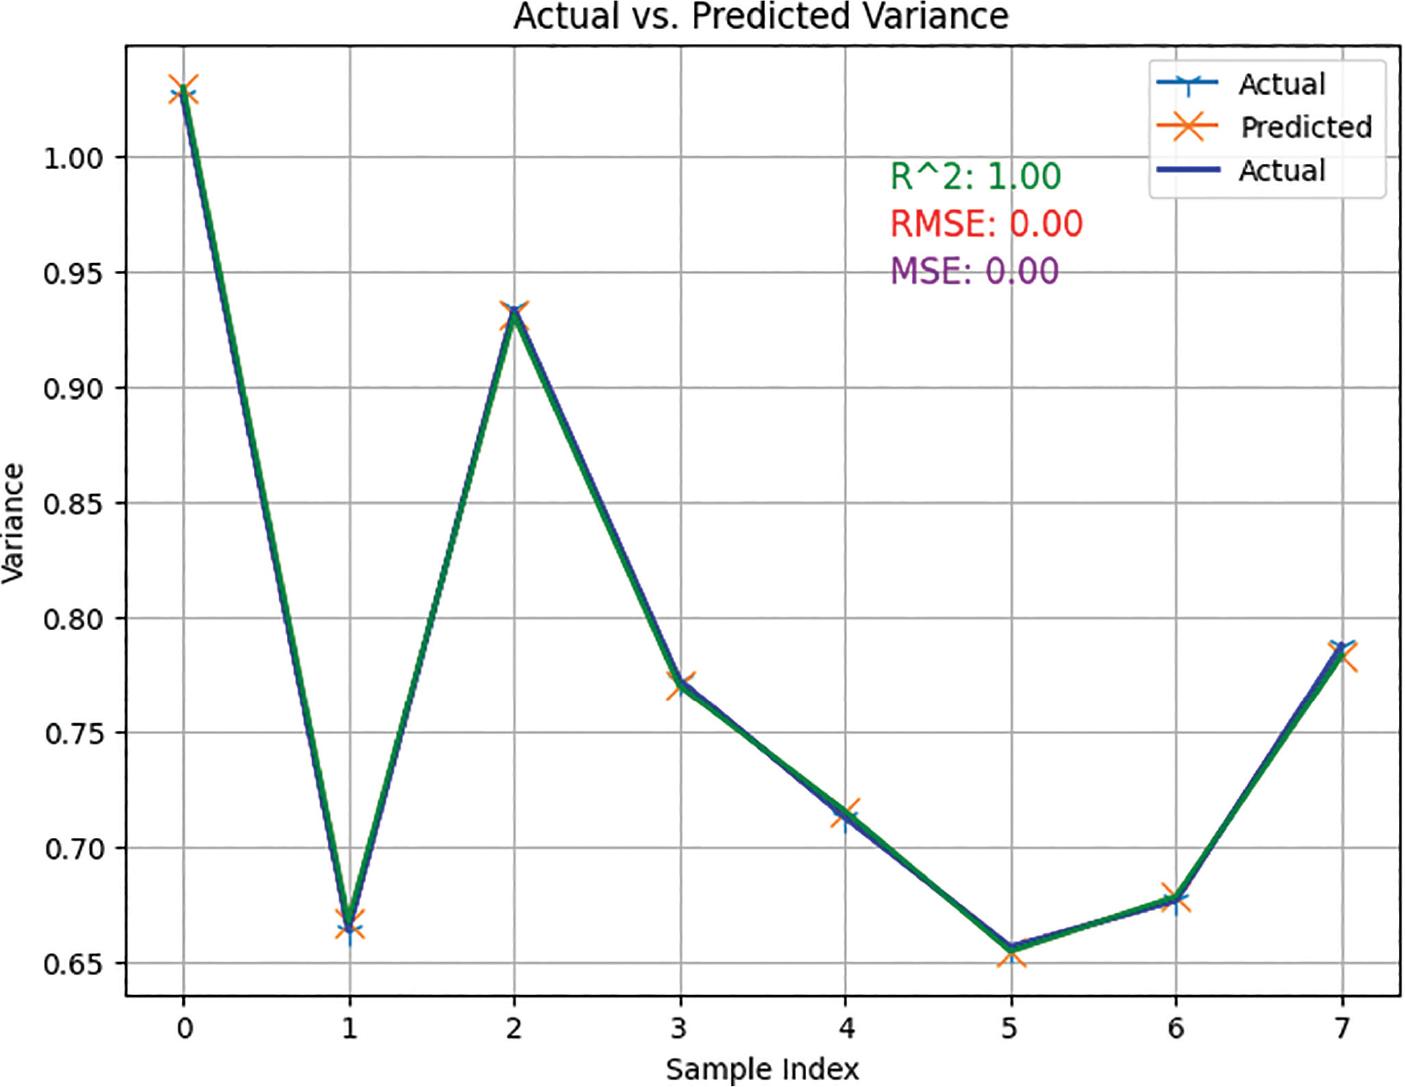
Actual vs prediction graph for OLS regression results for variance. OLS, ordinary least square.
The above predictions indicate that the stakeholders in the construction industry are unlikely to use ADR. Although mostly agreeing about the benefits of ADR, there are misconceptions about the working and applicability. Companies may lack the necessary resources (time, money and expertise) to develop and implement effective ADR plans. Also, there is an absence of clear procedures and frameworks for ADR integration into existing workflows. Initial attitudes towards ADR can be shaped by past experiences, leading to scepticism. Resistance to change and reluctance to adopt new methods due to comfort with traditional practices also makes it hard for ADR usage. Given this trend, challenges in implementing ADR for mitigating disputes will persist unless the stakeholders are thoroughly educated about the advantages.
From the results, it is evident that there is a significant lack of understanding with respect to ADR in each of the stakeholder groups.
The data reflect that there is room for improvement in various aspects of ADR implementation. While there is a moderate level of awareness and knowledge about ADR concepts, its actual utilisation and motivation for adoption appear to be relatively low. Associations and experienced individuals can play a more active role in promoting ADR, and the quality of training and procedures can be enhanced. To promote ADR successfully, there should be a coordinated effort to raise awareness, provide better training and foster a supportive environment for ADR adoption within the respective working community. Figure 11 shows the column chart obtained from interpreting the Likert scale values attributed under the knowledge category.
Knowledge of ADR among the respective working community assesses the extent to which the working community is informed about ADR methods. The mean value of 2.07 suggests that there is a moderate level of knowledge within the community.
Usage of ADR among the respective working community evaluates the actual utilisation of ADR methods. The mean value of 1.76 indicates a relatively low level of ADR adoption, which may suggest a need for increased awareness or incentives.
Motivation by experienced people for the usage explores whether experienced individuals are motivating others to embrace ADR practices. The mean value of 2.09 suggests that while there is some motivation, it is not very high, and further encouragement may be required.
Commitment of associations for implementing ADR assesses the level of commitment from associations in promoting ADR practices. The mean value of 1.98 indicates a moderate level of commitment, indicating room for potential improvement in association involvement.
Level of training given by associations for ADR examines the effectiveness of training provided. The mean value of 1.91 suggests that the quality of training may need improvement to enhance ADR knowledge and skills.
Developing relationships for ADR implementation gauges the effort put into building relationships that support ADR implementation. The mean value of 1.96 indicates that there is some effort in this regard, but it could be strengthened for more successful ADR adoption.
Awareness of ADR concepts among the respective working community evaluates the degree of awareness regarding ADR. The mean value of 1.92 indicates a moderate level of awareness but suggests a need for more education on ADR.
Procedures to enhance the ADR approach focuses on the existence and effectiveness of procedures aimed at improving the ADR approach. The mean value of 2.04 suggests that there are some procedures in place, but they may need refinement for better results.
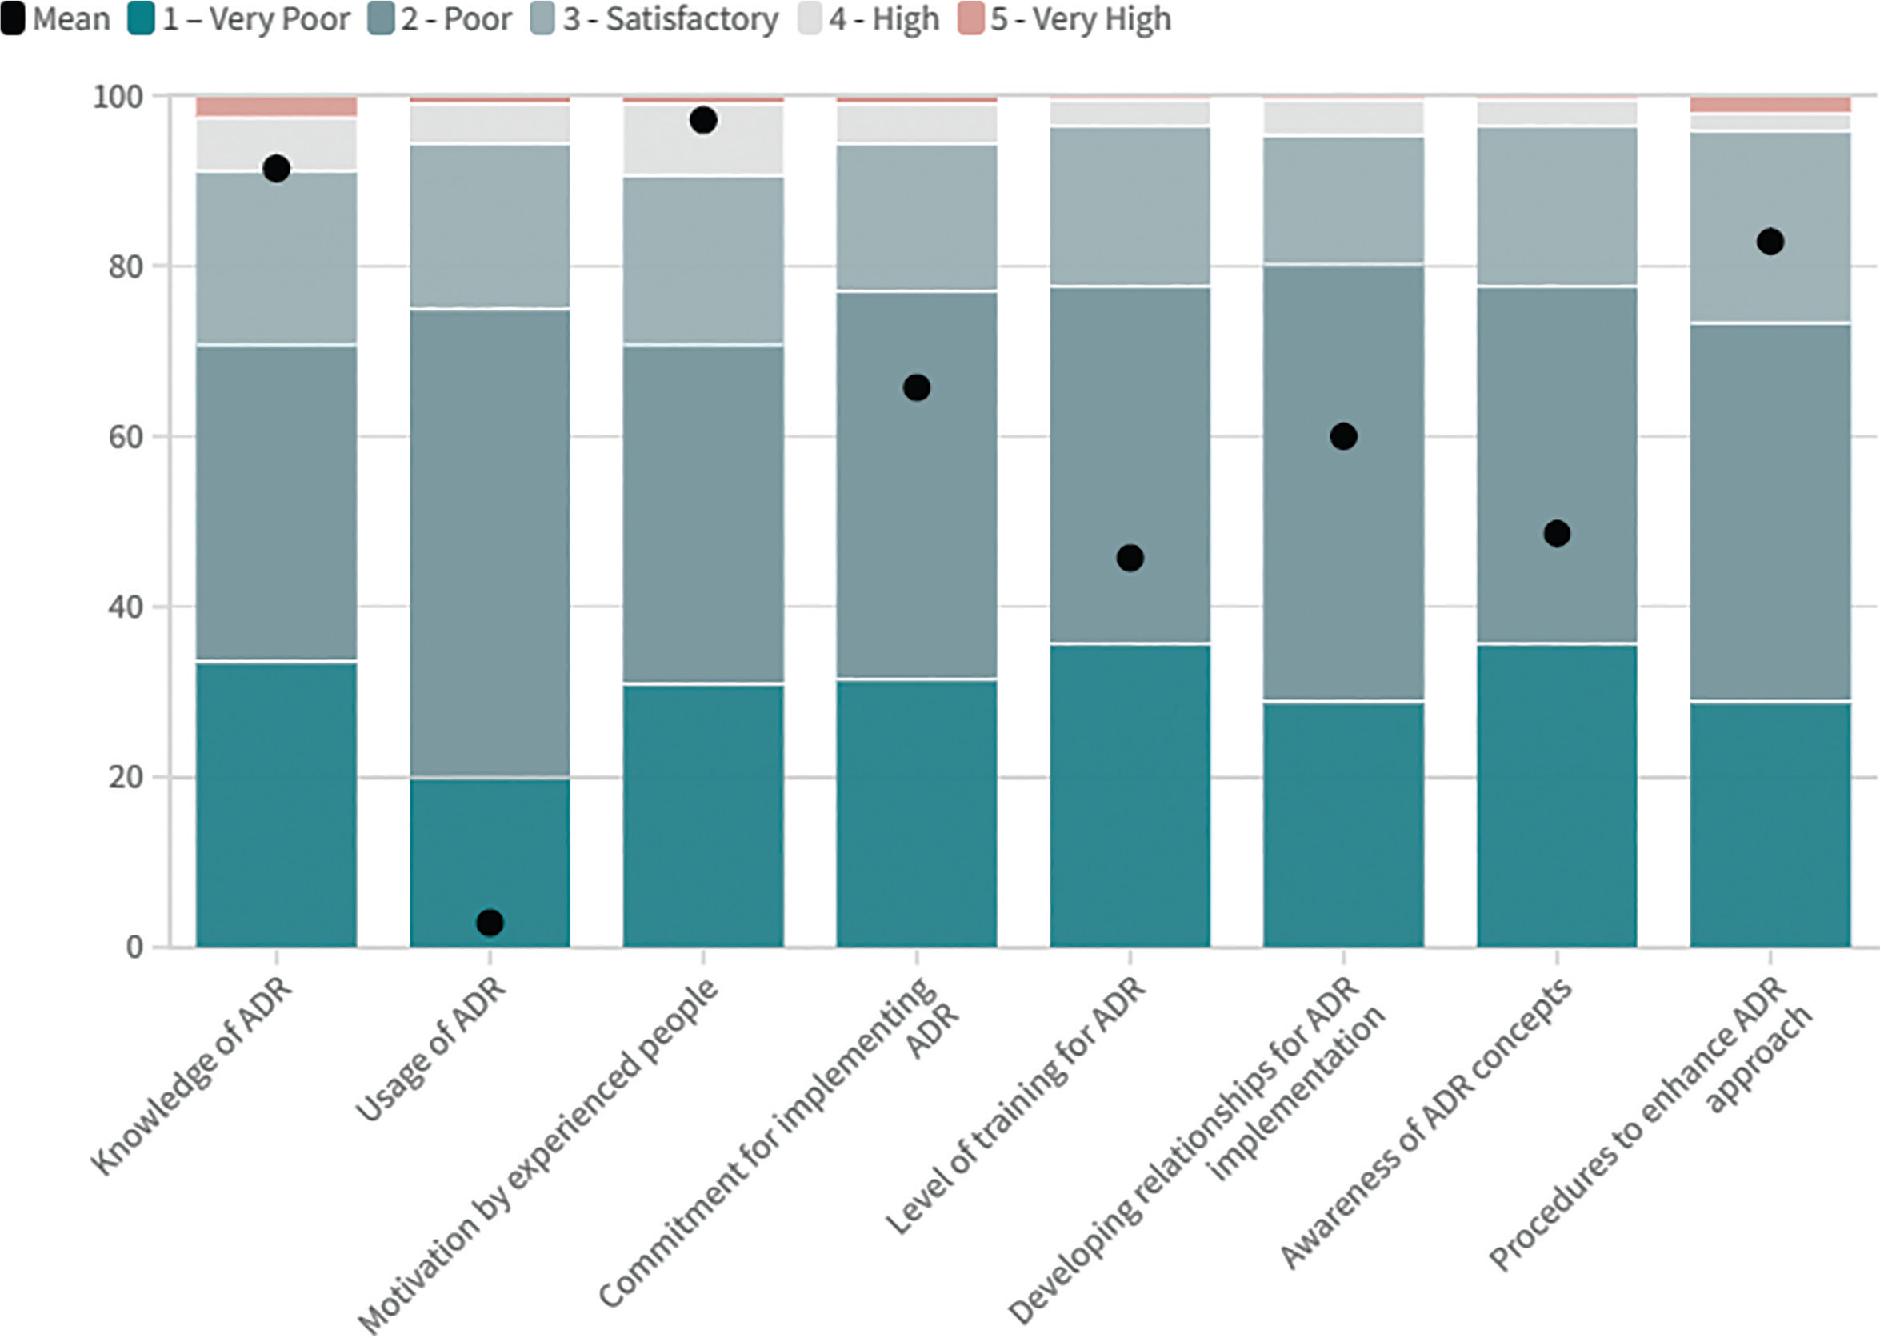
Column chart of Likert scale for the attributes of knowledge and understanding of ADR. ADR, alternative dispute resolution.
From the mean scores, it is clear that stakeholders generally acknowledge the presence of barriers and challenges in ADR implementation. These challenges range from awareness and education about ADR to issues related to planning, communication and flexibility in adopting new processes. Addressing these concerns through targeted awareness campaigns, improved education and training, better planning and enhanced communication strategies can help pave the way for more effective ADR implementation. Additionally, it is important to recognise that ADR is not necessarily seen as a threat to justice, but rather as a potentially valuable tool for resolving disputes efficiently and amicably. Figure 12 shows the column chart obtained from interpreting the Likert scale values attributed under the barrier category.
Lack of ADR awareness among the respective working community assesses whether stakeholders perceive a lack of awareness about ADR. The mean score of 3.88 suggests that there is moderate agreement that awareness is lacking, indicating that some stakeholders believe that ADR methods are not well-understood or utilised in their professional spheres.
Inadequate planning in implementing ADR, with a mean score of 4.06, implies that stakeholders generally agree that there are deficiencies in the planning process when it comes to implementing ADR. This suggests that stakeholders may believe that better planning is needed to ensure the successful implementation of ADR mechanisms.
First impression and perception of the disputed parties for effective dispute resolution. The mean score of 3.81 indicates moderate agreement, suggesting that stakeholders recognise the importance of parties’ initial attitudes and perceptions in ADR success.
Flexibility to adapt new resolution processes assesses whether stakeholders believe that there is adequate flexibility in adopting new resolution processes, such as ADR. The mean score of 3.23 indicates a moderate disagreement, suggesting that some stakeholders may feel that there is room for improvement in terms of being adaptable to new dispute resolution methods.
A perception of ‘non-binding nature of ADR a threat to justice’. The low mean score of 2.38 indicates that stakeholders tend to disagree with this perception, suggesting that they may see ADR as complementary rather than adversarial to the pursuit of justice.
Long implementation time required investigates whether stakeholders believe that ADR implementation is time-consuming. The mean score of 3.46 suggests that there is a moderate level of agreement that ADR implementation can be time-intensive, which may be a concern for some stakeholders.
Improper education of ADR assesses whether stakeholders feel that there is a lack of proper education and training related to ADR. The mean score of 3.78 indicates moderate agreement, implying that some stakeholders may believe that there is room for improvement in educating individuals about ADR methods.
Lack of proper communication explores whether stakeholders perceive a lack of effective communication in the context of ADR. The mean score of 4.16 indicates that there is a moderate level of agreement that proper communication is lacking, suggesting that stakeholders may view improved communication as essential for successful ADR implementation.
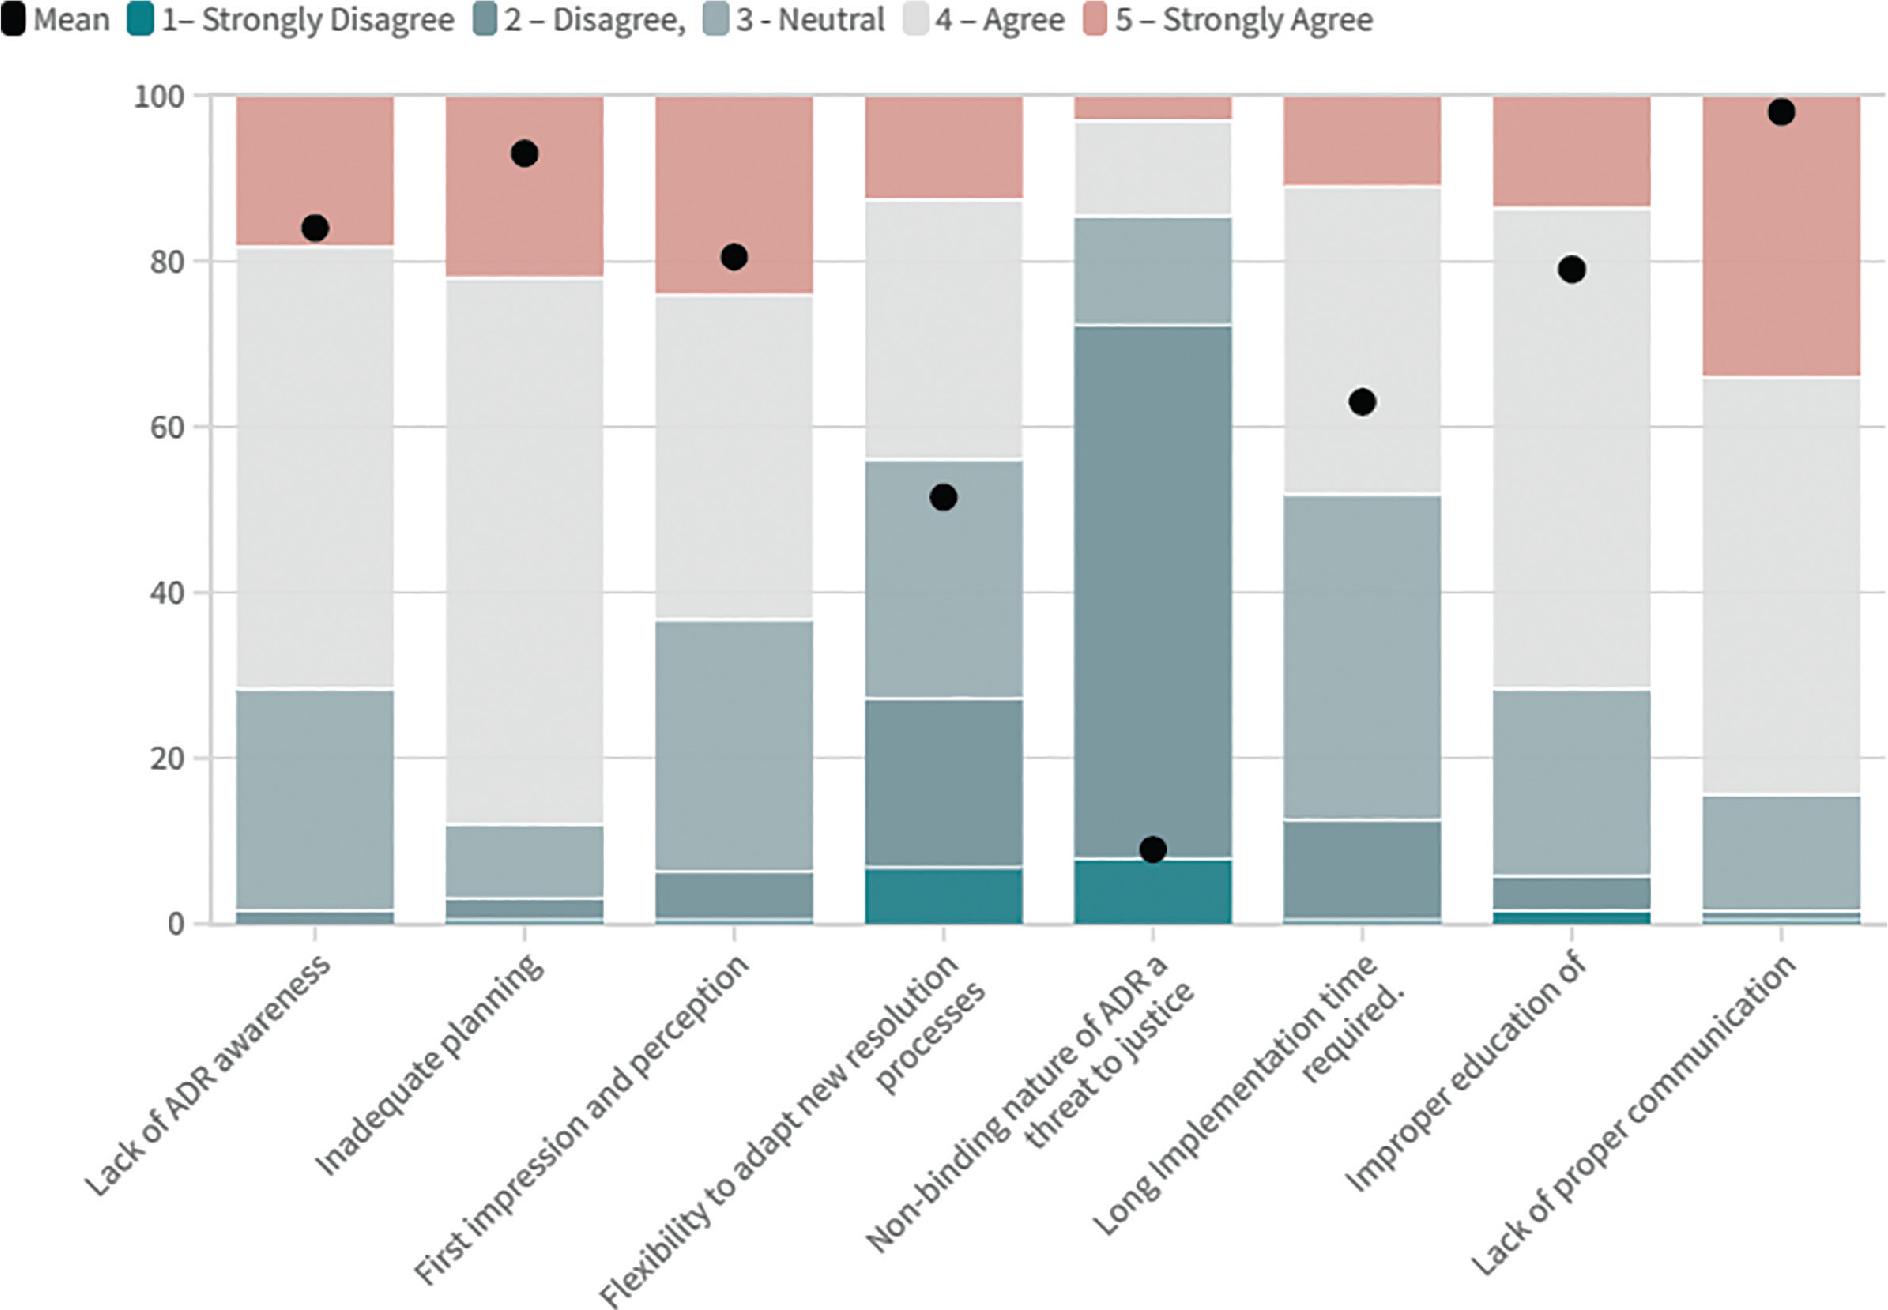
Column chart of Likert scale for the attributes of barriers of ADR. ADR, alternative dispute resolution.
The mean scores for all six statements related to the advantages of ADR are relatively high, indicating that the stakeholders have a positive perspective on ADR as an effective and efficient method of dispute resolution. They value its speed, cost-effectiveness, ability to maintain relationships and privacy protection. However, the slightly lower mean score for the statement about mutually consented decisions suggests that there may be some variability in how ADR processes are perceived in terms of achieving full consensus. Overall, these positive perceptions of ADR aid for its effective implementation and use as a dispute resolution mechanism. Figure 13 shows the column chart obtained from interpreting the Likert scale values attributed under the advantage category.
ADR gives quicker solutions (Mean: 4.13): Participants generally agreed that ADR offers a faster resolution to disputes compared to traditional litigation. This suggests that stakeholders perceive ADR as an efficient way to resolve conflicts promptly, which can save both time and resources.
ADR is economical compared to litigation (Mean: 4.17): Respondents strongly agreed that ADR is a cost-effective alternative to litigation. This perception aligns with the idea that ADR can significantly reduce legal expenses, such as attorney fees and court costs, making it an attractive option for dispute resolution.
ADR provides efficient and effective results (Mean: 4.15): Stakeholders generally believe that ADR is an efficient and effective means of resolving disputes. This implies that ADR methods are seen as reliable in delivering satisfactory outcomes, further supporting their use in conflict resolution.
ADR maintains the relationship among disputed parties (Mean: 4.15): Respondents indicated that ADR helps preserve relationships between parties involved in disputes. This is a key advantage of ADR as it can foster cooperation and prevent the escalation of conflicts, which is often not the case in adversarial litigation.
ADR protects the privacy of the disputed parties (Mean: 4.10): Participants generally agreed that ADR safeguards the privacy of those involved in disputes. This reflects an understanding that ADR proceedings are typically confidential, which can encourage parties to be more open and forthcoming in resolving their issues.
ADR gives mutually consented decisions (Mean: 4.00): While still generally positive, respondents were slightly less enthusiastic about the idea that ADR always results in mutually consented decisions. This suggests that while ADR promotes cooperation, there may still be cases where parties may not fully agree on the outcome.
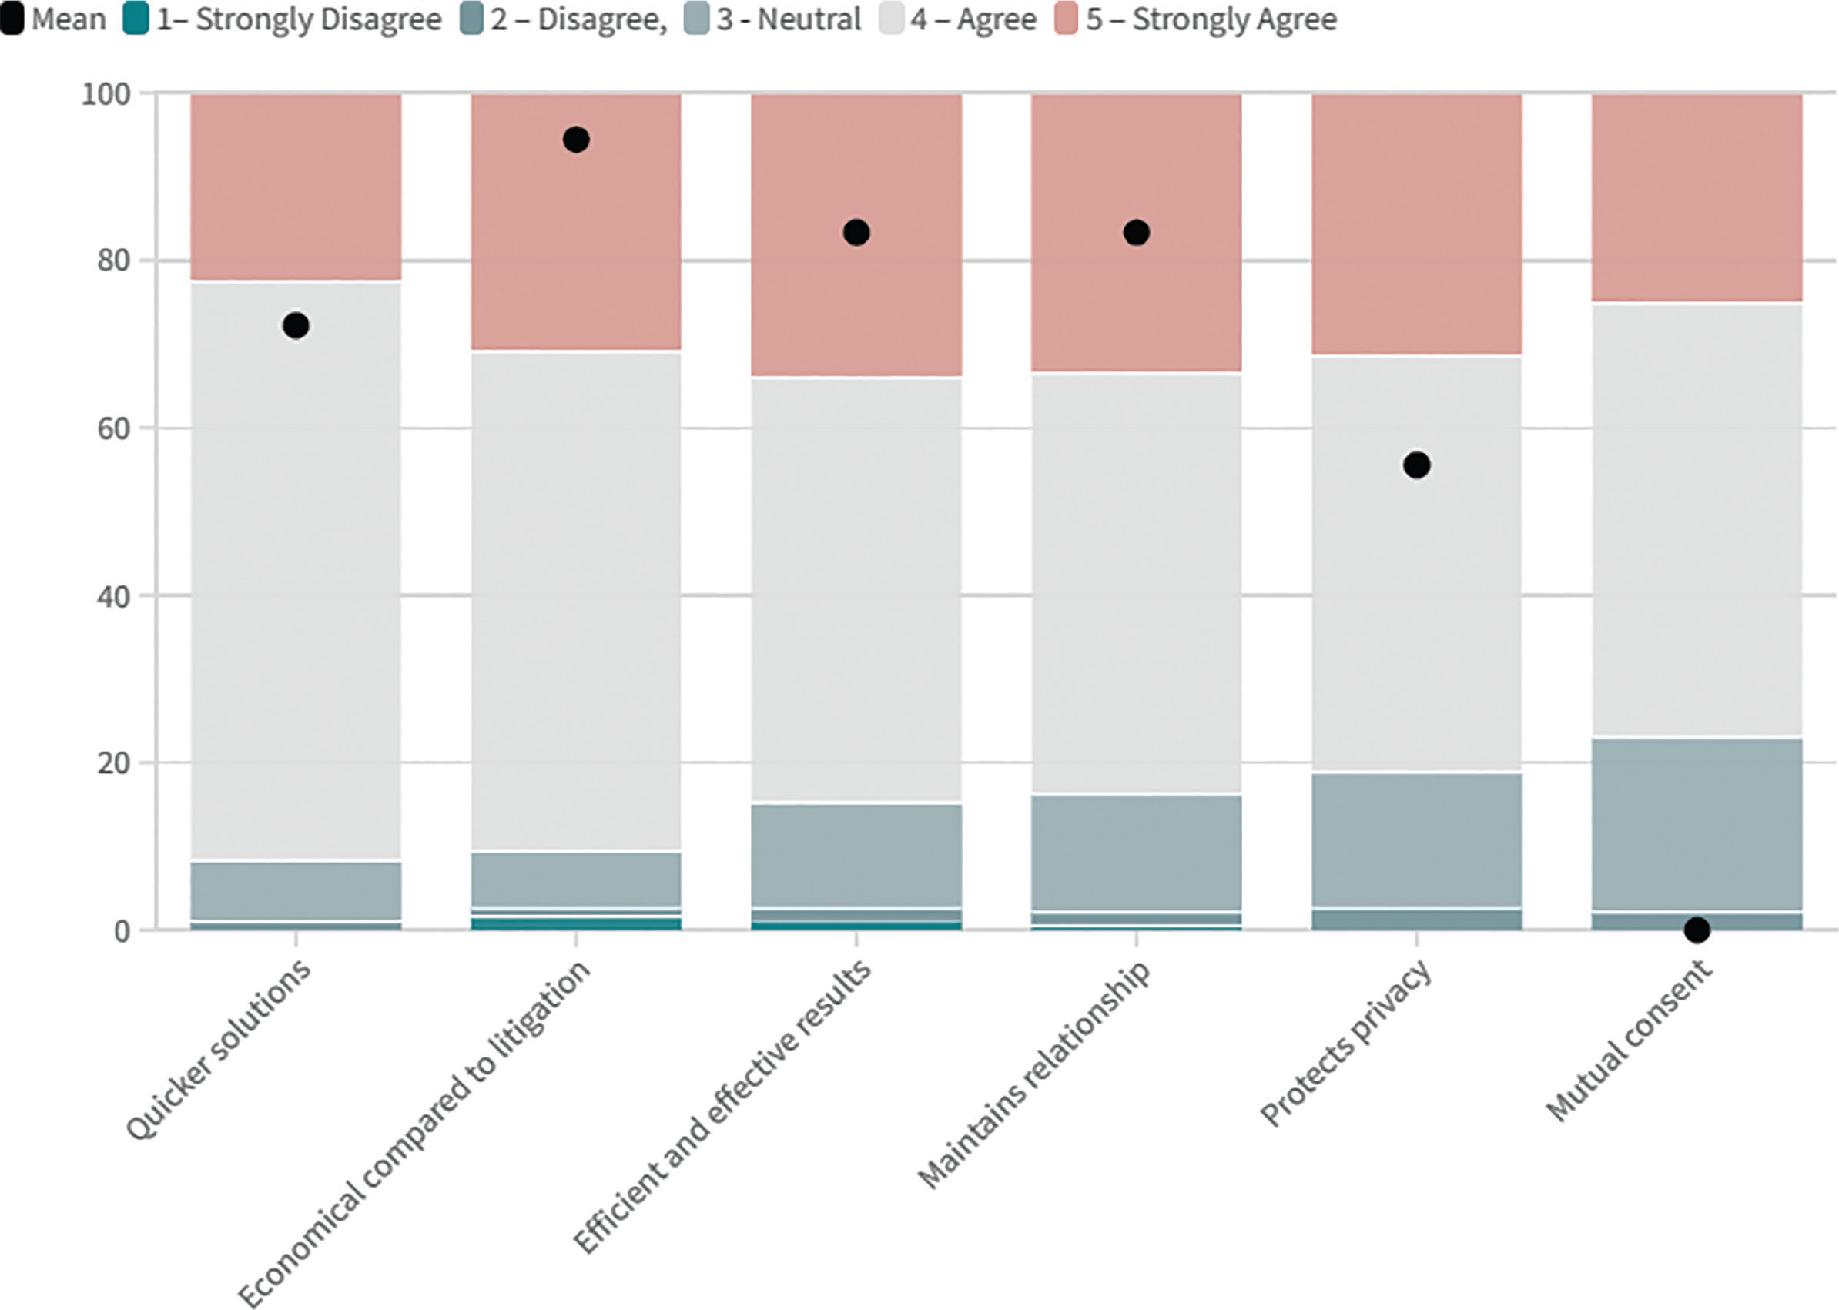
Column chart of Likert scale for the attributes of advantages of ADR. ADR, alternative dispute resolution.
The moderate knowledge and low usage of ADR methods in the construction industry indicate a potential for increased disputes and inefficiencies due to reliance on traditional, potentially more adversarial methods. Developing relationships to support ADR implementation is weak, which could hinder collaboration for dispute resolution. While some frameworks are in place, they lack the necessary strength and clarity to be genuinely effective. Without significant improvements in these areas, the construction industry may continue to face challenges in managing and resolving disputes, potentially leading to higher costs and project delays. Improving flexibility, communication and perceptions of ADR, while addressing concerns about time intensiveness, could lead to more productive and widespread adoption of ADR methods. Establishing dedicated teams or departments within organisations to focus on ADR planning and implementation might benefit the industry along with allocating funds and resources to support ADR initiatives and training programmes.
The perception of stakeholders in the construction industry regarding the kind of assistance required from AI in construction dispute resolution provides valuable insights into the potential applications of AI in addressing common challenges in the sector.
This reflects a strong emphasis on leveraging AI to enhance data analysis and pattern recognition. Construction projects generate vast amounts of data, including project documents, communications, schedules and financial records. AI can help stakeholders by processing and analysing these data to identify recurring patterns and potential sources of disputes. AI-driven analytics can help stakeholders make informed decisions and even predict potential disputes, allowing them to take proactive measures to prevent conflicts.
Virtual mediation services involve using AI-powered platforms to facilitate dispute resolution discussions, negotiations and mediation sessions. This option acknowledges the need for more efficient and accessible methods for resolving disputes. AI can provide a neutral, automated platform for communication, document sharing and conflict resolution, reducing the need for in-person meetings and streamlining the process. This can save time and resources for all parties involved.
Automating the arbitration process suggests using AI to handle various administrative tasks associated with dispute resolution, such as scheduling, document management and communication with stakeholders. By automating these routine tasks, AI can help expedite the arbitration process, reduce human errors and ensure that the proceedings are more efficient and transparent. This option may also involve AI systems acting as arbitrators or assisting human arbitrators in making decisions based on relevant legal precedents and data analysis.
Multiple aspects of AI can be beneficial in construction dispute resolution. Combining data analysis, virtual mediation and process automation can provide a comprehensive solution that addresses various challenges and needs in the construction industry. The preference for ‘All of the above’ by 14% of respondents highlights the potential for integrated AI solutions that encompass multiple facets of dispute resolution, leading to more effective and efficient outcomes for all parties involved in the construction industry.
The survey results indicate that stakeholders acknowledge the diverse roles lawyers play in ADR for construction disputes. The specific roles lawyers take on can vary based on the unique needs of each dispute and the preferences of the parties involved. It is important for lawyers to adapt to the situation, balancing their advisory, negotiation, and advocacy roles, as well as being prepared to participate in various ADR methods, to effectively assist their clients in resolving construction disputes. The choice of which role a lawyer takes on can significantly impact the success of the ADR process and the ultimate resolution of the dispute
Providing legal advice is a fundamental role of lawyers in ADR. Lawyers can help parties understand their rights, responsibilities and potential legal implications. They can also offer guidance on the best course of action, potential outcomes and strategies for resolving disputes through ADR methods such as mediation or arbitration. This role is crucial in empowering parties to make informed decisions during the dispute resolution process.
Representing parties in negotiations is a common role for lawyers in ADR, especially in construction disputes. Lawyers can use their legal expertise to advocate for their clients’ interests and negotiate on their behalf. This may involve drafting settlement agreements, reviewing proposed terms and ensuring that the final resolution aligns with their client’s legal rights and best interests. Effective negotiation skills are essential for achieving successful outcomes in ADR.
In construction dispute resolution, arbitration is often used to settle complex issues. Lawyers play a crucial role in this process by preparing and presenting evidence on behalf of their clients. This includes gathering relevant documents, interviewing witnesses and presenting a compelling case during the arbitration proceedings. Lawyers’ skills in evidence presentation and argumentation are invaluable in ensuring a fair and just resolution.
A significant portion of stakeholders recognises that lawyers may perform all the mentioned roles. In fact, lawyers often have a multifaceted role in ADR in construction disputes. They may start by providing legal advice, then transition into representing their clients in negotiations and ultimately, if necessary, prepare and present evidence in arbitration or other ADR processes. Their involvement can encompass all these aspects as they work towards a comprehensive resolution.
For the widespread implementation of ADR in the construction industry, professionals from a legal background need to play an active role in creating awareness. Mediation and arbitration centres are needed in major cities, and through them, it has to be spread across the towns and villages as well. Since ADR is a concept that can be easily incorporated, training centres with professional help can be useful in teaching the concept to local bodies to resolve disputes among themselves. LOKADALAT is already being used by the judiciary to mitigate disputes amicably. However, often cases that are filed in the courts are transferred to LOKADALATS rather than cases being filed directly into them. Awareness of the advantages must be conveyed among stakeholders to enhance the usage of LOKADALATS and other similar ADR-utilising organisations.
The dataset used for this study has been gathered from areas where the usage of ADR is almost negligible. Having a data that can be obtained from areas where significant ADR implementation might provide a comparative perspective of how it eases the dispute resolution. A diverse and large data set can be useful in accurately predicting the effects of ADR usage that could proactively motivate people to opt for this concept, which can be incorporated in future studies.
ADR is a less-opted mechanism in dispute resolution, especially in the construction industry. It provides better and quicker results than traditional litigation, provided people in the industry are sufficiently aware of it. This research focussed on understanding the perception of various stakeholders regarding ADR.
The correlation matrix revealed a significant positive correlation among the descriptive statistics and a slight negative correlation among the Likert scale ratings of poor and satisfactory.
One-way ANOVA study gave insights that the mean values of the groups for SD, Very High, and Poor differ significantly from one another. For High, there is a slightly substantial distinction between the group means. There is no discernible difference between the group means for Very Poor, Satisfactory and Mean.
OLS regression results for ‘mean’ and ‘standard deviation’ indicate that all of the independent variables are statistically significant, and the model fits the data well. The results of the LS regression show that, except the ‘Poor’ variable, all of the independent variables are statistically significant, and that the model fits the data well. However, there is a high degree of multicollinearity in the data, which can make it difficult to interpret the individual coefficients.
An overall mean value of 1.96 shows a lack of understanding of the ADR concept, which needs to be improved. To promote ADR effectively, stakeholders must coordinate efforts to raise awareness, provide better training and create a supportive environment for adoption.
Stakeholders acknowledge various barriers and challenges in ADR implementation, including awareness, education, planning, communication and flexibility. The mean value for this category was found to be 3.22, which highlights that most of the stakeholders have a neutral opinion about the barriers. Addressing these concerns through awareness campaigns, education, better planning and improved communication strategies can enhance ADR’s effectiveness.
Stakeholders generally view ADR positively, considering it an efficient method of dispute resolution, valuing its speed, cost-effectiveness, relationship maintenance and privacy protection. The mean value for this category was found to be 4.11, which is quite encouraging. However, perceptions about achieving full consensus in ADR processes vary slightly.
Many stakeholders recognise lawyers as playing multiple roles in ADR, including providing legal advice, representing clients in negotiations and preparing and presenting evidence in arbitration. Lawyers’ involvement can encompass these aspects to work towards comprehensive dispute resolution.
A suitable ADR method according to the dispute peculiarity should be adopted. Due to the limited implementation, results showing the efficiency of ADR could not be considered accurate. Combining all the data, efficiency tests and peculiarity of disputes, an enhanced model of an AI incorporated ADR system could possibly be the solution for dispute resolution.
Implementing pilot ADR programmes to demonstrate their functionality and flexibility by offering customisable ADR solutions. ADR mechanisms specific to each project and dispute as required can be developed. Establishing clear and effective communication channels for all parties involved in ADR, along with providing regular updates and soliciting feedback, will ensure transparency and continuous improvement.