
Figure 1
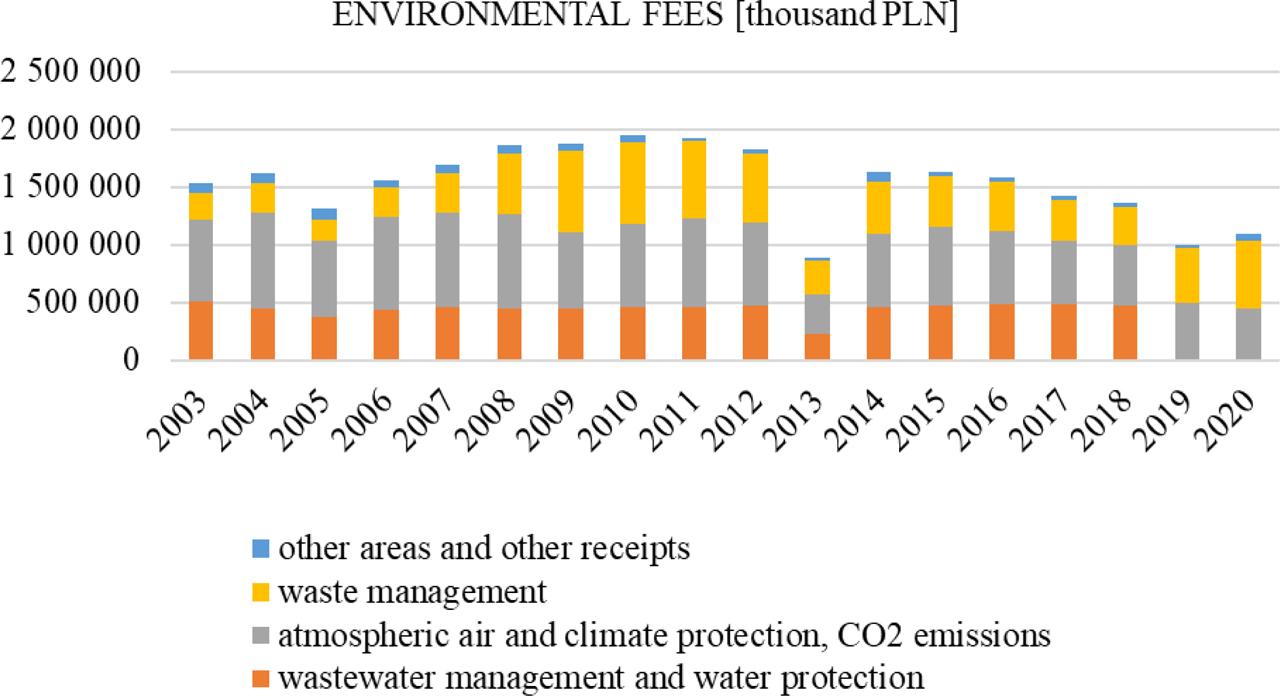
Figure 2
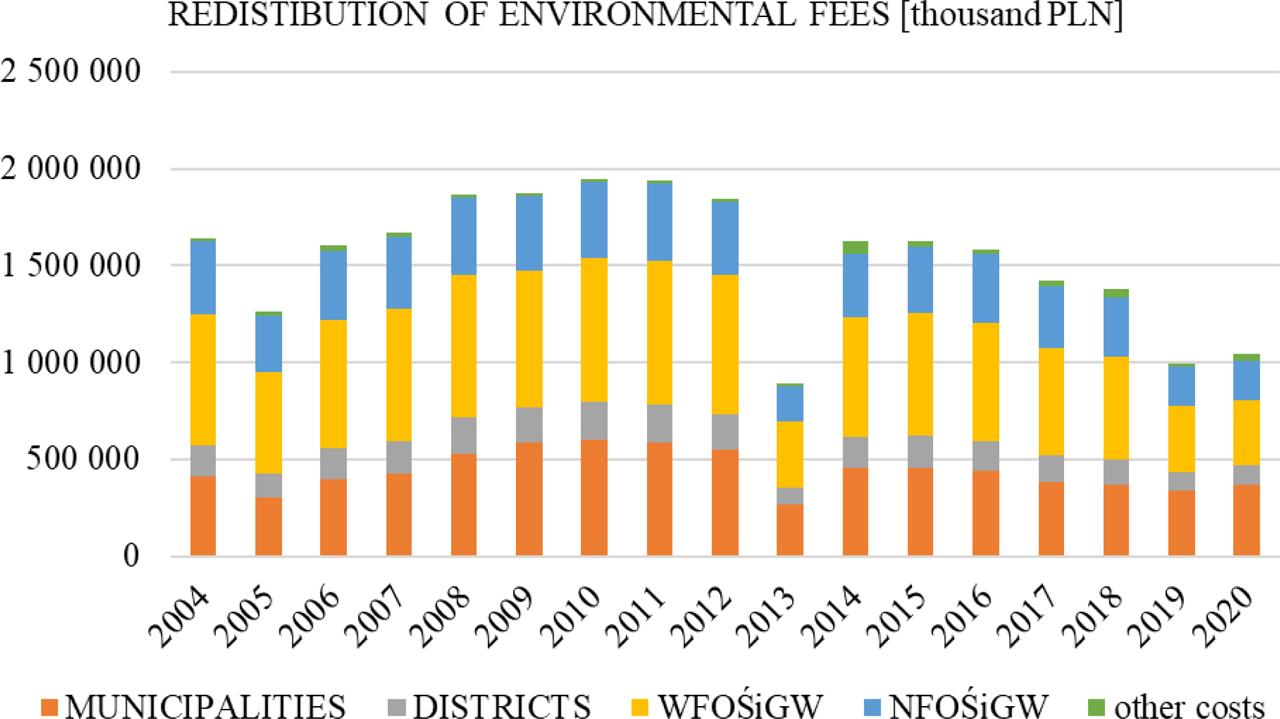
Figure 3
Number of entities [thousand]* in Poland’s system of environmental fees in 2015–2019**
| Year | Overall number of entities including < 100 PLN | Number of entities > 100 PLN * | Number of entities exempted from the obligation to pay fees payments range: 100 PLN to 800 PLN | Number of entities obligated to pay fees: above 800 PLN |
|---|---|---|---|---|
| 2015 | 193 | 164.1 | 28.8 | |
| 2016 | 103 | 90.4 | 45.4 | 45 |
| 2018 | 95,9 | 89.6 | 58.4 | 31.2 |
| 2019 | 86,9 | 82 | 52.4 | 29.6 |
Redistribution of the environmental fees in Poland in 2004–2020
| Year | Municipality | District | WFOŚiGW | NFOŚiGW | Other costs | Total [thousand PLN] | Change % y/y |
|---|---|---|---|---|---|---|---|
| [thousand PLN] | |||||||
| 2004 | 410 949.90 | 162 286.00 | 676 142.40 | 373 407.30 | 17 630.10 | 1 640 415.70 | - |
| 2005 | 306 552.90 | 122 924.50 | 523 431.70 | 291 474.80 | 21 780.50 | 1 266 164.40 | −23% |
| 2006 | 399 688.00 | 159 032.90 | 660 908.30 | 356 433.90 | 27 945.20 | 1 604 008.30 | 27% |
| 2007 | 427 103.40 | 165 279.50 | 685 662.30 | 369 976.60 | 23 387.20 | 1 671 409.00 | 4% |
| 2008 | 531 456.40 | 185 879.80 | 737 148.10 | 396 956.00 | 17 622.70 | 1 869 063.00 | 12% |
| 2009 | 584 042.40 | 185 594.80 | 706 018.40 | 380 187.20 | 19 988.30 | 1 875 831.10 | 0% |
| 2010 | 604 028.30 | 195 271.10 | 740 374.40 | 390 752.10 | 12 775.80 | 1 943 201.70 | 4% |
| 2011 | 587 639.70 | 193 016.10 | 744 797.20 | 398 037.70 | 12 531.70 | 1 936 022.40 | 0% |
| 2012 | 549 774.30 | 183 290.30 | 715 313.30 | 382 438.90 | 13 869.80 | 1 844 686.60 | −5% |
| 2013 | 265 007.60 | 87 973.00 | 342 315.20 | 182 895.20 | 14 401.30 | 892 592.30 | −52% |
| 2014 | 454 377.10 | 158 784.00 | 616 996.40 | 330 236.10 | 68 102.00 | 1 628 495.60 | 82% |
| 2015 | 459 001.00 | 162 158.00 | 637 106.20 | 341 031.40 | 30 164.60 | 1 629 461.20 | 0% |
| 2016 | 441 843.00 | 155 608.80 | 609 519.00 | 352 311.60 | 25 692.80 | 1 584 975.20 | −3% |
| 2017 | 384 592.60 | 139 264.10 | 552 792.50 | 316 015.70 | 26 964.50 | 1 419 629.40 | −10% |
| 2018 | 367 471.10 | 133 504.90 | 531 999.30 | 303 621.60 | 44 383.00 | 1 380 979.90 | −3% |
| 2019 | 337 555.60 | 96 798.90 | 340 488.70 | 200 876.60 | 19 037.50 | 994 757.30 | −28% |
| 2020 | 368 319.00 | 100 485.50 | 339 331.60 | 198 181.00 | 35 975.40 | 1 042 292.50 | 5% |
Costs of redistribution of environmental fee revenues in Poland in 2010–2020
| Year | Costs related to payment enforcement | Costs related to bank account maintenance | Costs related to transfer of repayable contributions | Costs related to interest on overdue fee payments | Fees due to the Marshall Offices | Other costs | Total costs |
|---|---|---|---|---|---|---|---|
| [thousand PLN] | [thousand PLN] | ||||||
| 2010 | 657.80 | 2.10 | 11 090.60 | 0.00 | 968.00 | 57.30 | 12 775.80 |
| 2011 | 544.00 | 1 884.00 | 7 992.60 | 0.00 | 1 600.80 | 510.30 | 12 531.70 |
| 2012 | 768.70 | 0.90 | 11 629.90 | 0.00 | 1 419.80 | 50.50 | 13 869.80 |
| 2013 | 413.50 | 0.60 | 12 880.80 | 0.00 | 1 067.00 | 39.40 | 14 401.30 |
| 2014 | 366.70 | 0.40 | 42 913.40 | 0.00 | 24 750.70 | 70.80 | 68 102.00 |
| 2015 | 501.90 | 0.40 | 8 296.30 | 0.00 | 20 936.20 | 429.80 | 30 164.60 |
| 2016 | 200.80 | 0.20 | 5 578.90 | 0.00 | 19 882.90 | 30.00 | 25 692.80 |
| 2017 | 139.90 | 0.00 | 8 436.80 | 0.00 | 18 334.20 | 53.60 | 26 964.50 |
| 2018 | 256.30 | 0.10 | 26 367.10 | 0.00 | 17 719.60 | 39.90 | 44 383.00 |
| 2019 | 173.10 | 0.10 | 7 380.20 | 0.00 | 11 465.50 | 18.60 | 19 037.50 |
| 2020 | 160.60 | 0.10 | 21 139.70 | 0.00 | 14 652.90 | 22.10 | 35 975.40 |
Revenues from environmental charges in Poland, in the period 2003–2020
| Year | FEE CATEGORY (thousand PLN) | Total [thousand PLN] | % y/y | |||
|---|---|---|---|---|---|---|
| Wastewater management and water protection | Atmospheric air and climate protection, CO2 emissions | Waste management | Other areas and other receipts | |||
| 2003 | 512 187.90 | 700 243.20 | 232 011.30 | 90 158.20 | 1 534 600.60 | - |
| 2004 | 443 026.90 | 834 926.60 | 249 600.30 | 90 405.00 | 1 617 958.80 | 5% |
| 2005 | 375 158.20 | 652 633.70 | 189 204.70 | 99 700.30 | 1 316 696.90 | −19% |
| 2006 | 438 779.90 | 802 906.50 | 260 911.80 | 51 546.40 | 1 554 144.60 | 18% |
| 2007 | 457 870.00 | 823 848.50 | 341 171.10 | 65 649.80 | 1 688 539.40 | 9% |
| 2008 | 449 280.00 | 817 250.50 | 522 010.50 | 68 855.00 | 1 857 396.00 | 10% |
| 2009 | 448 949.20 | 655 694.60 | 705 979.30 | 63 412.40 | 1 874 035.50 | 1% |
| 2010 | 456 589.90 | 721 388.70 | 714 576.10 | 51 609.00 | 1 944 163.70 | 4% |
| 2011 | 463 468.60 | 763 906.20 | 671 394.60 | 20 996.60 | 1 919 766.00 | −1% |
| 2012 | 470 750.70 | 724 002.70 | 595 964.50 | 34 748.10 | 1 825 466.00 | −5% |
| 2013* | 227 922.80 | 342 784.50 | 287 220.00 | 29 464.00 | 887 391.30 | −51% |
| 2014 | 459 819.30 | 640 200.00 | 450 435.50 | 76 692.70 | 1 627 147.50 | 83% |
| 2015 | 476 361.30 | 673 334.30 | 443 775.50 | 35 692.50 | 1 629 163.60 | 0% |
| 2016 | 487 585.70 | 631 878.70 | 431 022.10 | 35 760.80 | 1 586 247.30 | −3% |
| 2017 | 488 685.40 | 545 845.30 | 350 397.00 | 34 998.30 | 1 419 926.00 | −10% |
| 2018 | 467 745.80 | 532 734.70 | 330 561.40 | 35 930.00 | 1 366 971.90 | −4% |
| 2019 | 2 547.40** | 492 428.00 | 475 199.40 | 30 165.50 | 1 000 340.30 | −27% |
| 2020 | 1 278.00** | 451 708.10 | 576 689.90 | 68 774.30 | 1 098 450.30 | 10% |