Fig. 1.
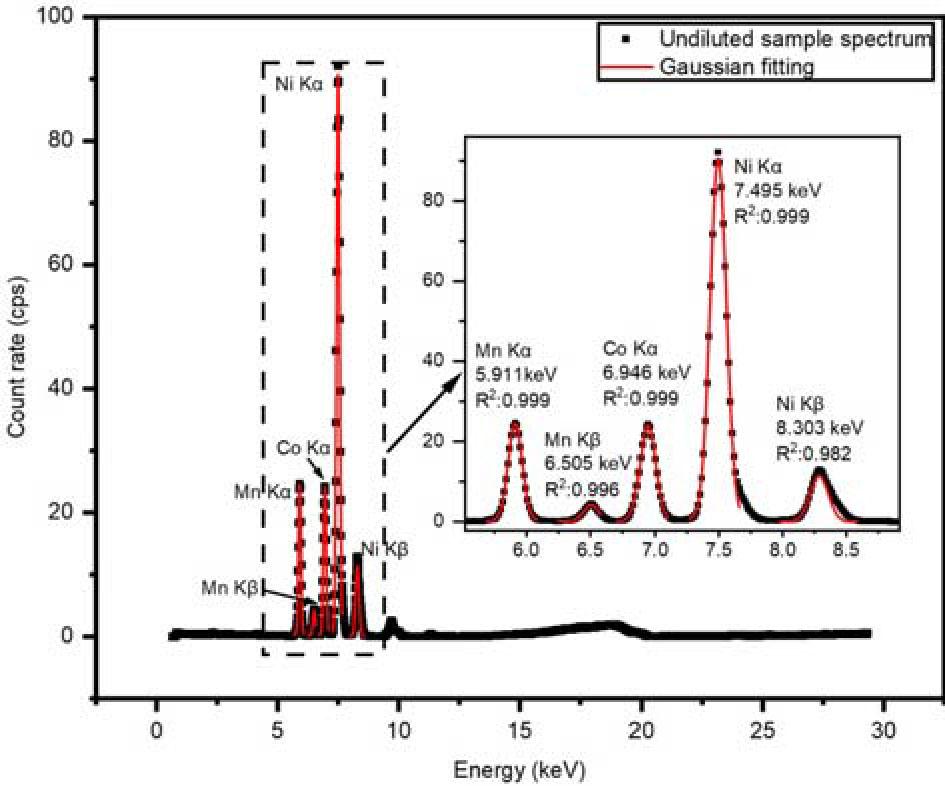
Fig. 2.
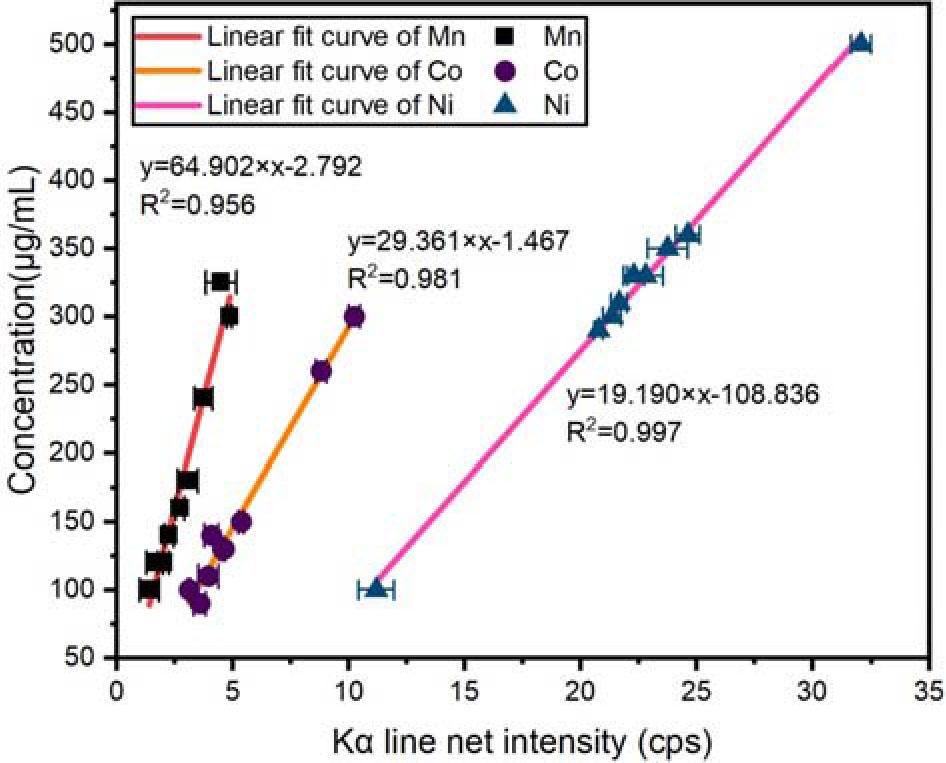
Fig. 3.
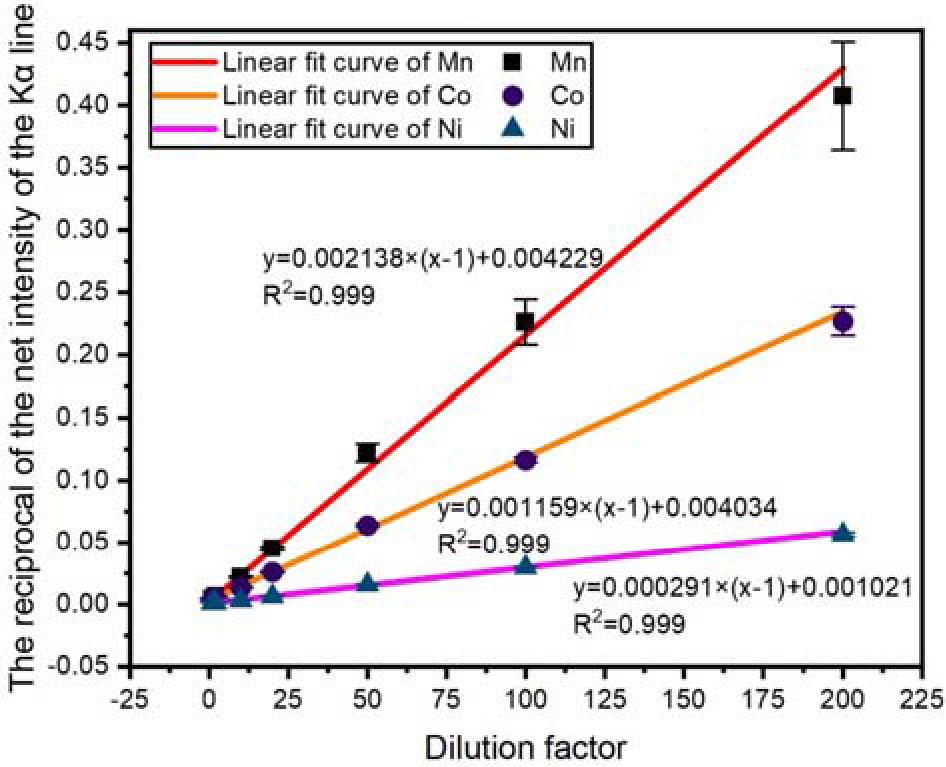
Fig. 4.
Standard samples information
| Standard sample no. | Mn concentration (mg/mL) | Co concentration (mg/mL) | Ni concentration (mg/mL) |
|---|---|---|---|
| SS1 | 100.0 | 100.0 | 100.0 |
| SS2 | 300.0 | 300.0 | 300.0 |
| SS3 | 325.0 | 140.0 | 360.0 |
| SS4 | 120.0 | 130.0 | 330.0 |
| SS5 | 240.0 | 260.0 | 500.0 |
| SS6 | 180.0 | 150.0 | 350.0 |
| SS7 | 160.0 | 130.0 | 330.0 |
| SS8 | 140.0 | 110.0 | 310.0 |
| SS9 | 120.0 | 90.0 | 290.0 |
| MnSS1 | 100.0 | 0.0 | 0.0 |
| MnSS2 | 200.0 | 0.0 | 0.0 |
| MnSS3 | 300.0 | 0.0 | 0.0 |
| CoNiSS1 | 0.0 | 100.0 | 100.0 |
| CoNiSS2 | 0.0 | 200.0 | 200.0 |
| CoNiSS3 | 0.0 | 300.0 | 300.0 |
The results of the element content in the test samples using the improved matrix dilution method
| Sample no. | Dilution factor | Mn | Co | Ni | MRE (%) | |||
|---|---|---|---|---|---|---|---|---|
| mol (%) | RE (%) | mol (%) | RE (%) | mol (%) | RE (%) | |||
| S1 | 1 | 38.9 | 36.9 | 17.0 | 14.5 | 44.1 | 14.8 | 22.1 |
| S2 | 2 | 35.0 | 23.4 | 18.0 | 9.8 | 47.0 | 9.3 | 14.1 |
| S3 | 10 | 28.7 | 0.9 | 19.5 | 2.2 | 51.9 | 0.2 | 1.1 |
| S4 | 20 | 27.5 | 3.1 | 19.7 | 0.8 | 52.7 | 1.8 | 1.9 |
| S5 | 50 | 27.1 | 4.7 | 20.0 | 0.4 | 52.9 | 2.2 | 2.5 |
| S6 | 100 | 27.4 | 3.6 | 20.1 | 1.2 | 52.5 | 1.3 | 2.0 |
| S7 | 200 | 28.3 | 0.3 | 20.3 | 2.2 | 51.3 | 0.9 | 1.1 |
The results of the element content of the test samples using the traditional matrix dilution method
| Sample no. | Dilution factor | Mn | Co | Ni | MRE (%) | |||
|---|---|---|---|---|---|---|---|---|
| mol (%) | RE (%) | mol (%) | RE (%) | mol (%) | RE (%) | |||
| S1 | 1 | 38.9 | 36.9 | 16.9 | 15.3 | 44.3 | 14.5 | 22.2 |
| S2 | 2 | 35.0 | 23.1 | 18.1 | 9.0 | 46.9 | 9.4 | 13.8 |
| S3 | 10 | 28.8 | 1.3 | 19.4 | 2.4 | 51.8 | 0.0 | 1.2 |
| S4 | 20 | 27.5 | 3.1 | 19.7 | 0.8 | 52.7 | 1.8 | 1.9 |
| S5 | 50 | 26.2 | 7.8 | 20.4 | 2.4 | 53.4 | 3.1 | 4.4 |
| S6 | 100 | 26.8 | 5.5 | 20.6 | 3.6 | 52.5 | 1.4 | 3.5 |
| S7 | 200 | 28.7 | 0.9 | 19.8 | 0.7 | 51.6 | 0.4 | 0.7 |