
This paper describes the possibility of using the thermoluminescence (TL) method for the detection of the irradiation of dried fruits using low doses of radiation. Dried fruits are used on an industrial scale as an active ingredient in phytopharmaceuticals, mainly in food supplements and in teas and herbal infusions. Market research on dried fruit shows that the number of consumers of these products is constantly growing [1, 2], and they should therefore meet the requirements to be considered as healthy and safe food.
Dried fruits, along with spices and herbs, belong to a group of products that are relatively frequently exposed to ionizing radiation for preservation purposes and to eliminate the incidental presence of pathogenic microorganisms. The recommended dose for preservation is approximately 10 kGy [3–12]. However, doses <10 kGy are often used for sanitary protection. According to Cruz-Zaragoza et al. [13], doses <0.4 kGy are used in many countries.
Despite the many concerns about the adverse effects prevailing, it can be pointed out that irradiation does not cause radioactivity in food; does not change the composition of food; does not reduce the nutritional value; and does not change the taste, texture, or appearance of food [14–21].
The European Committee for Standardization has published the standard EN 1788:2001 [22] for the detection of radiation by TL in foods from which silicate minerals can be isolated. TL is currently the most widely used method for detecting irradiation of seafood, spices, and herbs and their mixtures [23–49]. This method is also used for the detection of irradiation of fresh and dried fruits and vegetables [26–28, 31–35, 50–66].
Electron paramagnetic resonance (EPR) is also used to detect irradiation of dried fruits [67–80]. However, the EPR signals of irradiated fruits are complex and relatively broad, which can have a negative effect on the sensitivity of the method and therefore the difficulty of detecting irradiation of dried fruits with low doses of radiation. In the present work, 10 dried fruits were selected to study whether the irradiation treatment is detected by TL.
In the present work, 10 types of dried fruits (strawberries, cherries, black currants, two kinds of raisins, mulberries, apricots, figs, dates, and plums) have been selected to study the detection of the irradiation treatment by TL. The products were purchased from Warsaw, Poland.
All chemicals of the analytical grade were purchased from commercial sources: sodium polytungstate (3 Na2WO4·9 WO3·H2O) was purchased from Sometu, Germany; hydrochloric acid (HCl), ammonium hydroxide (NH3(aq), and acetone (C3H6O) were purchased from Avantor Performance Materials, Poland S.A.; and silicone spray was purchased from Henax Sp. z o.o., Poland. Nitrogen (N2) for flushing the TL heating chamber was purchased from Air Products and Chemicals, Inc., with a purity of 99.98%. The water was at grade 3.
Gamma irradiation of dried fruits was performed in the Gamma Chamber GC5000 cobalt source (BRIT, India – installed at the Institute of Nuclear Chemistry and Technology) at doses of 0.1 kGy, 0.3 kGy, and 0.5 kGy at a dose rate of 1.6 kGy/h. The absorbed dose was controlled with an alanine dosimeter according to the ISO/ASTM 51607:2013(E) Standard Practice for use of an alanine-EPR dosimetry system [81].
The description of the testing methodology is based on the EN 1788:2001 standard [22]. The isolated silicate minerals are required to be free of organic material. The presence of organic matter could induce spurious (non-radiation induced) luminescence, or in extreme cases, could obscure TL. Samples with organic residues are found blackened by the TL measurement process [22].
Preconcentration of minerals by wet sieving was performed for dried fruits. Samples weighing 200–300 g were placed in 1000 ml glass beakers, and water was added to cover the dried fruits.
The dried fruits in the beakers were treated with ultrasound for about 5 min (to loosen the adhering minerals).
Then, the dried fruits were sieved in portions through a 250-μm nylon mesh into large beakers, rinsing the minerals through with water each time, using a strong jet of water from a wash bottle. The constituents retained by the sieve cloth were discarded. Solutions with the minerals were allowed to settle for 10 min.
Most of the water from the large beaker was decanted together with the organic minerals, leaving only the silicate minerals in a few millilitres of water. The mineral fraction was transferred to a centrifuge tube using a Pasteur pipette. The centrifuge tubes were centrifuged for 1 min at a centrifugal acceleration of 1000 g. The water was removed by suction, leaving the mineral fraction behind.
To the mineral fraction in the centrifuge tubes was added 5 ml of sodium polytungstate solution with a density of 2 g/ml. Then, the tubes were shaken vigorously and agitated in an ultrasonic bath for 10 min.
The mineral fraction in the centrifuge tubes was centrifuged for 2 min at a centrifugal acceleration of 1000 g. The silicate minerals were sedimented, whereas the organic components were found floating.
Then, carefully the sodium polytungstate solution was overlayed with water to facilitate removal of the organic material. The upper water layer and the organic materials were extracted by vacuum suction, leaving the minerals behind in the lower polytungstate layer. If not all organic material is removed, overlayed the sodium polytungstate solution with water again and repeated the extraction.
The minerals were washed twice to remove the sodium polytungstate residues by filling the centrifuge tube with water and allowing the minerals to settle. The water was later removed.
To dissolve carbonates adhering to the silicate minerals, added 1 ml of hydrochloric acid of 3 mol/l and agitated and left for 10 min.
The acid was neutralized using an ammonium hydroxide solution of 1 mol/l, the centrifuge tube filled up with water, and allowed the minerals to settle. The supernatant fluid was removed, and the mineral residue was washed twice with water.
To displace the residual water, added about 3 ml of acetone and agitated. If the acetone became turbid, it was removed and a fresh portion of acetone was added.
The isolated silicate minerals in acetone were transferred to a disc using a Pasteur pipette. Stainless steel discs had a diameter of 9 mm and a thickness of 0.25 mm. The deposit of minerals was fixed on the disc by using silicone spray.
The discs with the silicate minerals were stored overnight at 50 ± 5°C in a laboratory oven. The acetone dried off leaving a deposit of silicate minerals adhering to the discs.
TL measurements of isolated silicate minerals were carried out with a TL reader, type TL/OSL, model TL-DA-20 (Risø National Laboratory, Denmark) under the measurement conditions recommended by EN 1788:2001 standard [22]:
Initial temperature: 70°C; heating rate: 6°C/s; preheat time: 30 s; final temperature: 450°C.
The sample was preheated to a temperature of about -70°C using the heating rate -6°C/s. Then, this temperature was held for 30 s. A temperature was run up to a temperature of -450°C.
The results of the TL measurements are recorded in the form of TL curves expressing the relationship between TL intensity and heating temperature registered in the range of 70–450°C. Finding of a maximum (peak) in the TL curve in the temperature range of 150–250°C is an evidence of sample irradiation [22]. Each of the investigated samples was measured twice: The first measurement of TL (Glow 1) was followed by the so-called calibrated measurement Glow 2, which is recorded after exposing the samples to a dose of 1 kGy.
After irradiation of the discs, they were stored overnight at 50 + 5°C in a laboratory oven before recording Glow 2. Glow 2 was measured under the same conditions as Glow 1.
The conducted research aimed to determine whether the TL method is effective in detecting irradiation of dried fruits with lower doses of ionizing radiation than the previously used doses in the range of 1–10 kGy.
The results obtained from measuring the TL of the dried fruits studied are presented in Table 1 (before irradiation – dose of 0 kGy and after irradiation – dose of 0.1 kGy, 0.3 kGy, and 0.5 kGy).
Results of TL measurements on dried fruits, nonirradiated and irradiated at doses 0.1 kGy, 0.3 kGy, and 0.5 kGy
| 1 | 2 | 4 | 5 | 6 | 7 | 8 |
|---|---|---|---|---|---|---|
| Product name | Dose (kGy) | TL intensity Glow 1 (150–250°C) (counts/s)* | TL intensity Glow 2 (150–250°C) (counts/s)* | Glow 1/Glow 2 | TL max. Glow 1 (°C) | TL max. Glow 2 (°C) |
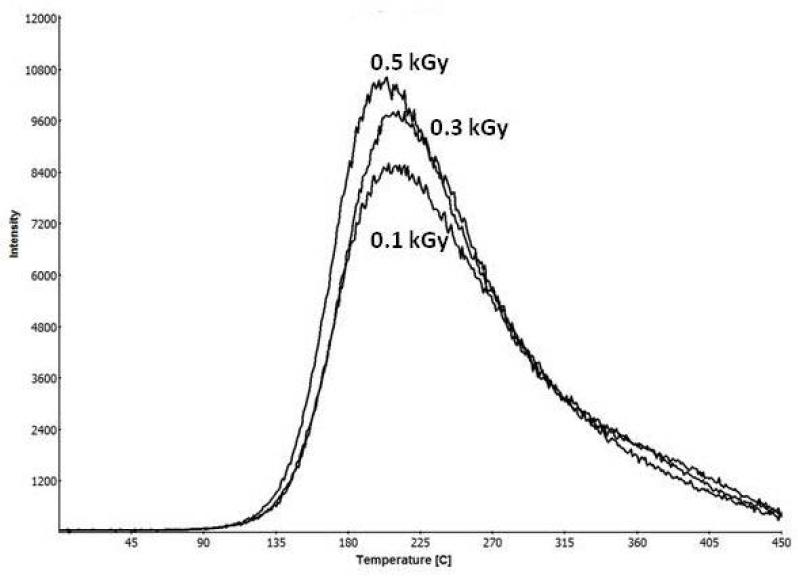
| Dried strawberries | 0 | 198 506 | 70 836 640 | 0.003 | 274 | 184 |
| 0.1 | 4 523 523 | 65 911 546 | 0.069 | 189 | 185 | |
| 0.3 | 17 255 429 | 60 080 576 | 0.287 | 187 | 184 | |
| 0.5 | 12 389 562 | 25 769 557 | 0.481 | 184 | 185 | |
| Dried cherries | 0 | 2 767 | 4 512 059 | 0.001 | >300 | 189 |
| 0.1 | 366 090 | 7 151 444 | 0.051 | 184 | 185 | |
| 0.3 | 1 038 791 | 4 650 785 | 0.223 | 182 | 178 | |
| 0.5 | 6 218 121 | 17 305 999 | 0.359 | 187 | 184 | |
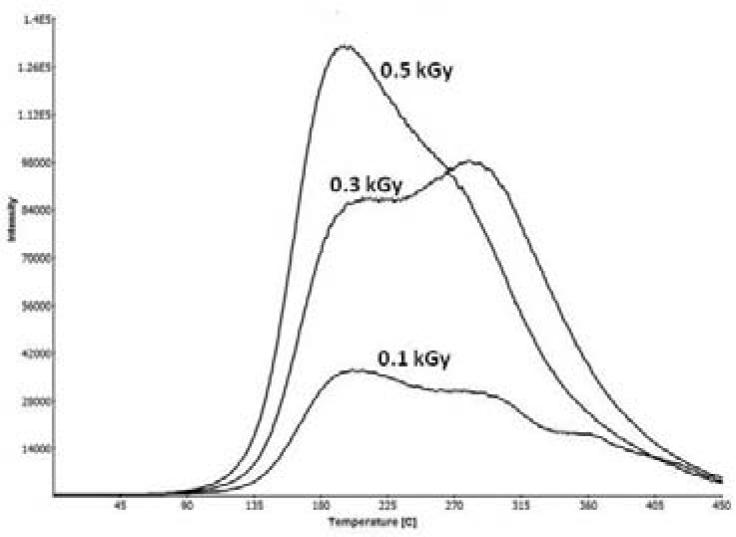
| Dried blackcurrants | 0 | 34 528 | 53 734 996 | 0.001 | >300 | 190 |
| 0.1 | 2 939 176 | 41 324 465 | 0.071 | 189 | 185 | |
| 0.3 | 38 302 937 | 150 752 558 | 0.254 | 176 | 178 | |
| 0.5 | 38 302 937 | 86 004 147 | 0.445 | 182 | 189 | |
| Sultana raisins | 0 | 10 854 | 7 716 995 | 0.001 | >300 | 193 |
| 0.1 | 626 748 | 13 023 415 | 0.048 | 202 | 195 | |
| 0.3 | 2 097 384 | 13 172 576 | 0.159 | 204 | 193 | |
| 0.5 | 3 007 242 | 8 762 420 | 0.343 | 202 | 189 | |
| Dried mulberry | 0 | 1 950 | 1 780 820 | 0.001 | >300 | 185 |
| 0.1 | 490 265 | 6 362 997 | 0.077 | 215 | 199 | |
| 0.3 | 522 540 | 2 393 365 | 0.218 | 199 | 197 | |
| 0.5 | 662 538 | 247 763 | 0.267 | 208 | 197 | |
| Iranian raisins | 0 | 30 023 | 33 247 193 | 0.001 | 295 | 189 |
| 0.1 | 3 422 594 | 51 448 440 | 0.066 | 208 | 195 | |
| 0.3 | 7 404 863 | 41 464 001 | 0.178 | 202 | 187 | |
| 0.5 | 10 998 191 | 38 722 815 | 0.284 | 195 | 184 | |
| Dried apricots | 0 | 3 738 | 4 129 258 | 0.001 | >300 | 189 |
| 0.1 | 114 759 | 23 246 668 | 0.049 | 200 | 197 | |
| 0.3 | 731 068 | 4 452 959 | 0.164 | 206 | 193 | |
| 0.5 | 810 285 | 2 946 271 | 0.275 | 200 | 193 | |
| Dried figs | 0 | 12 859 | 4 621 315 | 0.003 | >300 | 187 |
| 0.1 | 236 994 | 6 997 634 | 0.034 | 200 | 191 | |
| 0.3 | 781 721 | 4 162 217 | 0.188 | 200 | 195 | |
| 0.5 | 1 012 569 | 3 444 112 | 0.294 | 189 | 184 | |
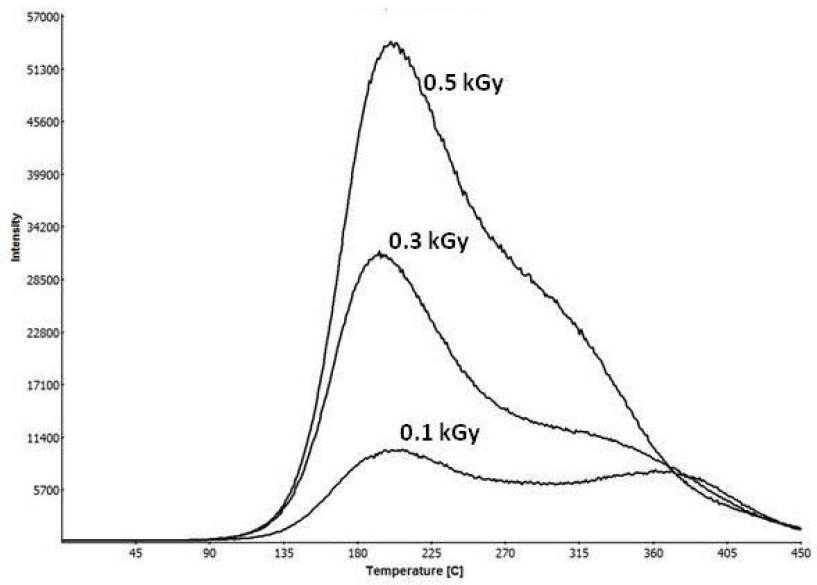
| Dried dates | 0 | 2 588 | 7 102 126 | 0.001 | >300 | 180 |
| 0.1 | 945 821 | 19 370 203 | 0.049 | 200 | 189 | |
| 0.3 | 4 105 175 | 9 817 495 | 0.418 | 199 | 185 | |
| 0.5 | 1 106 343 | 2 940 401 | 0.376 | 193 | 185 | |
| Dried plums | 0 | 12 627 | 7 551 362 | 0.002 | 300 | 197 |
| 0.1 | 1 493 161 | 21 356 765 | 0.070 | 191 | 176 | |
| 0.3 | 2 617 091 | 13 326 800 | 0.196 | 202 | 182 | |
| 0.5 | 6 120 437 | 18 600 863 | 0.329 | 191 | 187 |
Counts/s – number of light pulses registered in the photomultiplier of the TL reader.
According to the EN 1788:2001 standard, in the TL method, a reliable proof of food irradiation is the analysis of TL glow curves and the following two conditions:
– Condition 1: The TL glow ratio (Glow1/Glow2) measured in the temperature range of 150–250°C must be >0.1 (see Table 1, column 6).
– Condition 2: The TL Glow 1 curve must show a clear maximum in the temperature range of 150–250°C (see Table 1, column 7).
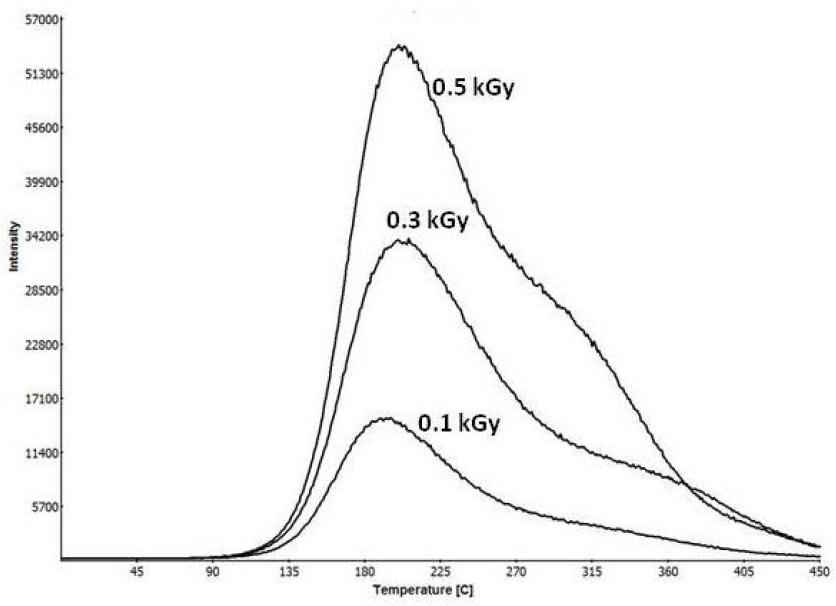
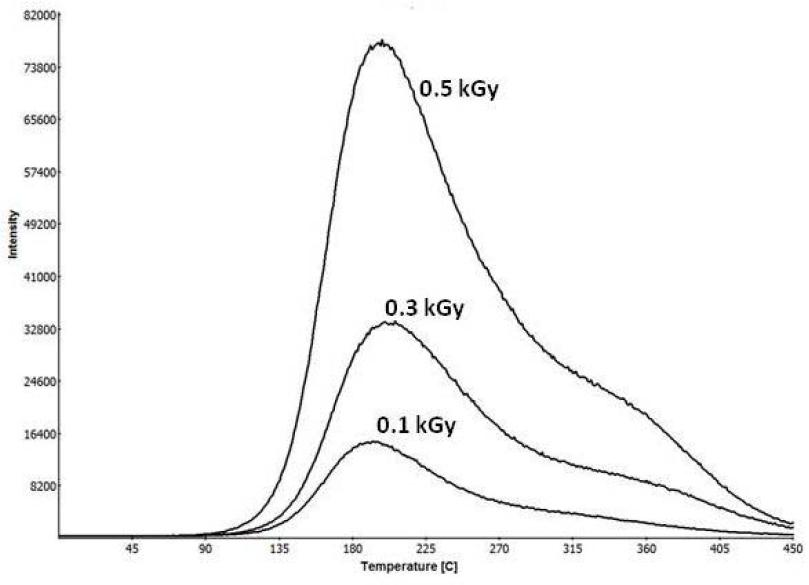
From the 10 samples of remaining dried fruits (strawberries, cherries, blackcurrants, two kinds of raisins, mulberries, apricots, figs, dates, and plums), it was possible to isolate appropriate amounts of silicate minerals using the density method with sodium polytungstate solution. Samples of the 10 listed fruits irradiated with doses of 0.3 kGy and 0.5 kGy were unequivocally identified as irradiated. On the TL glow curves of the samples irradiated with these doses, characteristic peaks of glow could be distinguished in the temperature range from 176°C to 206°C (see Table 1, column 7), ideally within the temperature range of 150–250°C, in which according to the norm, only the glow of the irradiated samples is observed. Also, the TL Glow1/Glow2 ratios of the samples irradiated with these doses were higher than the critical value of 0.1. In the case of samples irradiated with a dose of 0.3 kGy, the ration were within the range of 0.159–0.418, while for samples irradiated with a dose of 0.5 kGy, the ratios were within the range of 0.267–0.481 (see Table 1, column 6).
Not so unambiguous results were obtained when examining samples irradiated with the lowest dose 0.1 kGy. The TL Glow1/Glow2 ratios for these samples deviated from 0.1 and were slightly lower, ranging from 0.034 to 0.077 (see Table 1, column 6).
On the other hand, in the TL glow curves of these samples, it was possible to distinguish peaks in the range of 150–250°C, recorded at temperatures from 184°C to 208°C (see Table 1, column 7 and Figs. 1–10), i.e., within in the range of 150–250°C, typical for irradiated samples.
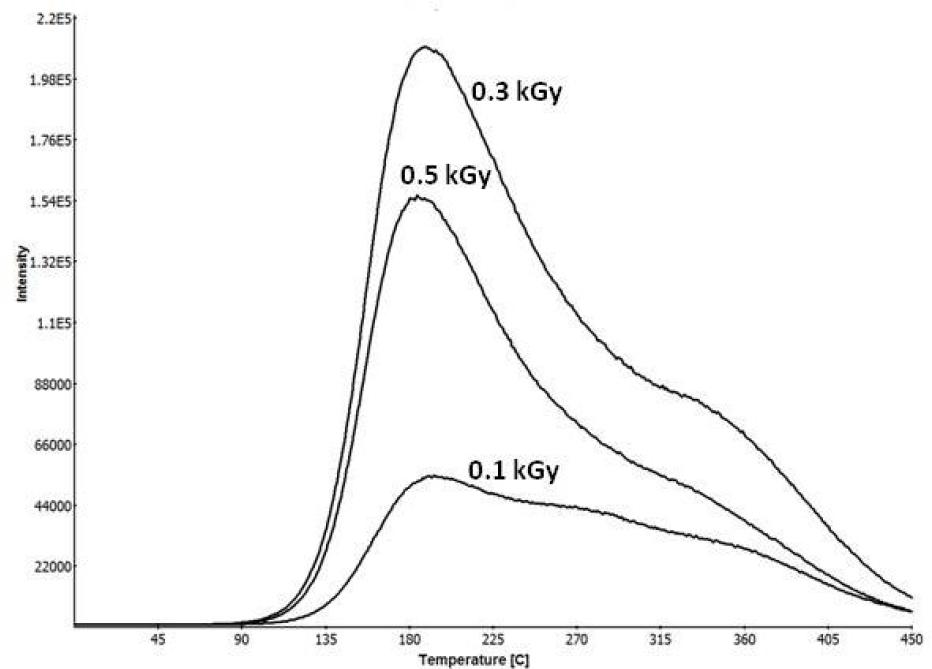
TL Glow 1 records obtained with dried strawberries irradiated with doses of 0.1 kGy, 0.3 kGy, and 0.5 kGy of gamma radiation.
TL Glow 1 records obtained with dried cherries irradiated with doses of 0.1 kGy, 0.3 kGy, 0.5 kGy of gamma radiation.
TL Glow 1 records obtained with dried blackcurrants irradiated with doses of 0.1 kGy, 0.3 kGy, and 0.5 kGy of gamma radiation.
TL Glow 1 records obtained with Sultana raisins irradiated with doses of 0.1 kGy, 0.3 kGy, and 0.5 kGy of gamma radiation.
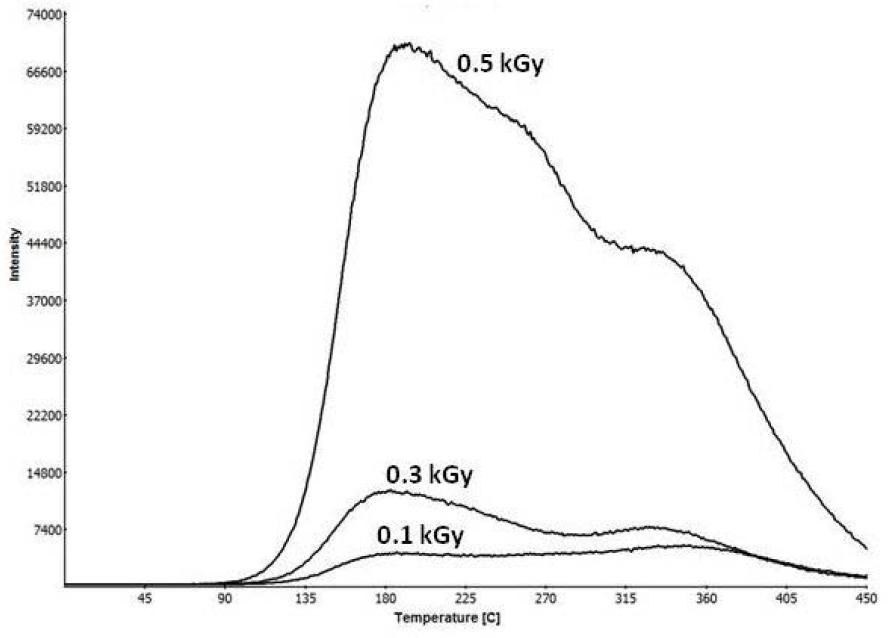
TL Glow 1 records obtained with dried mulberries irradiated with doses of 0.1 kGy, 0.3 kGy, and 0.5 kGy of gamma radiation.
TL Glow 1 records obtained with Iranian raisins irradiated with doses of 0.1 kGy, 0.3 kGy, and 0.5 kGy of gamma radiation.
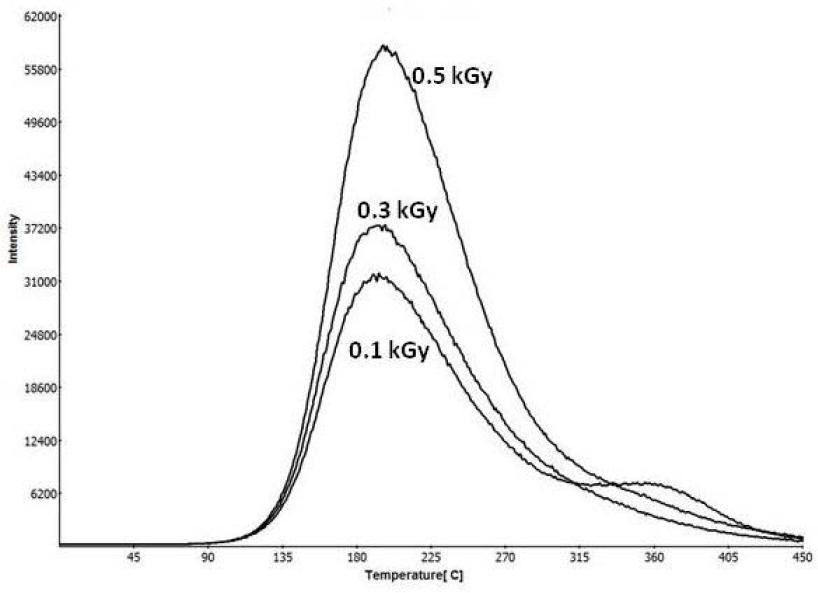
TL Glow 1 records obtained with dried apricots irradiated with doses of 0.1 kGy, 0.3 kGy, and 0.5 kGy of gamma radiation.
TL Glow 1 records obtained with dried figs irradiated with doses of 0.1 kGy, 0.3 kGy, and 0.5 kGy of gamma radiation.
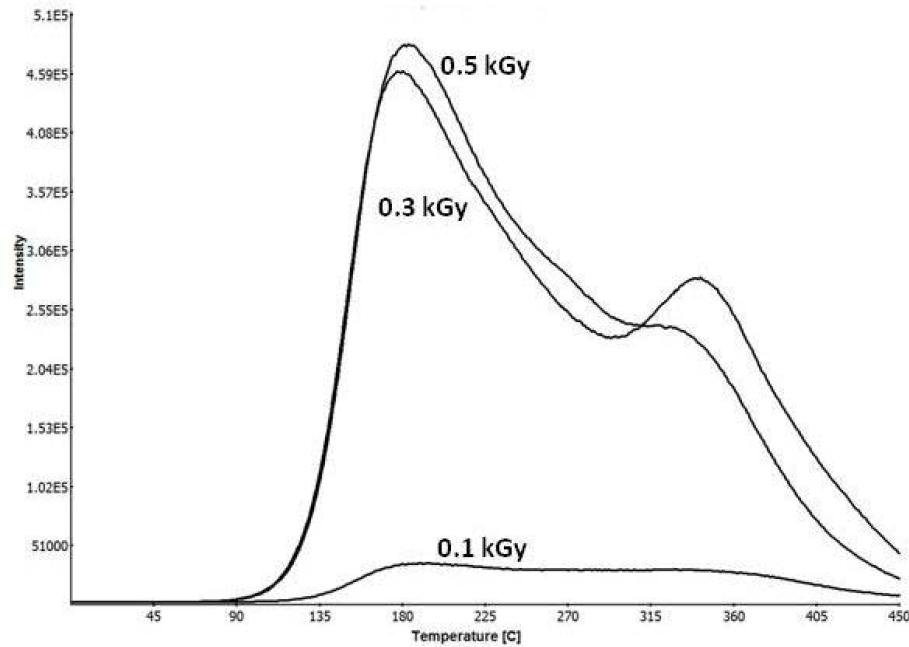
TL Glow 1 records obtained with dried dates irradiated with doses of 0.1 kGy, 0.3 kGy, and 0.5 kGy of gamma radiation.
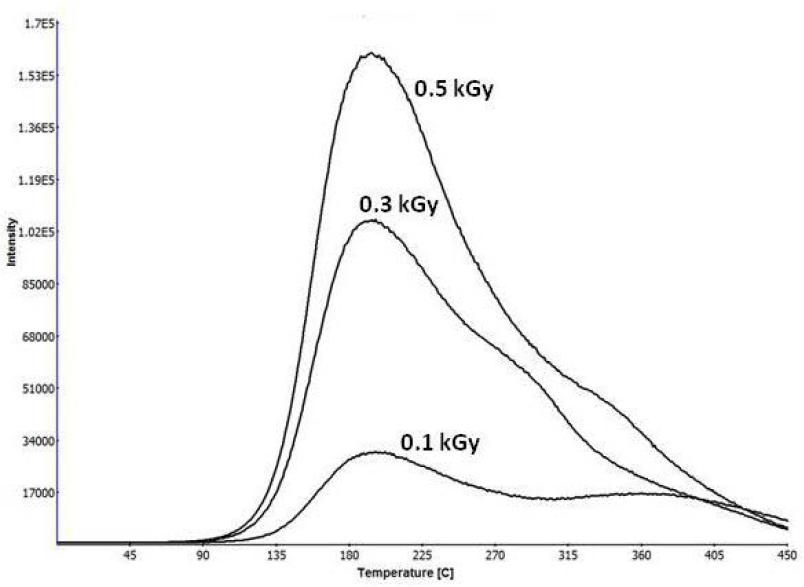
TL Glow 1 records obtained with dried plums irradiated with doses of 0.1 kGy, 0.3 kGy, and 0.5 kGy of gamma radiation.
Moreover, the EN 1788:2001 standard states that a sample has been irradiated if the ratio of glow 1 to Glow 2 is <0.1 and a clearly defined Glow 1 is observed in the range of 150–250°C. This is sufficiently reliable evidence of irradiation of the sample [22].
The TL Glow 1 records obtained with dried fruits (strawberries, cherries, blackcurrants, Sultana raisins, mulberries, Iranian raisins, apricots, figs, dates, and plums) irradiated with doses of 0.1 kGy, 0.3 kGy, and 0.5 kGy are shown in Figs. 1–10, respectively.
The tests of dried fruits described in this paper carried out using the TL method showed the usefulness of this method to identify the irradiation of a selected group of dried fruits irradiated with doses lower than those recommended in normative documents.