


Figure 1
Upper part of the homepage of the ERR’s VoD service Jupiter
Comments: Screenshot taken in March 2025.

Figure 2
Excerpt from the position score matrix
Comments: The grey cells mark the average “above-the-fold” area, while the blue cells indicate where a greater score reduction occurs.
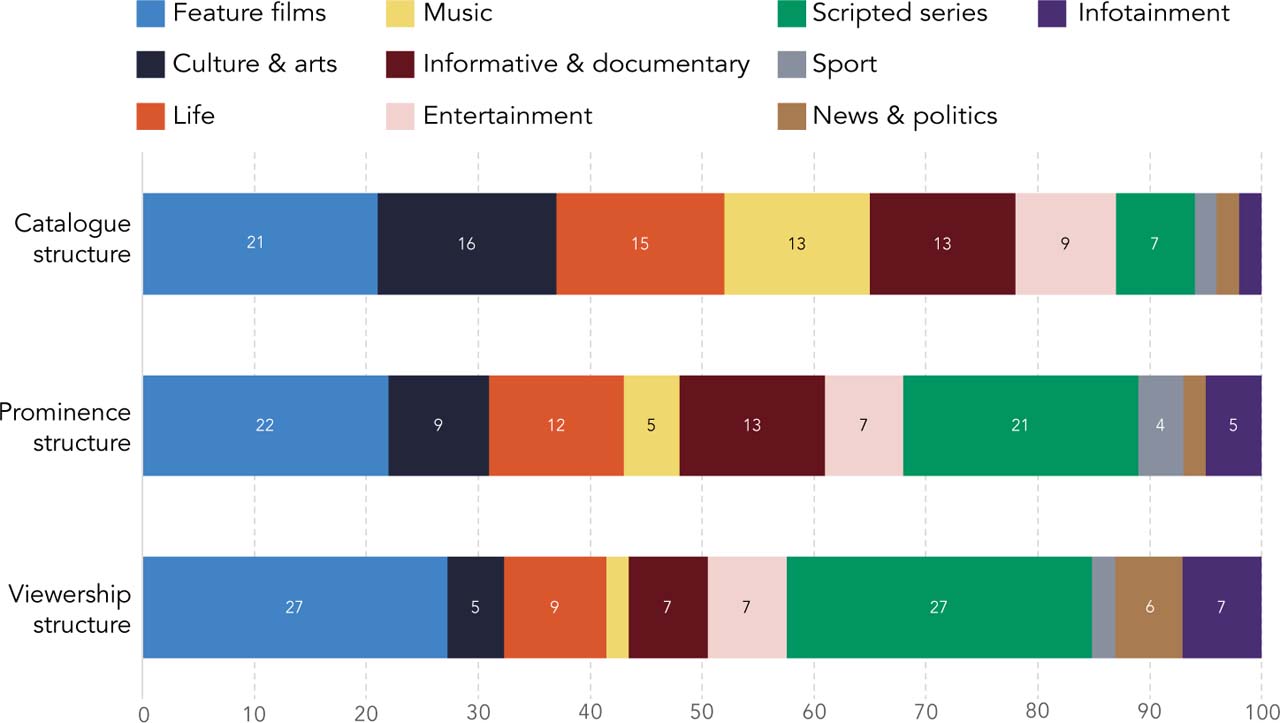
Figure 3
Distributions of content types across catalogue, prominence, and viewership on ERR’s VoD service, 2024–2025 (per cent)
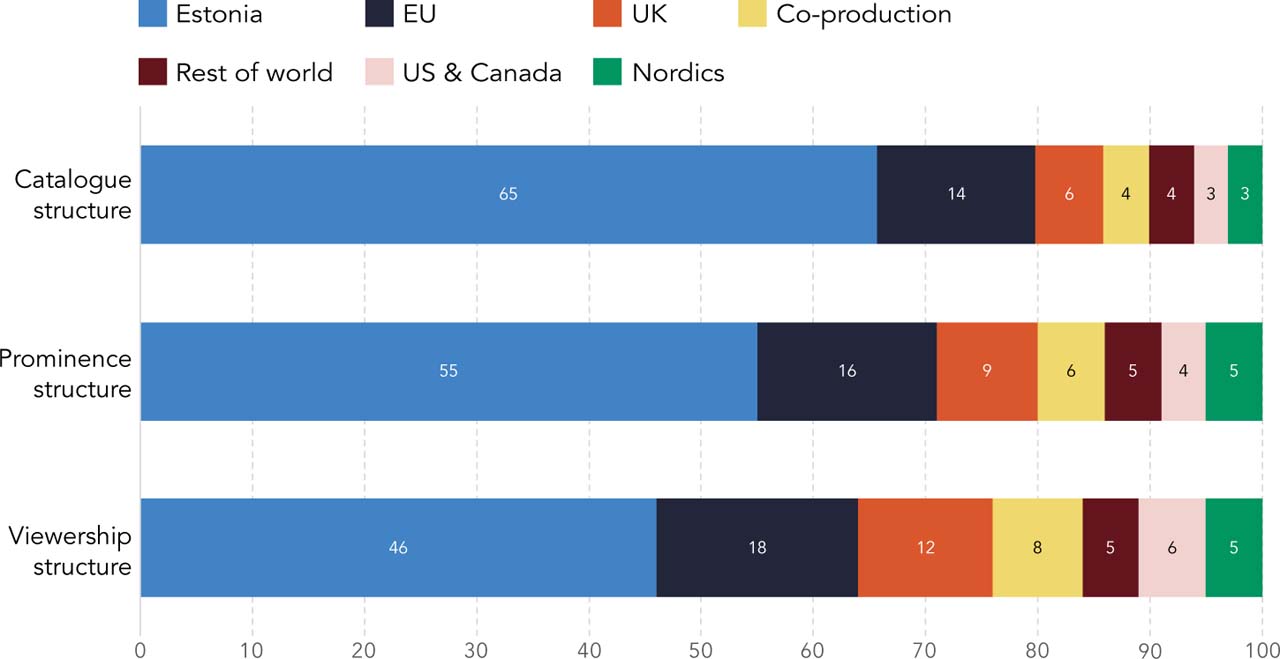
Figure 4
Distributions of content origins across catalogue, prominence, and viewership on ERR’s VoD service, 2024–2025 (per cent)
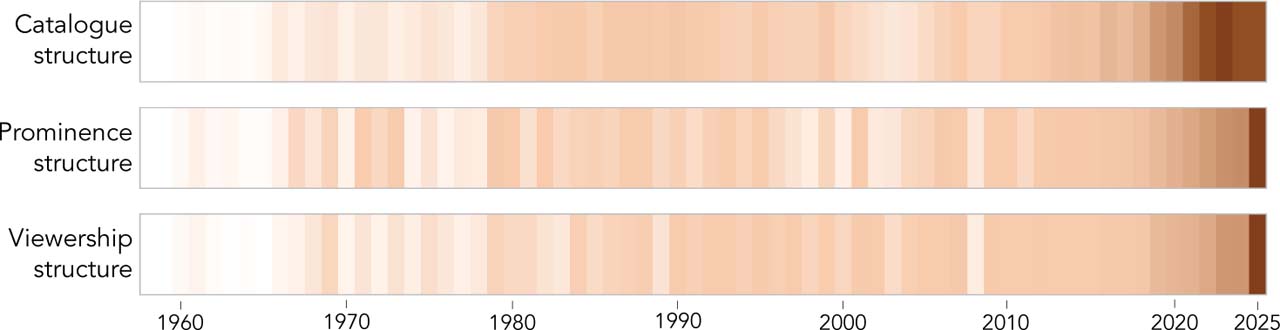
Figure 5
Distributions of production years across catalogue, prominence, and viewership on ERR’s VoD service, 2024–2025
Comments: Each vertical column represents a production year. Colour intensity indicates the share of catalogue, prominence, and viewership that the titles produced in that year received, ranging from lighter shades for lower shares (min 0%) to darker shades for higher shares (max 31%). A common colour scale is used across the three diversity stages to facilitate comparison.
Table 1
Multiple linear regression models predicting viewership on ERR’s VoD service, 2024–2025
| Model 1 | Model 2 | |||||
|---|---|---|---|---|---|---|
| R2 | 0.625 | 0.640 | ||||
| Adjusted R2 | 0.624 | 0.638 | ||||
| Variable | B | β | t | B | β | t |
| Constant | 384.904 | 4.29* | –11,747.546 | –1.45 | ||
| Prominence score | 0.179 | 0.501 | 41.22* | 0.170 | 0.474 | 38.22* |
| Broadcast score | −2.784 | −0.091 | −5.30* | –3.058 | −0.100 | –5.84* |
| Premiere score | 24.490 | 0.494 | 30.81* | 25.165 | 0.507 | 31.27* |
| Days available | −2.205 | −0.055 | −5.53* | –1.181 | −0.029 | –2.72* |
| Production year | — | — | — | 6.269 | 0.017 | 1.55 |
| Culture & arts | — | — | — | –975.719 | –.061 | –4.81* |
| Life | — | — | — | –1,014.978 | –.060 | –4.82* |
| Music | — | — | — | –990.152 | –.056 | –4.67* |
| Informative & documentary | — | — | — | –1,595.134 | –.090 | –7.39* |
| Entertainment | — | — | — | –482.683 | –.024 | –1.97 |
| Scripted series | — | — | — | 247.340 | .011 | 0.92 |
| Sport | — | — | — | –2,071.281 | –.055 | –5.41* |
| News & politics | — | — | — | –1,453.440 | –.031 | –3.00* |
| Infotainment | — | — | — | 1,508.670 | .033 | 3.20* |
| EU | — | — | — | 302.854 | 0.018 | 1.63 |
| UK | — | — | — | 568.886 | 0.024 | 2.25 |
| Nordics | — | — | — | 631.495 | 0.019 | 1.91 |
| US & Canada | — | — | — | 508.566 | 0.016 | 1.58 |
| Rest of world | — | — | — | –334.417 | −0.011 | –1.10 |
| Co-production | — | — | — | 1,068.057 | 0.038 | 3.68* |