

Table 1
Number of AI articles in sampled media, by outlet
| Medium | Outlet | Number of articles | % |
|---|---|---|---|
| Newspapers | Politiken | 46 | 21 |
| Berlingske Tidende | 41 | 19 | |
| Jyllands-Posten | 40 | 18 | |
| Information | 36 | 17 | |
| Weekendavisen | 23 | 11 | |
| Kristeligt Dagblad | 11 | 5 | |
| Børsen | 8 | 4 | |
| Ekstrabladet | 4 | 2 | |
| Avisen Danmark | 3 | 1 | |
| B.T. | 3 | 1 | |
| Arbejderen | 2 | 1 | |
| Total | 217 | 100 | |
| Magazines | Ingeniøren | 12 | 33 |
| Alt om Data | 7 | 19 | |
| Prosabladet | 6 | 17 | |
| Computerworld | 5 | 14 | |
| Medicoteknik | 3 | 8 | |
| Automatik & Proces | 1 | 3 | |
| Teknisk Nyt | 1 | 3 | |
| Teknovation | 1 | 3 | |
| Total | 36 | 100 |
Table 2
Number of AI articles in sampled media per decade
| Years | Number of articles | % |
|---|---|---|
| 1956–1959 | 0 | n.a. |
| 1960–1969 | 0 | n.a. |
| 1970–1979 | 0 | n.a. |
| 1980–1989 | 9 | 4 |
| 1990–1999 | 39 | 15 |
| 2000–2009 | 46 | 18 |
| 2010–2019 | 147 | 58 |
| 2020–2021 | 12 | 5 |
| Total | 253 | 100 |
[i] Comments: As the data collection spanned from 1956–2021, the first and last time ranges are not full decades.
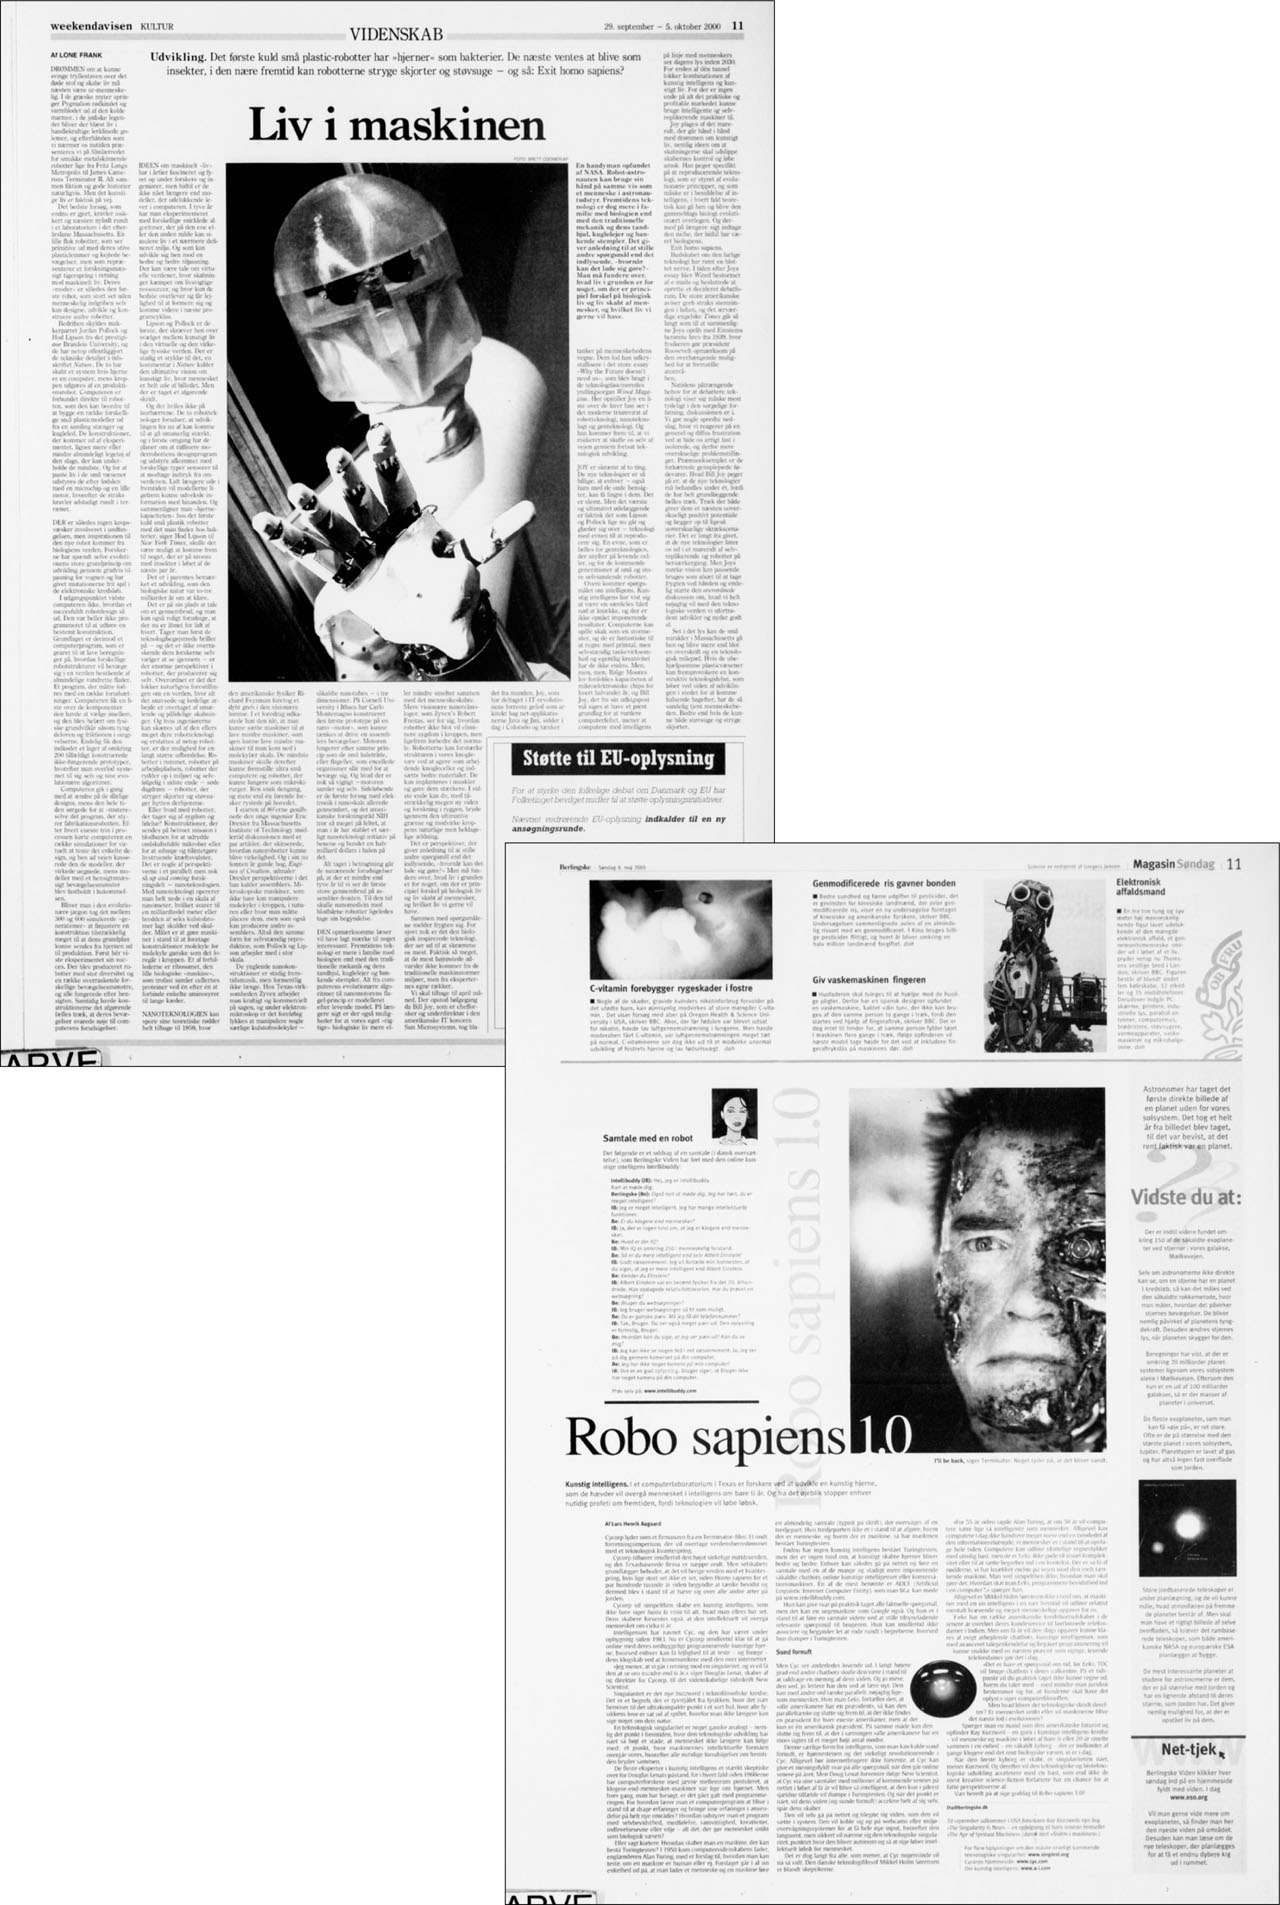
Figure 1
Facsimiles of two newspaper articles, 2000s
Source: Weekendavisen, 2000 (left); Berlingske Tidende, 2005 (right)
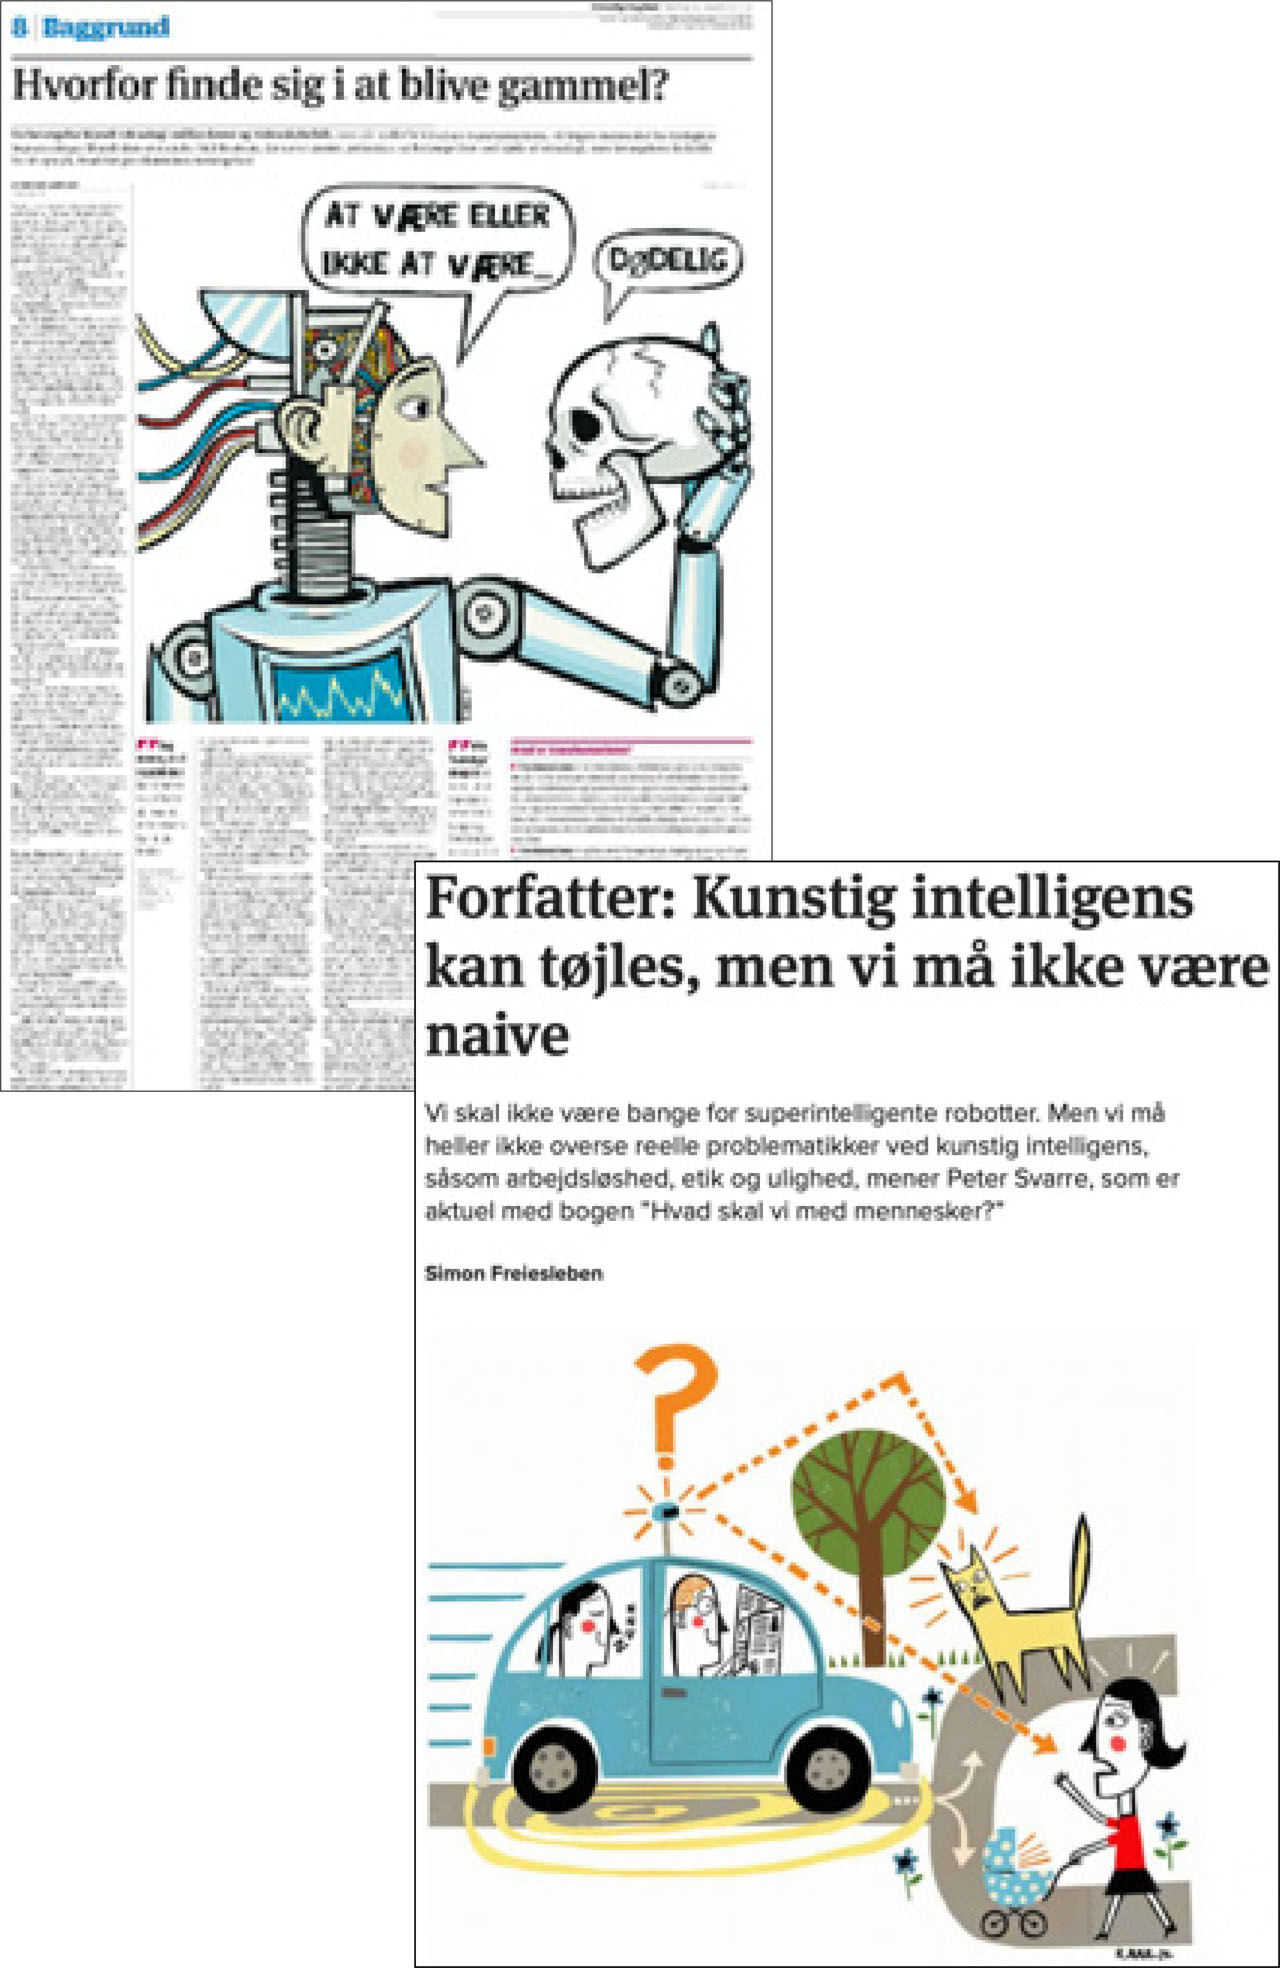
Figure 2
Facsimiles of two newspaper articles, 2010s
Source: Kristeligt Dagblad, 2017a (left), illustration by Rasmus Juul; Kristeligt Dagblad, 2019 (right), illustration by Rasmus Juul
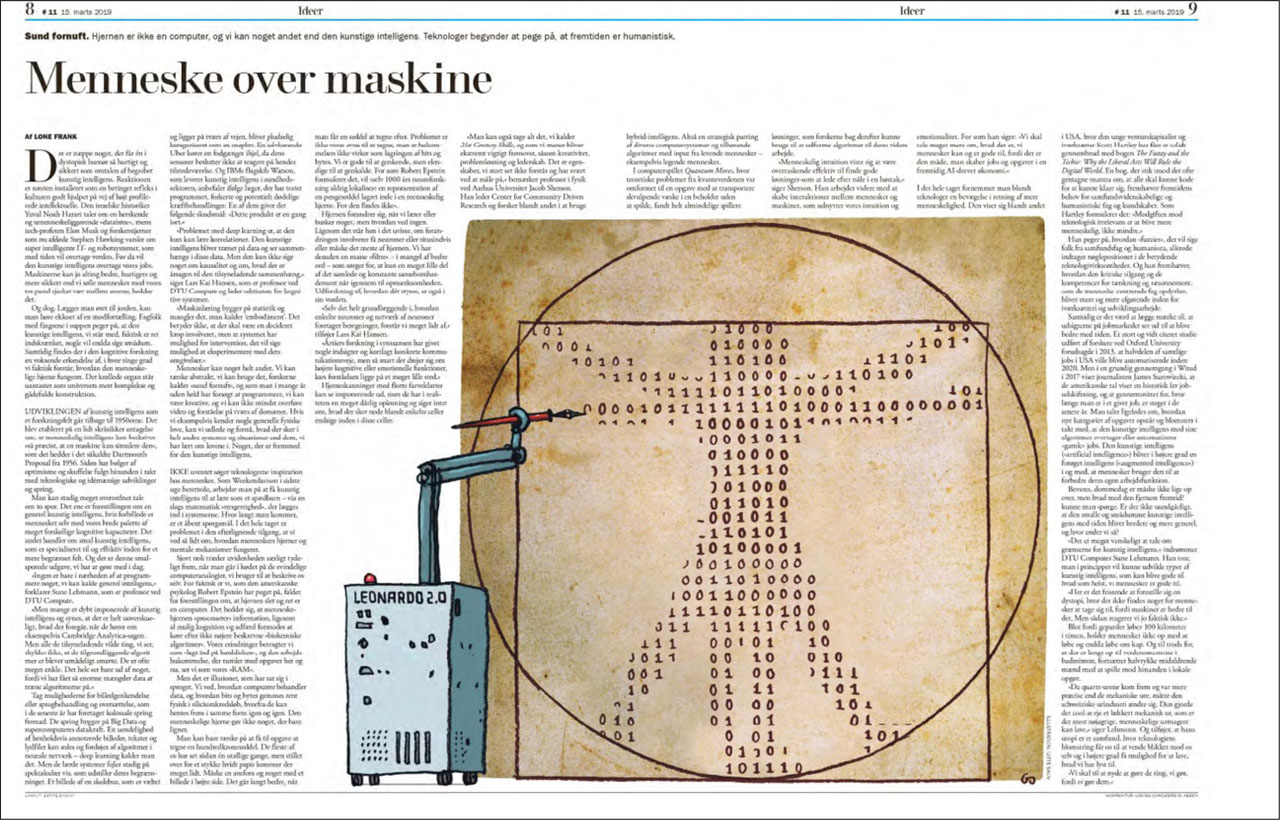
Figure 3
Facsimile of a newspaper article, 2010s
Source: Weekendavisen, 2019
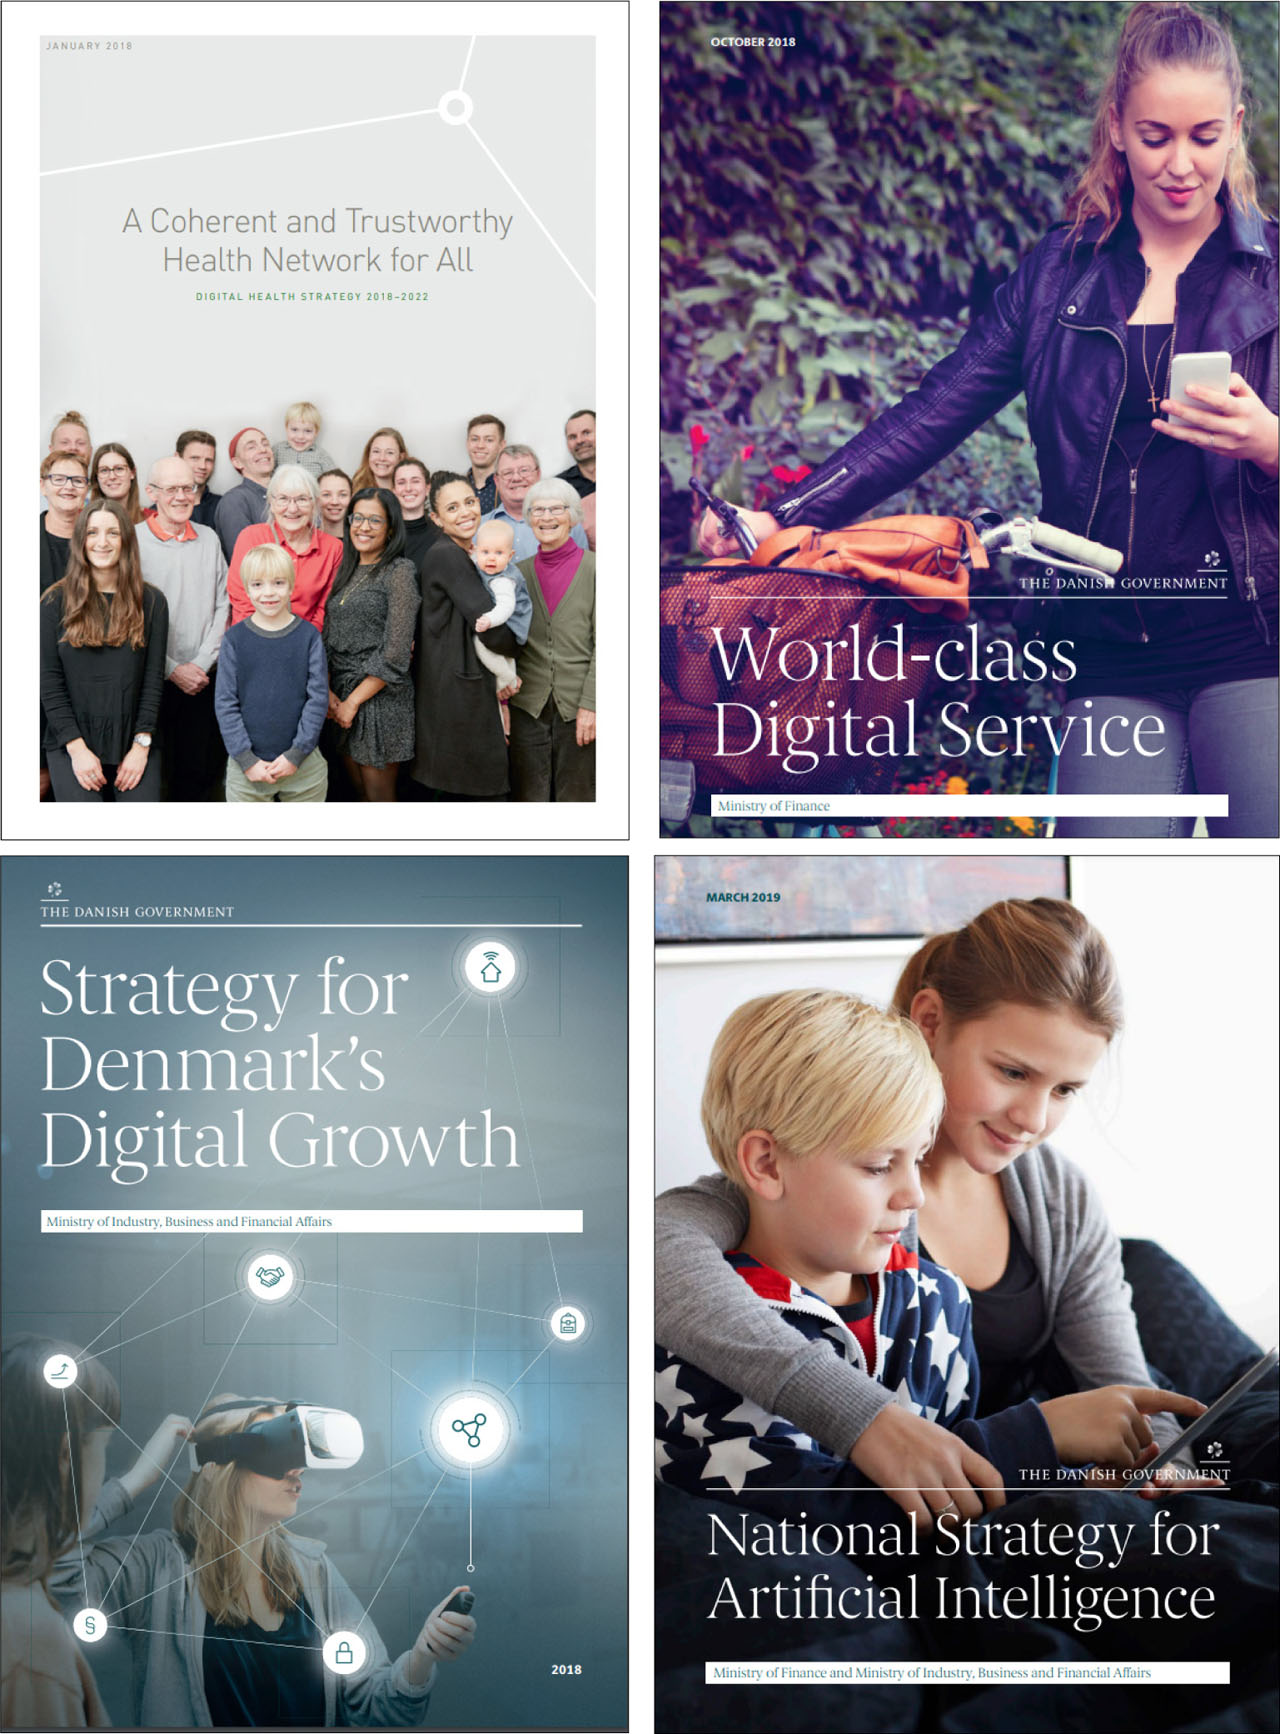
Figure 4
Cover pages of four official Danish AI strategies
Sources: Danish Government, 2018a (top left); Danish Government, 2018c (top right); Danish Government, 2018b (bottom left); Danish Government, 2019 (bottom right)