
1. Introduction
Ground-penetrating radar (GPR) is a non-destructive testing method that provides high positioning accuracy, fast acquisition, flexible deployment, and fine shallow-target resolution. It has been widely used to detect unknown objects in shallow subsurface layers [1]. Unlike airborne geophysical radar, GPR interrogates lossy and heterogeneous subsurface media. Its propagation behavior is strongly affected by dielectric dispersion, material heterogeneity, scattering, attenuation, and antenna–ground coupling, making realistic analysis considerably more complex [2]. With continuing advances in computing and antenna technology, GPR applications have expanded from military detection to underground pipeline inspection and tunnel-surface crack detection. Nevertheless, GPR waveforms are often ambiguous and susceptible to clutter from stones and other inclusions; therefore, reliably identifying cable signatures and distinguishing them from pipelines and rocks remains essential. Given its focus on the detection of energized underground cables, this work is primarily intended for electrical and power engineers, underground utility detection specialists, and excavation-safety professionals; it may also be of interest to applied physicists working on electromagnetic sensing and GPR signal interpretation.
Object detection is a central topic in computer vision, with applications in security monitoring, autonomous driving, traffic monitoring, and robot vision [3]. It typically aims to identify and localize instances of predefined object categories (e.g., people and vehicles) [4]. YOLO [5] is a widely used real-time detection framework that has evolved from a compact architecture into a modular system with successive architectural refinements. YOLOv8 is a widely adopted recent baseline. Depending on network depth and width, it includes YOLOv8n, YOLOv8s, YOLOv8m, YOLOv8l, and YOLOv8x [6]. Considering accuracy and model size, this paper improves upon YOLOv8s. The YOLOv8s detector is organized into Input, Backbone, Neck, and Head components [7]. The Backbone extracts features using modules such as Conv, C2f, and Spatial Pyramid Pooling Fast(SPPF); the Neck fuses multi-scale features into a feature pyramid; and the Head predicts categories and bounding boxes from multi-scale feature maps.
2. Preliminaries
A. Working principles of ground-penetrating radar
Ground-penetrating radar uses antennas to transmit and receive high-frequency electromagnetic pulses to detect subsurface objects and estimate their locations. As illustrated in Fig. 1, it is a non-destructive method: pulses are radiated into the ground, and when they encounter materials with contrasting electromagnetic properties, part of the energy is reflected to the surface, while refraction may also alter the propagation direction.
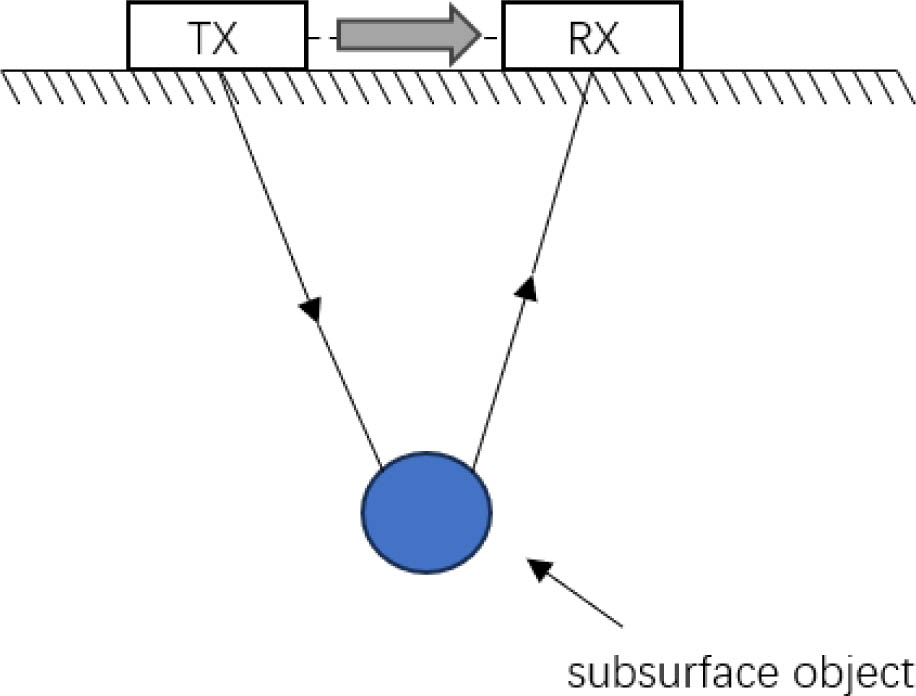
Fig. 1.
Diagram of the operating principle of GPR.
For a common-offset GPR configuration over a point-like target, the two-way travel time can be approximated by [8], [9]:
where h is the burial depth of the subsurface target measured from the ground surface, v is the propagation velocity of the electromagnetic wave in the subsurface medium, and x is the distance between the transmitting and receiving GPR antennas. Rearranging (1) yields the depth of the underground object:The propagation speed of electromagnetic waves in a medium depends on the relative permittivity and conductivity of the medium. In outdoor subsurface surveys, the ground is commonly soil, which often presents comparatively moderate obstruction to electromagnetic waves. In this case, the wave speed is mainly related to the relative permittivity of the soil and can be expressed as:
where c is the speed of light in free space, and ɛr is the relative permittivity (relative dielectric constant) of the medium. When the antenna offset is much smaller than the burial depth, (2) simplifies to:GPR characterizes subsurface targets using time–frequency signatures, reflection amplitudes, and two-way travel-time features [10], [11]. Its working principle is shown in Fig. 1.
B. Introduction to gprMax simulation software
gprMax is an open-source electromagnetic numerical simulation software for GPR. Its core uses the three-dimensional finite-difference time-domain (FDTD) method to solve Maxwell’s equations on a staggered grid, together with a perfectly matched layer (PML) absorbing boundary. It can perform forward modeling of ultra-wideband pulse propagation, reflection, and scattering in complex subsurface settings that include layered soils, buried targets, and rough interfaces. Its material models support common losses and dispersions (e.g., moist/saline soils), and the excitation may be chosen as a Gaussian or Ricker pulse. Outputs are stored in HDF5 format for post-processing and A-/B-scan imaging. For homogeneous, linear, and isotropic media, the time-domain Maxwell equations can be written as:
where ɛ = ɛ0ɛr and μ = μ0μr denote the permittivity (dielectric permittivity of the medium) and the magnetic permeability, respectively; the centered dot in D = ɛ · E denotes the scalar product multiplication with the vector product notation used above. Equation (5) holds for homogeneous, linear, and isotropic media.A gprMax forward model is defined through detailed configurations for the radar system, burial medium, target material, and geometry [12]. Accordingly, the commands in a typical simulation input file can be grouped into four parts:
Defining the size and spatial discretization of the simulation domain.
Defining the electromagnetic properties of the materials.
Defining the geometry and placement of materials in the domain.
Defining the waveform, frequency, and antenna scan path.
In addition, geometry-related outputs can be exported in the Visualization Toolkit (VTK) format and inspected with free viewers (e.g., ParaView) to verify that the model has been constructed as intended.
C. Overview of the YOLOv8 neural architecture
YOLOv8 is a modern real-time neural network model released by Ultralytics. It adopts an anchor-free, decoupled detection head and lightweight C2f modules to improve gradient flow and efficiency. The backbone and neck integrate SPPF and pyramid-based feature aggregation to enhance multi-scale representations. YOLOv8 supports object detection, instance segmentation, pose estimation, and classification, with tiered model sizes (n/s/m/l/x) balancing accuracy and latency. The standard training recipe includes strong data augmentation, cosine learning-rate scheduling, and exponential moving average (EMA) updates, while deployment is stream-lined through the Ultralytics application programming interface (API) with export options such as ONNX and TensorRT. In practice, YOLOv8 delivers a favorable accuracy–speed trade-off and a smooth pipeline from training to edge deployment. The model structure of YOLOv8 is shown in Fig. 2.
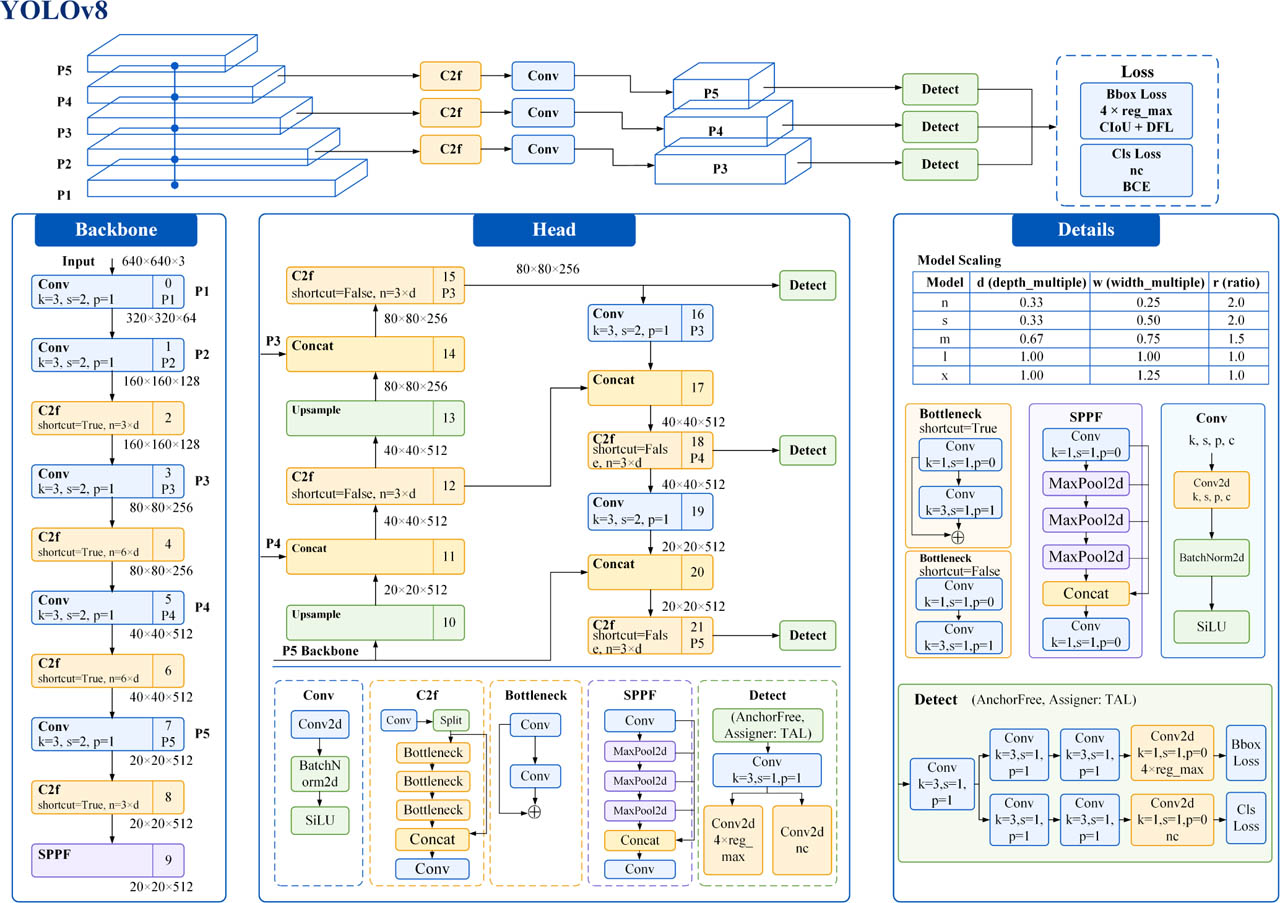
Fig. 2.
The model structure of YOLOv8.
3. Dataset establishment and improvement of the YOLO model algorithm
A. Development of a gprMax dataset containing live power cables
As a first step, a real-world-inspired subsurface scene is modeled in gprMax; the simulation scenario is described as follows. A reality-based simulation constructs a representative three-dimensional GPR scenario. The computational domain is (1 m × 1 m × 1 m) with a uniform spatial discretization of (dx = dy = dz = 5 mm), enabling the capture of both early- and late-time echoes at high operating frequencies. The subsurface is modeled as a multilayer medium from top to bottom: air at the top; beneath it, a dispersive and lossy “realistic” soil governed by the Peplinski mixing model, where fractal perturbations impose spatial heterogeneity to emulate natural variations in dielectric properties; followed by a second soil layer, with surface roughness superimposed near the interlayer boundary to relax the idealized planar interface and generate field-like multipath and scattering background in the radar records. Multiple utilities and cables are embedded: at greater depth, a concrete conduit of circular cross-section, and at shallower depth, two parallel plastic pipes, which produce the characteristic shallow cylindrical hyperbolic signatures. More importantly, at the model center, an cross-linked polyethylene (XLPE)-insulated power cable with a realistic concentric architecture is installed; from outer to inner, it comprises the outer sheath, metallic/conductive shield, outer semiconducting layer, XLPE insulation, inner semiconducting layer, and conductor core, thereby producing multilayer cylindrical interfacial reflections and internal scattering under high-frequency excitation. At the center, the cable branches along the x direction with the same concentric structure, forming an L-shaped bend that introduces pronounced corner scattering and polarization-dependent echoes. Additionally, randomly placed stones of varying sizes with rough surfaces, as well as subsurface voids, are included to more closely resemble field conditions. In Fig. 3, the translucent volume represents heterogeneous soil; the blue cylinders represent plastic pipes and concrete pipes at greater depths; the highlighted concentric target is an XLPE-insulated live cable; and the irregular inclusions represent rocks and voids.
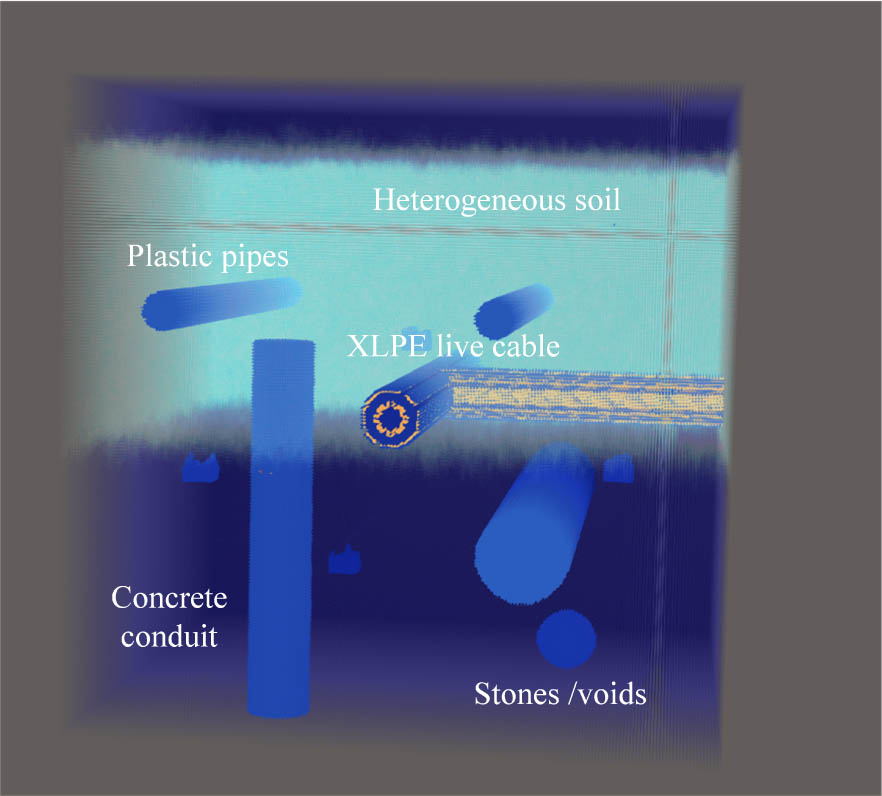
Fig. 3.
Ground-penetrating radar simulation scenario.
The source is a 600 MHz Ricker wavelet driving a z-oriented Hertzian dipole placed in air near the ground surface, with the receiver located ahead of it. Operating in a fixed-offset, collinear configuration, the antennas are synchronously advanced along x with a step of 0.02 m to acquire a B-scan at y = 0.65. This profile successively passes over/crosses the shallow plastic pipes at x = 0.15 and x = 0.65, traverses near the main cable at x = 0.5, and approaches a deeper concrete conduit farther to the right. As shown in Fig. 4, the B-scan displays the Ez component of the electric field (in V/m). The data exhibit a strong early surface reflection with roughness-induced clutter, clear hyperbolae from the shallow utilities, and responses from the concentric multilayer cable. A transmission-line model is incorporated to emulate an energized cable, resulting in multiple thin-layer reflections and dispersive trailing coda in the waveforms. Returns from the deeper concrete conduit arrive later and are more attenuated due to burial depth and dielectric loss.
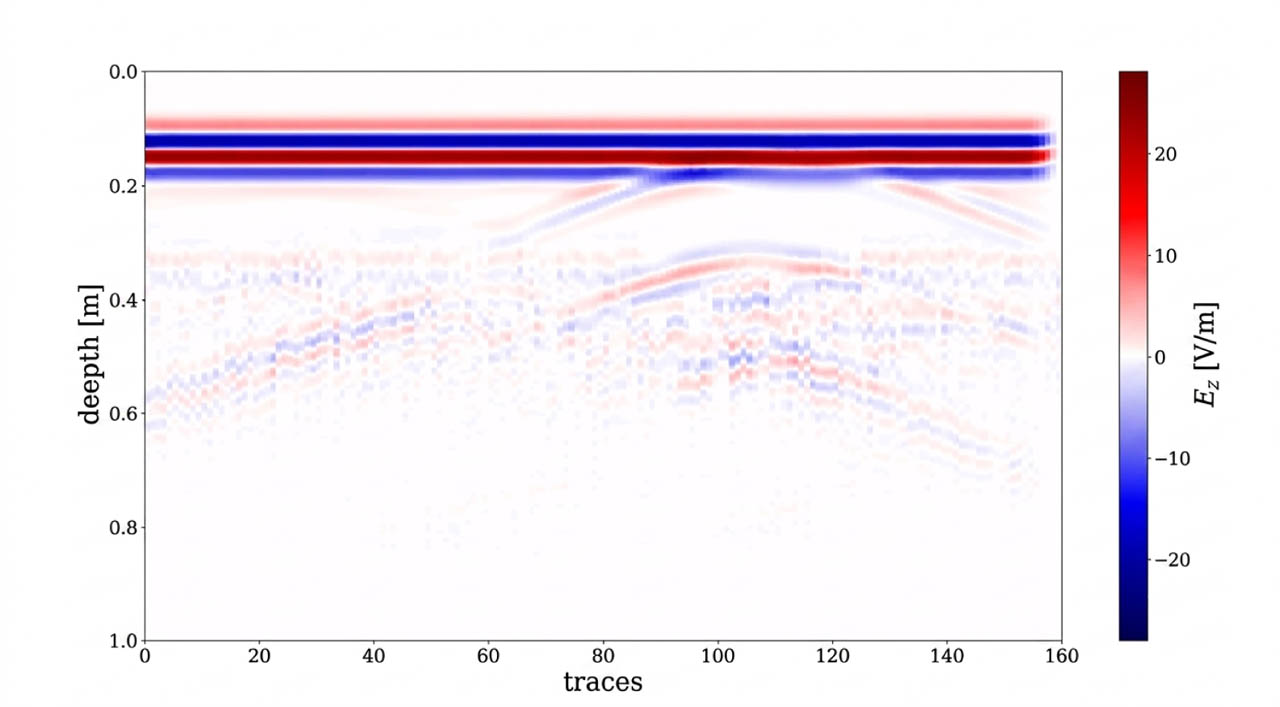
Fig. 4.
gprMax simulation waveform.
After conducting simulations based on real-world scenarios, the gprMax dataset was constructed. By setting various random pipe sizes and shapes, modifying the non-uniform medium content of the soil, and varying the size and position of the interference objects, a data enhancement strategy was implemented. At the same time, 500 B-scan data of simulated underground real scenarios were generated through a script file. Spatial enhancement was achieved by randomly rotating, scaling, and expanding the diversity of cable positions and sizes. Physical enhancement was based on random adjustments to the antenna frequency and the antenna’s position according to physical parameters. This simulated data could reflect the dynamic changes of the signal under real detection and under different underground conditions, narrowing the gap between the simulated and the real data and laying the foundation for improving the model’s generalization ability.
B. Improved GPM-YOLO model neural network structure
The ground-penetrating physics-aware modeling YOLO (GPM-YOLO) model was designed by adding a physics attention module and a multi-depth temporal fusion module to achieve precise identification of underground cables. In GPR images, cables exhibit two typical features: strong high-frequency reflections and low-frequency oscillations. The physics mechanism module separates and dynamically fuses these two types of features, allowing the model to focus on the unique electromagnetic responses of the cables and suppressing soil clutter and interference from other pipelines. The high-frequency branch extracts the strong reflection features of the metal core. The high electrical conductivity of the metal core causes strong reflection of electromagnetic waves at its surface, which appears as “high-amplitude wave peaks” in GPR images, corresponding to high-frequency edge features. This branch first reduces the number of channels in the feature map output by the backbone network to 128 through a 1 × 1 convolution, reducing the computational load while achieving feature dimensionality reduction; then it connects to a 3 × 3 convolution layer, with convolution kernels using edge detection operators, which enhance the edge changes of the reflection signal by calculating pixel gradients, highlighting the position information of the metal core. The feature extraction formula is
Fin represents the feature map output by the Backbone. The LeakyReLU activation function is used to introduce non-linearity and enhance the model’s expressive power. The low-frequency branch captures the periodic oscillation textures of the insulating layer. The difference in permittivity between the insulating layer and the soil causes electromagnetic waves to reflect multiple times within the insulating layer, forming “periodic stripes” that correspond to low-frequency features. This branch also first reduces the number of channels to 128 through a 1 × 1 convolution, then connects to a dilated convolution layer. The dilated convolution expands the receptive field to 7 × 7 by inserting zero values in the convolution kernel, enabling it to capture larger pixel correlations and effectively extract the periodic textures of the insulating layer. The feature extraction formula is
An attention weight α = σ (·) is then computed, where σ denotes the Sigmoid function. Based on the attention weights, the high-frequency and low-frequency features are fused. The fusion formula is
The larger the value of α, the greater the contribution of high-frequency features to recognition. Conversely, low-frequency features are more important. This enables adaptive feature selection across different scenarios.
A deep fusion module is further added to GPM-YOLO. Its core idea is to regard the signal distribution pattern along the depth direction as an “intrinsic time sequence” and, by modeling this temporal correlation, to enhance the recognition of cable features. The B-scan image is essentially a two-dimensional data matrix of “lateral position–depth” (denoted as I ∈ ℝH×W, where H is the number of pixels in the depth direction and W is the number of pixels in the lateral distance). For each lateral position w (1 ≤ w ≤ W), the depth-direction pixel sequence Sw = [s1,w, s2,w, ..., sH,w] contains the evolution of the cable reflection signal with depth: when the lateral position passes over the top of the cable, the depth sequence exhibits a strong reflection peak; as the lateral position moves sideways, this peak shifts deeper. The traditional YOLO model only extracts local spatial features and ignores this depth-sequence correlation, making it difficult to capture the full hyperbolic shape, leaving it prone to missed detections in the presence of attenuation or noise.
The feature structure decomposition converts the feature maps output by the backbone network into a deep sequence form. Let the feature map of a certain scale output by the YOLO backbone network be F ∈ ℝC×H×W (C is the number of channels, H and W correspond to the depth and lateral directions of the feature size), and the module first splits F along the lateral position to obtain W independent “depth feature sequences”: Fw ∈ ℝC×H (w = 1, 2, ...,W). Each FW contains the multi-channel features of all depths at that lateral position. The shallow channels may capture the edge details of the reflected signal, while the deep channels may encode the overall trend of the reflection intensity. This decomposition converts the two-dimensional feature map into a series of one-dimensional depth sequences, laying the foundation for subsequent temporal modeling.
Deep sequence modeling captures the evolution patterns in the depth direction using recurrent neural networks. Due to the unidirectional nature of electromagnetic wave propagation underground, a unidirectional long short-term memory (LSTM) is used to model this sequence: hw,h = LSTM( fw,h, hw,h−1), where fw,h is the hidden state of the LSTM at the h-th depth, and hw,0 is the initial zero vector. The gating mechanism of LSTM can automatically filter out key information – when a strong reflection signal occurs at depth h, the input gate will enhance the weight of this feature, the forget gate will weaken the interference of shallow non-key features, and ultimately hw,h contains the cumulative evolution information from shallow to deep (1 → h), such as the peak position of the reflection intensity, decay rate, etc. After processing by LSTM, the depth sequence at each lateral position is transformed into a hidden state sequence Hw = [hw,1, hw,2, ..., hw,H], fully retaining the feature correlations along the depth direction.
The key to effectively identifying the deep features is the depth information. The contributions of different depths in cable identification vary significantly. The module introduces attention weights to weight and fuse the hidden state sequence HW : Firstly, the importance score of each hidden state is calculated through a multi-layer perceptron (MLP), the formula is as follows
where MLP consists of two fully connected networks, and outputs a one-dimensional score; then, the scores are normalized to weights using the Softmax function, ensuring that the sum of the weights is 1, the formula is as followsFinally, the weighted fusion obtains the depth-aggregated feature of this lateral position:
All the of the lateral positions are reorganized into a spatial feature map F′ ∈ ℝC×W (with dimensions of C × W); to supplement the spatial correlation in the lateral direction, F′ is processed through a 1 × H convolution layer (with a convolution kernel size of 1 × H and a stride of 1) to match the dimensions of the original feature map F (transformed into C × H × W), and then added element-wise with F to obtain the final “spatial-depth” joint feature map Ffusion ∈ ℝC×H×W. This retains the spatial details of the original features while incorporating temporal correlation information from the depth sequence, enabling the output features to depict the cable’s lateral position distribution and reflect its morphological changes along the depth direction. The final GPM-YOLO network structure is shown in Fig. 5.
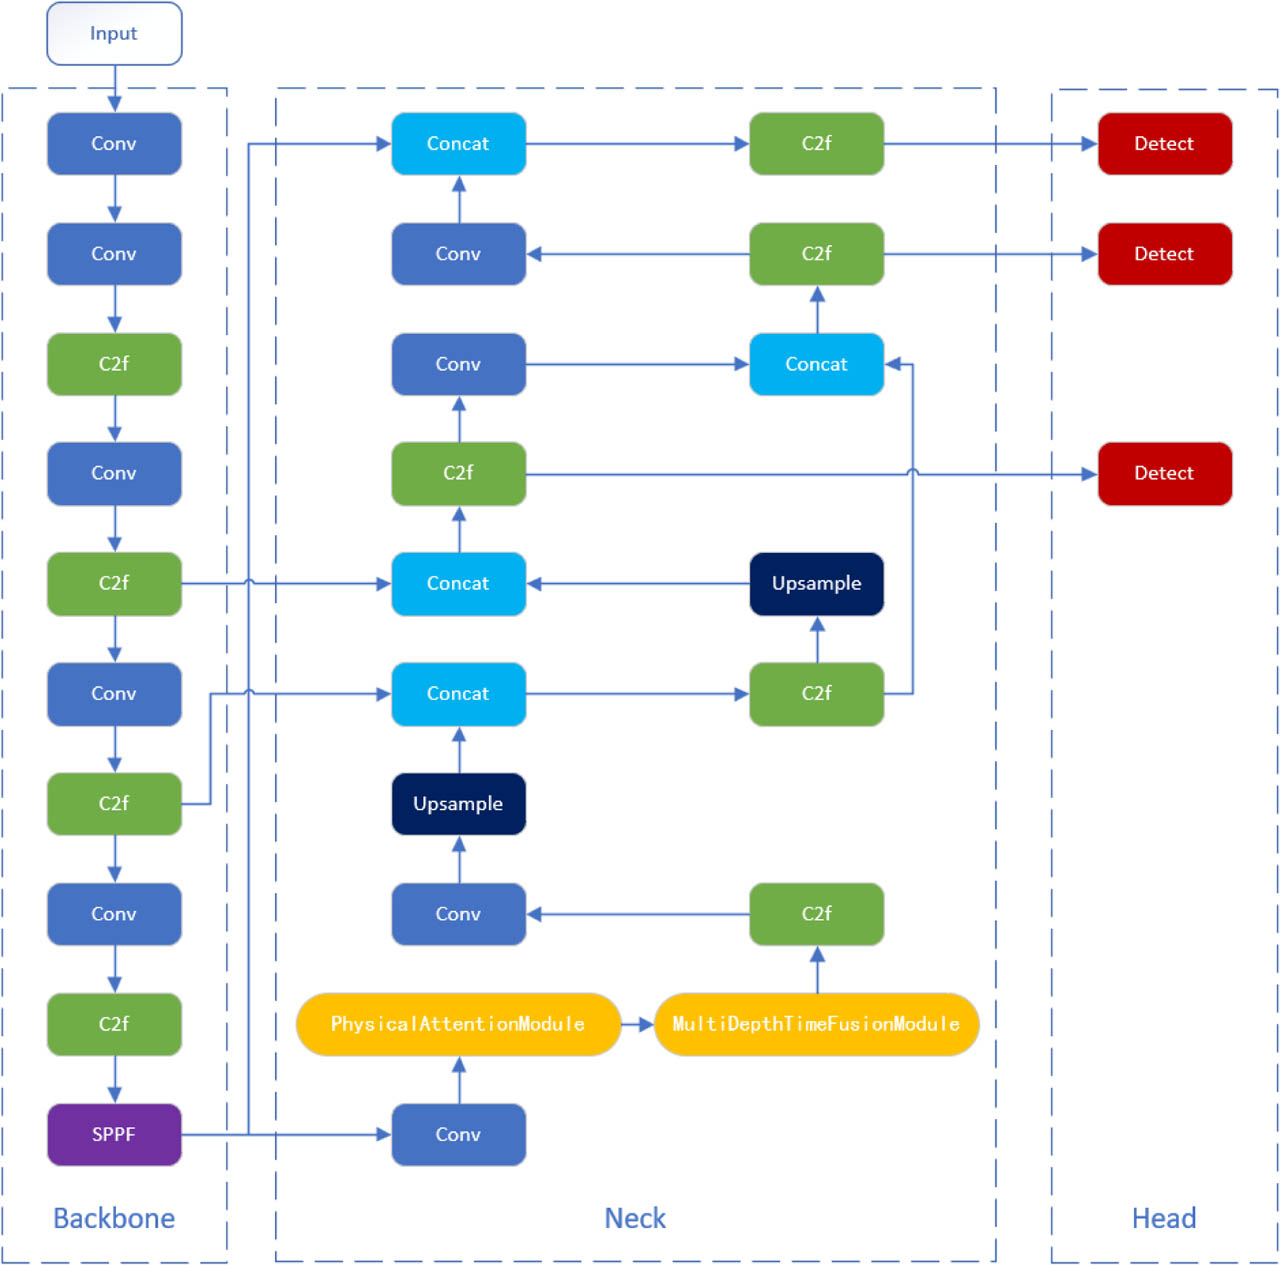
Fig. 5.
Network structure of the proposed GPM-YOLO model.
C. Identification results and verification
The detector is evaluated with “cable” as the single fore-ground class; all remaining image regions are treated as background rather than as a second object class. The model achieves an AP@0.5 of 0.979 for the cable class. Because the dataset contains only one foreground class, the corresponding mAP@0.5 is also 0.979. Fig. 6 presents the precision–recall (PR) curve: each point represents a different confidence threshold, with recall generally increasing as the threshold is lowered, while precision may decrease because more false positives are admitted. The area under this curve is the average precision (AP). The curve remains near the upper-right region over most of the recall range, indicating that GPM-YOLO maintains high precision while detecting most cable instances.
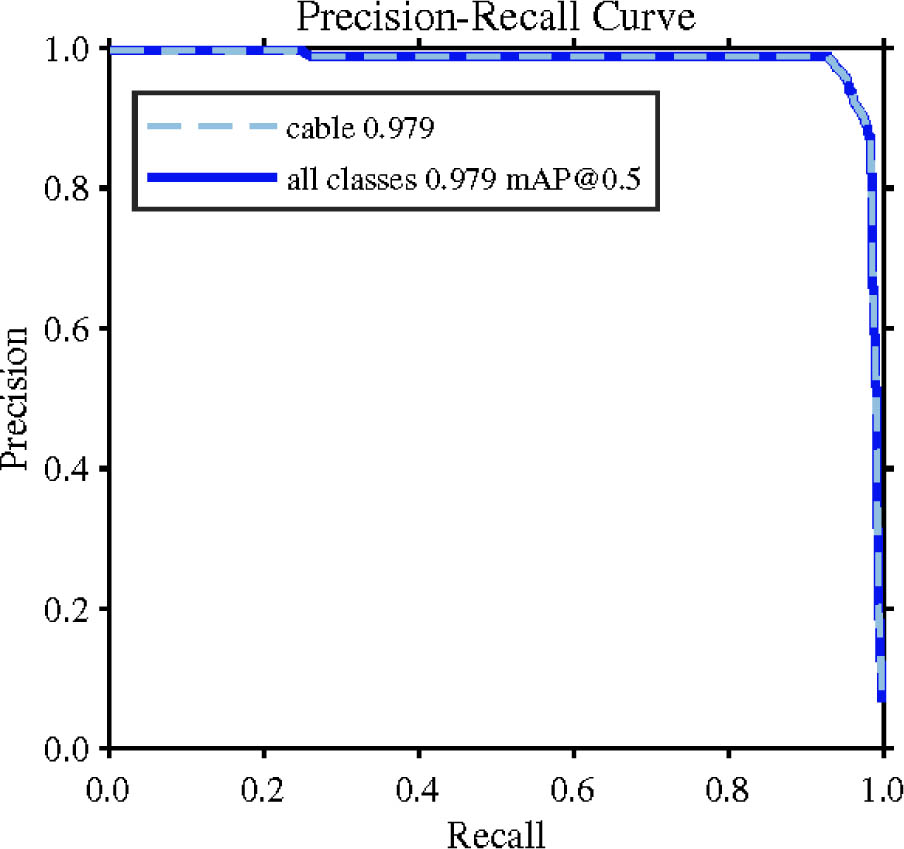
Fig. 6.
Precision–recall curve of the GPM-YOLO model.
Based on the overall convergence trend of the training process, the model shows a clear and stable optimization trajectory within the training period of 500 epochs. The core loss indicators during the training stage include bounding box loss, classification loss, and distribution focus loss. All of them gradually decrease from the initial high values and eventually stabilize. Among them, the decrease in classification loss is the most significant, indicating that the model has the highest learning efficiency for category features and can quickly grasp the category differences between cable and background. At the same time, the loss indicators during validation decrease in step with the training loss, and the gap remains small. This phenomenon indicates that the model does not have a significant overfitting problem during the training process, has a good adaptability to the data, and has reliable generalization performance.
The precision rate, recall rate, average precision (mAP50), and multi-threshold average precision (mAP50-95) all continue to rise during the training process and stabilize in the later stage, proving that the model gradually improves the feature extraction and target localization capabilities during training, and finally reaches a stable and efficient detection state. In addition, the learning rate decay strategy adopted during training is reasonable. The learning rate gradually decreases linearly from its initial value, effectively avoiding parameter oscillations in later training stages and further improving the stability of the training process and the reliability of the final performance. The overall training trend of the model is shown in Fig. 7.
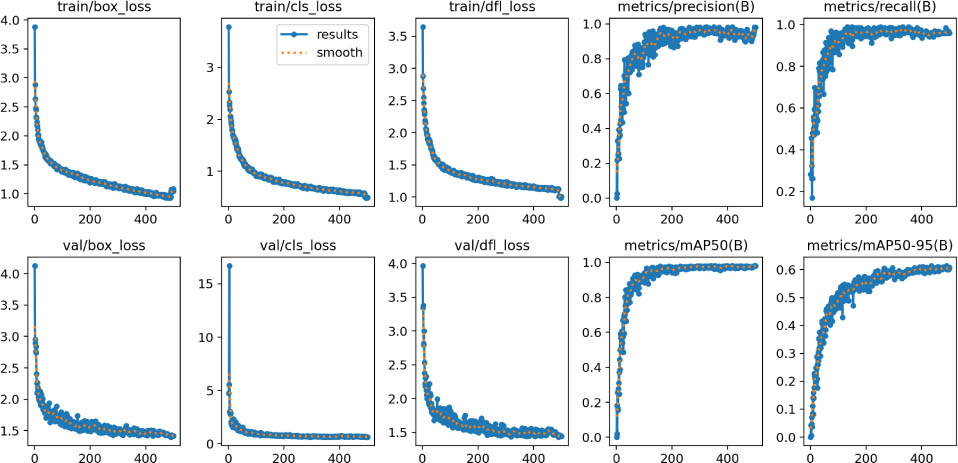
Fig. 7.
The training trend of the GPM-YOLO model.
As shown in Fig. 8, compared with the general YOLOv8 model, the improved GPM-YOLO model clearly demonstrates a significant performance advantage in the cable recognition task. Its recognition accuracy and precision have been significantly improved. From the three sets of comparison samples, whether in the typical scenes with clear textures (the first row), or in the complex scenes with more background noise and relatively weak cable features (the second row and the third row), the recognition confidence of the “cable” target by the GPM-YOLO model (0.85, 0.75, 0.67, respectively) is higher than that of the corresponding confidence of the YOLO model (0.84, 0.70, 0.64). This difference reflects that GPM-YOLO is more robust in feature extraction and category determination, and can more reliably capture the essential features of the cable target.
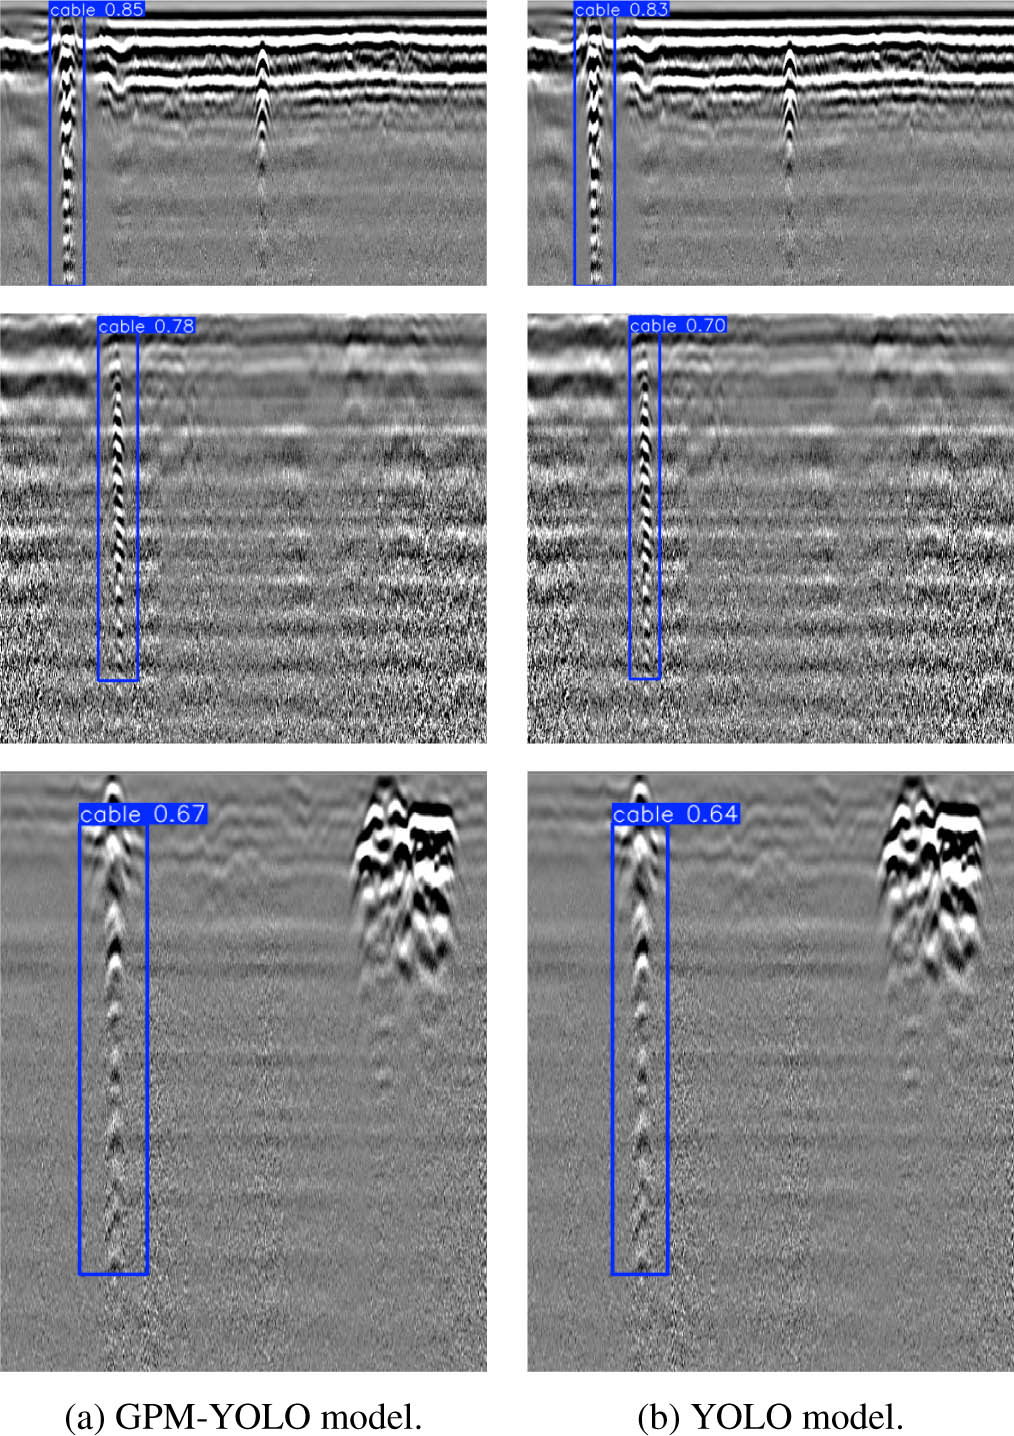
Fig. 8.
Comparison of GPM-YOLO with the YOLO model.
From the positioning effect of the bounding box and the presentation of target details, the detection box of the GPM-YOLO model fits the shape contour of the cable more closely. Even when the texture of the cable is blurred due to imaging or environmental factors (such as the second and third row images), its recognition of the target can still maintain a high integrity, effectively reducing misjudgment or positioning deviation caused by feature blurring; while the recognition results of the general YOLO model in similar scenes, whether in terms of confidence or the accuracy of the bounding box, have different degrees of attenuation. This performance difference stems from the GPM module’s enhancement of multi-scale and weak semantic features, enabling it to efficiently extract discriminative features of the cable target in complex scenes and thereby achieve higher recognition accuracy.
The GPM-YOLO model demonstrates significant recognition performance advantages compared with the general YOLOv8 model. Improvements in confidence and bounding box positioning accuracy verify the effectiveness of the proposed improvement strategy, providing a more reliable model for detection tasks involving small targets or weak features.
To verify the recognition performance of the GPM-YOLO model in real underground environments for buried cables, we constructed a physical experimental setup that closely resembled the actual engineering scenario. The experiment was conducted in an outdoor open area. First, an excavator and a shovel were used to dig a square pit with dimensions of 1.5 m × 1.5 m. The pit depth was controlled at 0.8 m. The walls and bottom of the pit were smoothed to avoid additional interference from uneven soil structure. After the pit body is prepared, a copper-core power cable that meets national standards is selected as the target object. The outer layer is a black insulating sheath. It is laid flat at the center of the pit bottom, ensuring the cable is not bent or overlapped. Both ends extend along the pit wall to the ground and are marked and fixed to simulate the burial state of the cable in the actual project.
During the backfilling stage, a layered compaction technique is employed: First, the excavated cohesive soil from the original pit is filled in, and stones, grass roots, and other debris are removed. Each layer is controlled to be within 20 cm in thickness, and it is repeatedly compacted using a flat-tipped shovel. After the entire area is backfilled to be level with the ground, the surface soil is finely leveled with a shovel to ensure there are no obvious protrusions or depressions, thereby minimizing radar-wave reflection noise from loose soil and providing a stable physical environment for subsequent exploration. Fig. 9 shows a field test scenario in which an operator is using the BD-GPR-400 to detect buried cables beneath the surface.
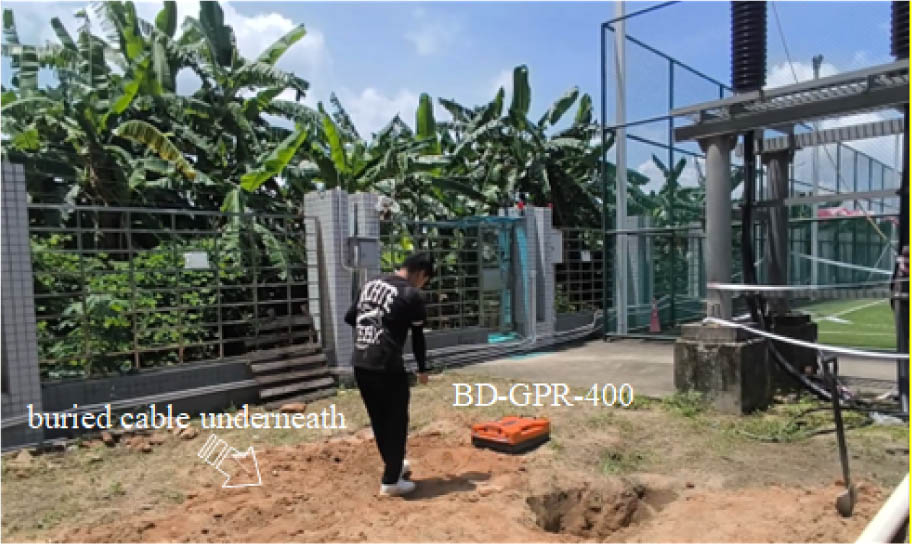
Fig. 9.
Underground cable in actual scenarios.
For the detection stage, the BD-GPR-400 ground-penetrating radar produced by Wuhan Wave Technology Co., Ltd. was selected. This equipment employs pulse radar technology, with a working frequency of 400 MHz, and is equipped with a wide-band antenna, enabling high-resolution detection of the underground medium from 0 to 3 meters. During the detection process, the operator performed a uniform grid scan within a 1-meter by 1-meter rectangular area above the pit, ensuring spatial continuity in data collection. The radar host recorded the reflection waveform data of the underground medium in real time. The entire scanning process lasted approximately 30 minutes, and finally, a complete radar data matrix covering the area was obtained. The original radar waveforms obtained through measurement are first subjected to pre-processing operations, such as noise reduction and filtering, to reduce interference from environmental noise. Then they are input into the GPM-YOLO model for target recognition. The recognition results are shown in Fig. 10.
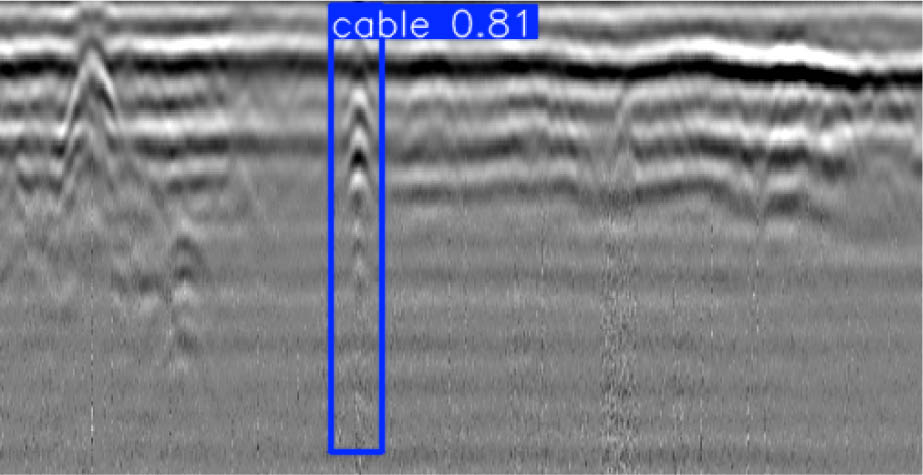
Fig. 10.
The recognition results of the GPM-YOLO model.
The model not only accurately locates the cable, but also produces detection boxes that closely match the actual spatial position of the cable. Moreover, recognition confidence is generally maintained above 0.8, and in some typical areas, it even reaches 0.95, significantly outperforming the recognition performance of the general YOLOv8 model. Based on statistical results from multiple sets of measured data, the recognition accuracy of the GPM-YOLO model for buried cables remains above 92 %. It can still maintain good robustness under interference conditions, such as changes in soil humidity and small fluctuations in cable burial depth, thereby fully demonstrating its accuracy and reliability in underground target recognition.
The measured data obtained after model identification provided crucial support for the subsequent verification of the application value of the GPM-YOLO model in engineering scenarios. The scene construction process replicated actual cable burial scenarios, including details such as soil compactness and cable laying conditions, ensuring consistency of the experimental environment with real working conditions. This enabled the recognition performance of the model in this scenario to directly reflect its application potential in real-world engineering, laying a solid empirical foundation for further promoting the practical application of this model.
4. Conclusion
This paper presented GPM-YOLO, a live underground cable detection framework that couples realistic gprMax simulation with physics-aware feature fusion and depth-sequence modeling on YOLOv8s. A heterogeneous subsurface dataset was constructed by embedding XLPE live cables, conduits, pipes, stones, and voids, thereby reducing the simulation–reality gap for supervised training. The physics attention module adaptively fuses high-frequency metal-core reflections and low-frequency insulation oscillations, while the depth-sequence module enhances weak deep responses along the B-scan depth axis. Experiments on the simulated dataset and a controlled field test with a BD-GPR-400 system show improved confidence, localization quality, and robustness relative to the baseline YOLO detector, with field recognition accuracy remaining above 92 % under moderate soil-moisture and burial-depth variations. The results indicate that combining physically consistent simulation with physically interpretable network modules is an effective route toward reliable energized-cable detection for power-utility engineering practice. Future work will expand multi-site field datasets, quantify uncertainty under stronger clutter, and further optimize real-time deployment on portable GPR platforms.
Acknowledgment
This research was supported by the Science and Technology Project of China Southern Power Grid Co., Ltd. (Grant No. GDKJXM20240674).