
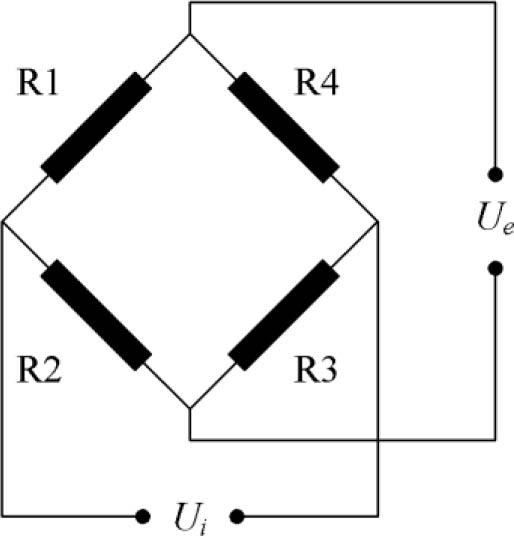
Fig. 1.
The Wheatstone bridge.
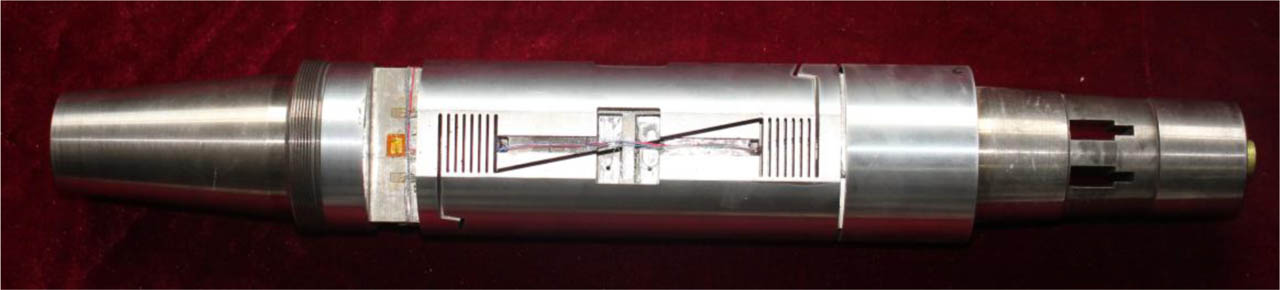
Fig. 2.
Photograph of the investigated balance.
Table 1.
Design loads for the investigated balance.
| Component | Fy [N] | Mz [N·m] | Fx [N] | Mx [N·m] | Fz [N] | My [N·m] |
|---|---|---|---|---|---|---|
| Design load | 18000 | 1800 | 1500 | 1200 | 4000 | 1200 |
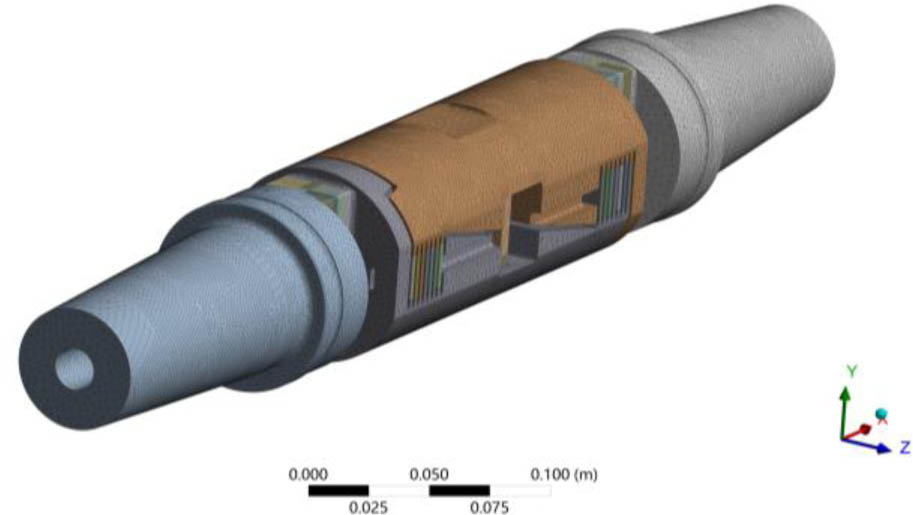
Fig. 3.
FEA mesh of the investigated balance.
Table 2.
The VC matrix of the investigated balance.
| Component | Fy | Mz | Fx | Mx | Fz | My |
|---|---|---|---|---|---|---|
| Csen | 12236.95 | 1379.64 | 3506.15 | 2638.97 | 5350.37 | 603.80 |
| Fy | 0 | 0.0004275 | 0.0222331 | −0.0001753 | −0.000006 | 0.0000006 |
| Mz | 0.0130928 | 0 | −0.0229588 | −0.0008566 | −0.0000507 | 0.0000066 |
| Fx | −0.0038566 | 0.0000002 | 0 | 0.0000015 | −0.0000023 | 0.0000003 |
| Mx | 0.0008202 | 0.0000622 | 0.001513 | 0 | −0.0002015 | 0.0043991 |
| Fz | 0.0000904 | 0.000006 | −0.000049 | −0.0007502 | 0 | 0.0000102 |
| My | −0.000352 | −0.0000829 | −0.0012826 | −0.1637126 | −0.0008886 | 0 |
| Fy*Fy | 0.00E+00 | 7.94E–10 | 9.00E–08 | −3.50E–11 | 1.46E–10 | 1.46E–12 |
| Mz*Mz | 1.21E–07 | 0.00E+00 | −6.20E–06 | −3.57E–09 | −1.14E–08 | −1.77E–09 |
| Fx*Fx | −5.31E–09 | −8.31E–10 | 0.00E+00 | −1.66E–11 | −3.10E–10 | −3.50E–11 |
| Mx*Mx | 4.91E–06 | −4.58E–07 | −2.80E–05 | 0.00E+00 | 4.36E–09 | 3.17E–10 |
| Fz*Fz | −8.43E–09 | −1.53E–10 | 1.56E–07 | 1.75E–10 | 0.00E+00 | 1.18E–10 |
| My*My | 1.71E–06 | −2.99E–07 | 3.35E–06 | 1.08E–09 | 8.23E–08 | 0.00E+00 |
| Fy*Mz | 6.96E–09 | 6.36E–09 | 1.27E–06 | −6.90E–10 | −1.27E–09 | 1.64E–10 |
| Fy*Fx | 1.64E–08 | −7.12E–09 | 8.65E–07 | 1.45E–09 | −3.23E–09 | −1.29E–11 |
| Fy*Mx | 3.81E–09 | −6.22E–10 | 2.41E–08 | −7.98E–08 | 1.96E–06 | 1.64E–07 |
| Fy*Fz | 6.26E–10 | −1.45E–10 | −8.48E–11 | −1.09E–08 | −3.21E–09 | −5.60E–10 |
| Fy*My | 1.06E–08 | −2.21E–09 | −3.97E–09 | 2.80E–07 | −1.97E–07 | −3.23E–08 |
| Mz*Fx | −1.27E–06 | 1.94E–07 | −1.82E–07 | 1.45E–08 | 1.40E–08 | 2.52E–09 |
| Mz*Mx | −7.10E–08 | 9.59E–09 | 4.58E–08 | −4.76E–07 | −1.33E–05 | −1.98E–06 |
| Mz*Fz | 6.26E–09 | −4.00E–10 | 3.85E–09 | 2.18E–07 | −1.43E–07 | −8.15E–09 |
| Mz*My | −6.54E–08 | 4.22E–09 | −1.98E–08 | 4.63E–06 | 6.34E–07 | −7.66E–09 |
| Fx*Mx | 8.29E–09 | −6.48E–10 | −3.25E–08 | −1.58E–08 | −1.89E–07 | −2.18E–08 |
| Fx*Fz | 1.51E–09 | 5.69E–11 | −4.87E–09 | 2.52E–09 | −7.28E–08 | 1.72E–08 |
| Fx*My | 1.10E–08 | 6.32E–11 | 8.57E–09 | 4.94E–09 | 2.06E–06 | 2.84E–07 |
| Mx*Fz | −1.98E–06 | −6.51E–08 | 2.35E–07 | −1.64E–09 | 8.28E–09 | 9.96E–10 |
| Mx*My | −4.26E–05 | 6.91E–06 | 3.20E–05 | 1.50E–06 | 2.04E–08 | 5.51E–09 |
| Fz*My | 3.13E–07 | −1.33E–08 | −2.05E–06 | 1.24E–06 | 4.60E–09 | 2.94E–09 |
Table 3.
The SC matrix of the investigated balance.
| Component | Fy | Mz | Fx | Mx | Fz | My |
|---|---|---|---|---|---|---|
| Csen | 11922.80 | 1347.85 | 3332.67 | 2568.62 | 5228.89 | 589.48 |
| Fy | 0 | 0.000039 | 0.023591 | −0.000442 | 0.00341 | −0.00033 |
| Mz | 0.012108 | 0 | −0.023699 | −0.001481 | 0.031882 | −0.00421 |
| Fx | −0.004616 | −0.000054 | 0 | −0.000142 | 0.00025 | −0.000064 |
| Mx | 0.013668 | 0.002606 | 0.003022 | 0 | −0.007704 | −0.003265 |
| Fz | 0.007823 | −0.001112 | −0.001461 | 0.000561 | 0 | 0.000723 |
| My | 0.046364 | −0.010228 | −0.003349 | −0.160641 | 0.022733 | 0 |
| Fy*Fy | 0.00E+00 | 1.48E–09 | 1.16E–07 | 0.00E+00 | 8.63E–09 | 0.00E+00 |
| Mz*Mz | 9.22E–07 | 0.00E+00 | −5.63E–06 | −9.33E–08 | 1.14E–07 | 3.07E–08 |
| Fx*Fx | −1.54E–07 | 8.53E–09 | 0.00E+00 | 0.00E+00 | −9.21E–08 | 6.00E–09 |
| Mx*Mx | −2.52E–06 | 9.03E–08 | −2.75E–05 | 0.00E+00 | 3.90E–07 | 8.96E–08 |
| Fz*Fz | −7.88E–08 | 6.68E–09 | 1.72E–07 | 5.66E–09 | 0.00E+00 | 3.24E–09 |
| My*My | 8.30E–07 | −1.21E–07 | 3.54E–06 | −1.63E–08 | −5.79E–07 | 0.00E+00 |
| Fy*Mz | 2.22E–07 | −2.51E–08 | 1.36E–06 | −5.72E–08 | 1.52E–07 | −1.47E–08 |
| Fy*Fx | −2.24E–07 | 2.53E–08 | 8.94E–07 | 3.04E–09 | −1.84E–08 | 2.22E–09 |
| Fy*Mx | −2.60E–08 | 2.84E–07 | −4.76E–08 | −2.67E–07 | 2.19E–06 | 2.64E–07 |
| Fy*Fz | 0.00E+00 | 0.00E+00 | 0.00E+00 | 0.00E+00 | 0.00E+00 | 0.00E+00 |
| Fy*My | 0.00E+00 | 0.00E+00 | 0.00E+00 | 0.00E+00 | 0.00E+00 | 0.00E+00 |
| Mz*Fx | −1.29E–07 | 2.35E–07 | −3.91E–07 | −4.01E–08 | 3.38E–07 | 6.01E–10 |
| Mz*Mx | 9.44E–07 | −2.05E–07 | 6.60E–07 | −1.23E–06 | −5.32E–06 | −6.91E–07 |
| Mz*Fz | 0.00E+00 | 0.00E+00 | 0.00E+00 | 0.00E+00 | 0.00E+00 | 0.00E+00 |
| Mz*My | 0.00E+00 | 0.00E+00 | 0.00E+00 | 0.00E+00 | 0.00E+00 | 0.00E+00 |
| Fx*Mx | 5.84E–07 | 5.66E–08 | −1.93E–07 | 1.25E–07 | 8.95E–07 | −2.51E–07 |
| Fx*Fz | −8.84E–08 | −2.87E–09 | −3.11E–08 | −2.98E–08 | −1.08E–07 | −3.95E–08 |
| Fx*My | 7.48E–07 | 7.17E–08 | −4.62E–07 | 2.25E–07 | 1.35E–06 | 4.26E–07 |
| Mx*Fz | −6.13E–07 | 3.43E–07 | 1.62E–06 | −3.65E–07 | 3.36E–07 | 9.47E–08 |
| Mx*My | −3.00E–06 | 1.79E–07 | 3.14E–05 | −1.17E–07 | −2.56E–07 | −6.27E–07 |
| Fz*My | 3.37E–07 | −2.93E–08 | −2.17E–06 | 3.60E–08 | −1.09E–06 | −1.62E–07 |
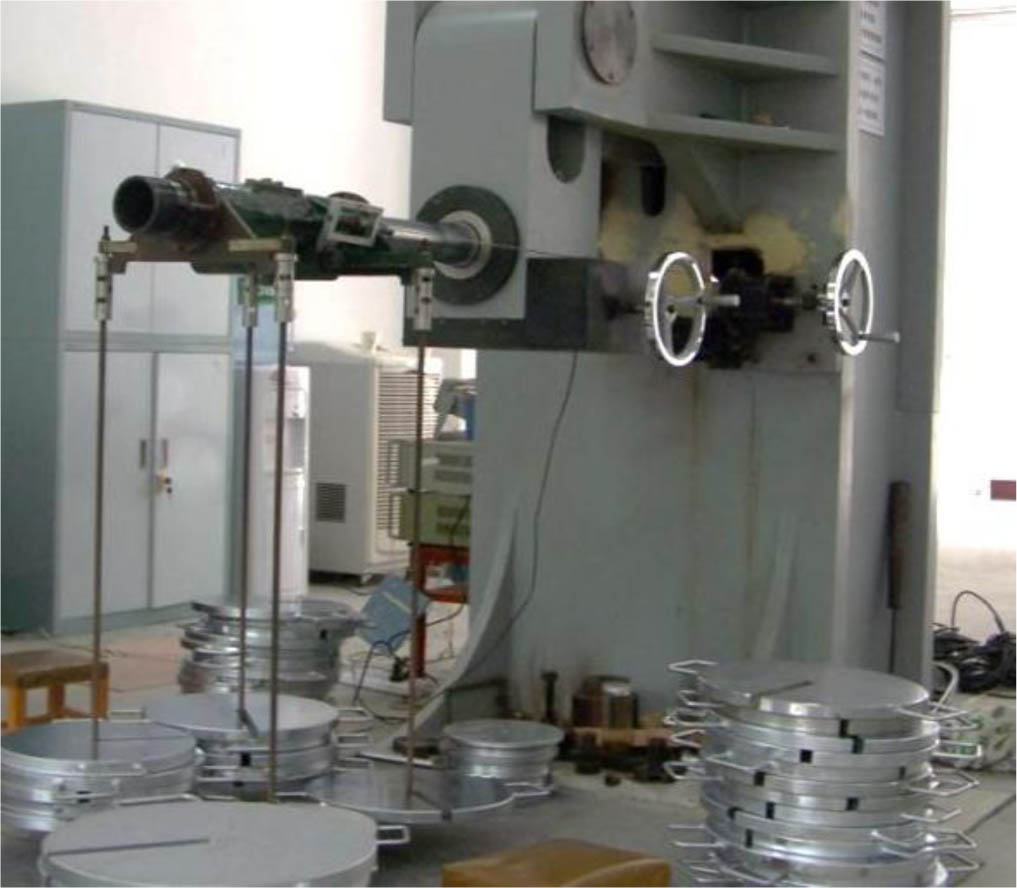
Fig. 4.
The SC setup for the investigated balance.
Table 4.
Comparison of sensitivity coefficients.
| Component | Fy | Mz | Fx | Mx | Fz | My |
|---|---|---|---|---|---|---|
| VC [N/(mV/V) or N·m/(mV/V)] | 12236.95 | 1379.64 | 3506.15 | 2638.97 | 5350.37 | 603.80 |
| SC [N/(mV/V) or N·m/(mV/V)] | 11922.80 | 1347.85 | 3332.67 | 2568.62 | 5228.89 | 589.48 |
| Relative error [%] | 2.6 | 2.4 | 5.2 | 2.7 | 2.3 | 2.4 |

Fig. 5.
The schematic diagram of the strain gauge bonding position on the investigated balance.
Table 5.
Comparison of first-order linear terms between the VC and SC matrices.
| Component | Fy | Mz | Fx | Mx | Fz | My |
|---|---|---|---|---|---|---|
| VC [% FS] | 0.10 | 0.43 | 23.93 | −17.01 | −0.04 | 0.45 |
| SC [% FS] | 0.66 | −0.72 | 25.05 | −16.78 | 3.43 | −1.22 |
| Differences [% FS] | −0.56 | 1.15 | −1.12 | −0.23 | −3.47 | 1.67 |
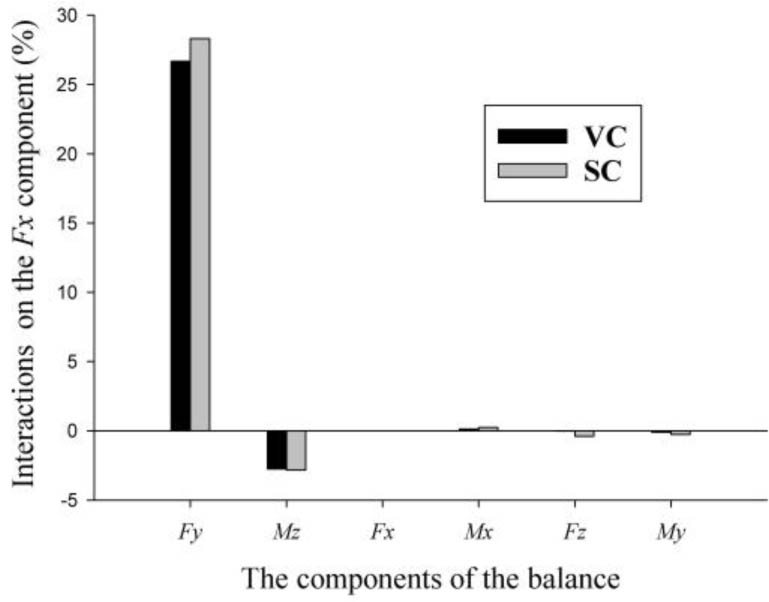
Fig. 6.
First-order linear interactions on the Fx component.
Table 6.
Comparison of quadratic interactions.
| Component | Fy | Mz | Fx | Mx | Fz | My |
|---|---|---|---|---|---|---|
| VC [% FS] | 0.05 | −0.05 | −1.59 | 0.00 | 0.01 | 0.00 |
| SC [% FS] | −0.01 | 0.03 | −0.84 | −0.02 | 0.07 | 0.02 |
| Differences [% FS] | 0.06 | −0.08 | −0.75 | 0.02 | −0.06 | −0.02 |
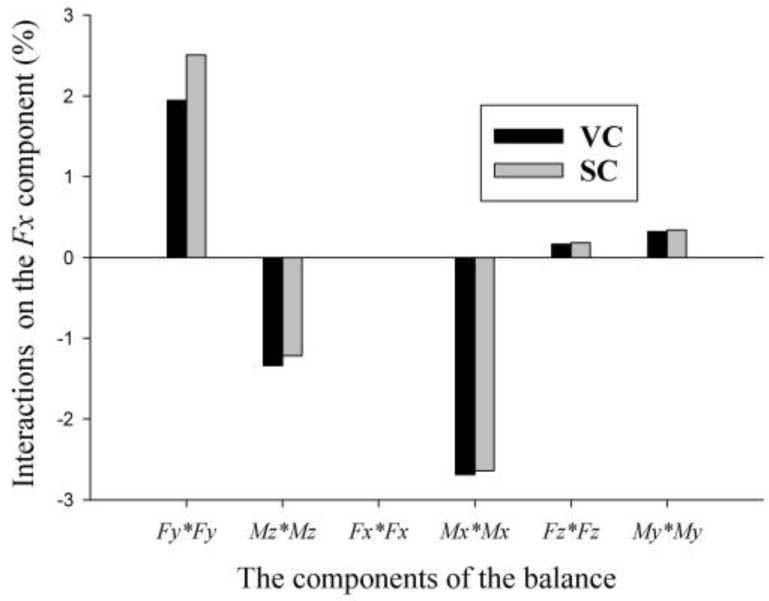
Fig. 7.
Quadratic interactions on the Fx component.
Table 7.
Comparison of interactions of cross-product terms.
| Component | Fy | Mz | Fx | Mx | Fz | My |
|---|---|---|---|---|---|---|
| VC [% FS] | −0.40 | 0.56 | 6.78 | 1.85 | 0.31 | −0.08 |
| SC [% FS] | −0.01 | 0.45 | 7.25 | −0.97 | 1.02 | 0.22 |
| Differences [% FS] | −0.39 | 0.11 | −0.47 | 2.82 | −0.71 | −0.3 |
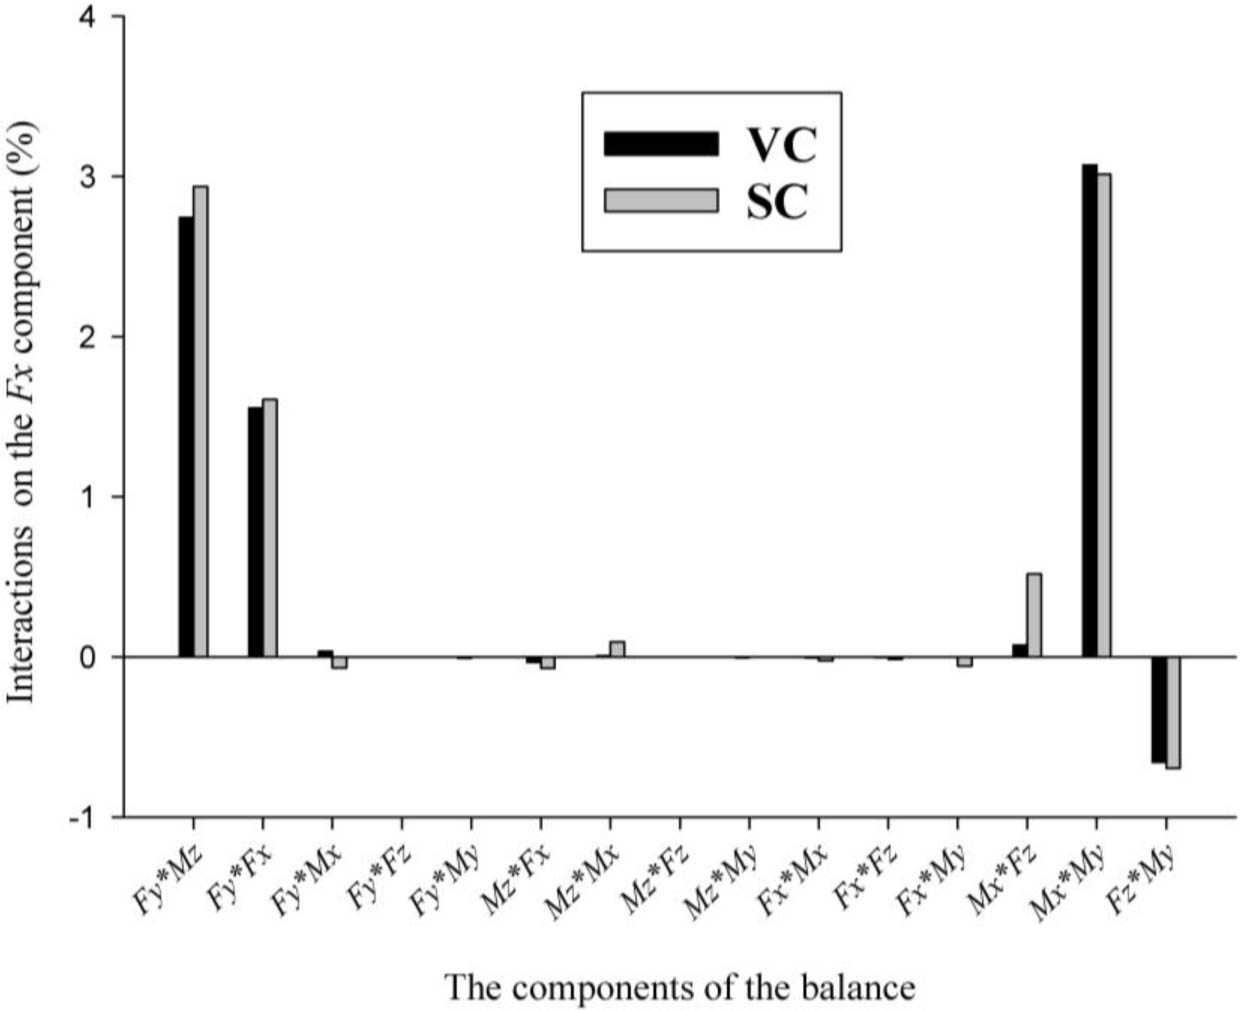
Fig. 8.
Cross-product term interactions on the Fx component.