
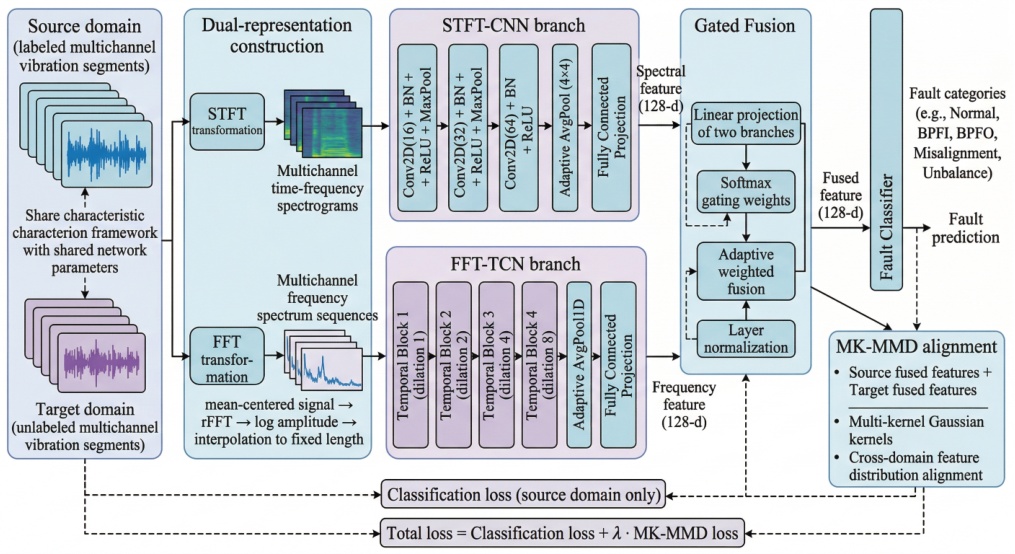
Fig. 1.
Overall structure of the proposed dual-branch fault diagnosis framework.
Table 1.
Measurement data and preprocessing configuration.
| Item | Setting |
|---|---|
| Load conditions | 0, 2, and 4 Nm |
| Rotational speed | approximately 3010 rpm |
| Sampling rate | 25.6 kHz |
| Vibration channels | 4 |
| Segment duration | 0.5 s |
| Points per segment | 12 800 |
| STFT window/overlap | 256/128 points |
| FFT output length | 256 points |
| Fault classes | 5 |
Table 2.
Transfer-task definitions and exact sample sizes. Each entry reports files/segments.
| Task | Source loads | Target load | Source train | Source validation | Target unlabeled | Target test |
|---|---|---|---|---|---|---|
| T1 | 0+2 Nm | 4 Nm | 24/4920 | 6/1200 | 6/1200 | 9/1680 |
| T2 | 0+4 Nm | 2 Nm | 24/4920 | 6/1200 | 6/1200 | 9/1680 |
| T3 | 2+4 Nm | 0 Nm | 24/4560 | 6/1200 | 6/1200 | 9/2040 |
Table 3.
Class-wise segment counts in each split, ordered as BPFI/BPFO/misalignment/normal/unbalance.
| Task | Source train | Source validation | Target unlabeled | Target test |
|---|---|---|---|---|
| T1 | 600/600/1200/600/1920 | 120/120/240/240/480 | 120/120/240/0/720 | 240/240/480/240/480 |
| T2 | 600/600/1200/600/1920 | 120/120/240/240/480 | 120/120/240/0/720 | 240/240/480/240/480 |
| T3 | 600/600/1200/240/1920 | 120/120/240/240/480 | 120/120/240/0/720 | 240/240/480/600/480 |
Table 4.
Target-domain comparison with external domain-adaptation methods. Accuracy and macro-F1 are expressed as percentages.
| Method | T1: 0+2→4 Nm | T2: 0+4→2 Nm | T3: 2+4→0 Nm | Average | ||||
|---|---|---|---|---|---|---|---|---|
| Accuracy | macro-F1 | Accuracy | macro-F1 | Accuracy | macro-F1 | Accuracy | macro-F1 | |
| ACDANN [28] | 42.86 | 46.67 | 80.54 | 79.23 | 61.23 | 65.47 | 61.54 | 63.79 |
| MFSAN [29] | 61.19 | 58.03 | 75.89 | 69.23 | 64.17 | 68.19 | 67.08 | 65.15 |
| MSSA [30] | 67.26 | 63.74 | 85.71 | 76.00 | 60.69 | 65.70 | 71.22 | 68.48 |
| IRDDDA [31] | 45.00 | 41.77 | 28.57 | 25.83 | 43.58 | 32.90 | 39.05 | 33.50 |
| Proposed | 87.62 | 89.24 | 85.71 | 76.00 | 70.59 | 72.31 | 81.31 | 79.18 |
Table 5.
A1–A5 ablation results on the target test sets. Accuracy and macro-F1 are expressed as percentages.
| Variant | T1 | T2 | T3 | Average | ||||
|---|---|---|---|---|---|---|---|---|
| Accuracy | macro-F1 | Accuracy | macro-F1 | Accuracy | macro-F1 | Accuracy | macro-F1 | |
| A1: STFT–CNN only | 58.75 | 55.02 | 84.88 | 75.17 | 70.59 | 72.31 | 71.41 | 67.50 |
| A2: FFT–TCN only | 70.71 | 69.34 | 73.33 | 73.46 | 60.20 | 61.65 | 68.08 | 68.15 |
| A3: fixed fusion | 37.98 | 38.05 | 85.00 | 75.46 | 53.58 | 59.08 | 58.85 | 57.53 |
| A4: no alignment | 28.57 | 25.80 | 57.62 | 52.14 | 47.11 | 51.93 | 44.43 | 43.29 |
| A5: single-kernel MMD | 54.58 | 48.68 | 57.68 | 52.81 | 70.59 | 72.31 | 60.95 | 57.93 |
| Full model | 87.62 | 89.24 | 85.71 | 76.00 | 70.59 | 72.31 | 81.31 | 79.18 |
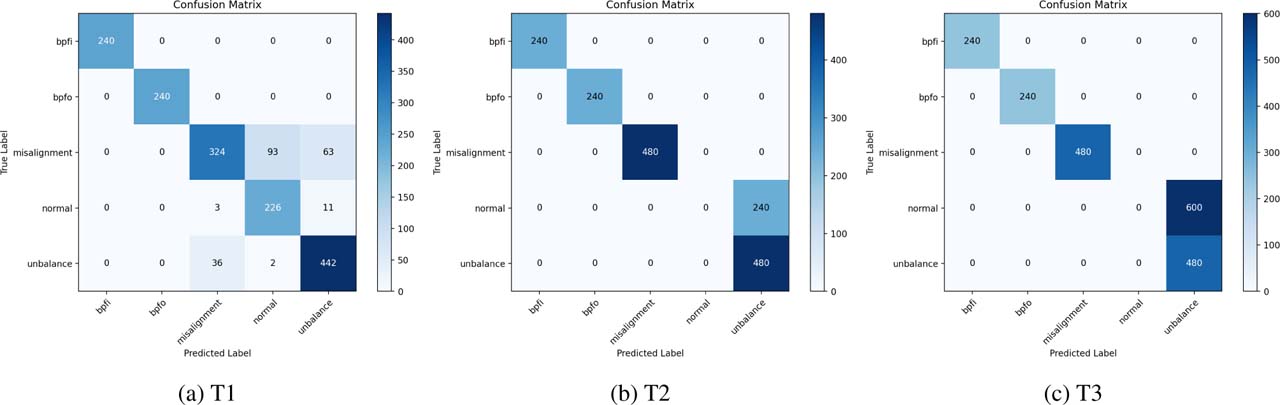
Fig. 2.
Confusion matrices of the proposed model under the three transfer tasks.
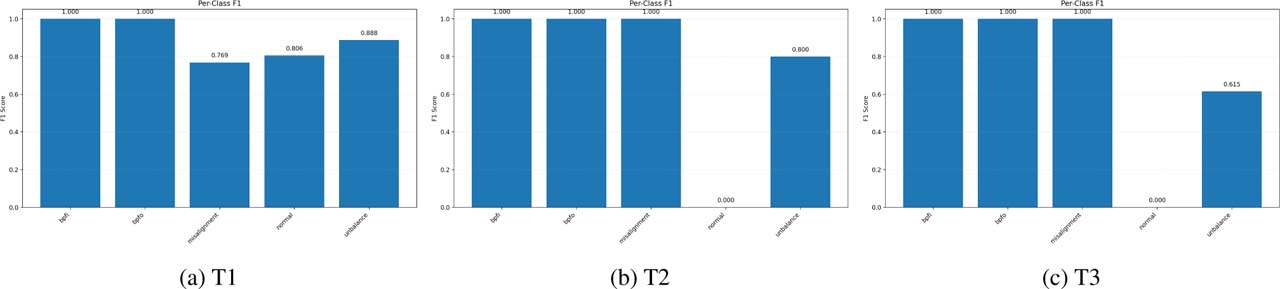
Fig. 3.
Per-class F1 scores of the proposed model under the three transfer tasks.
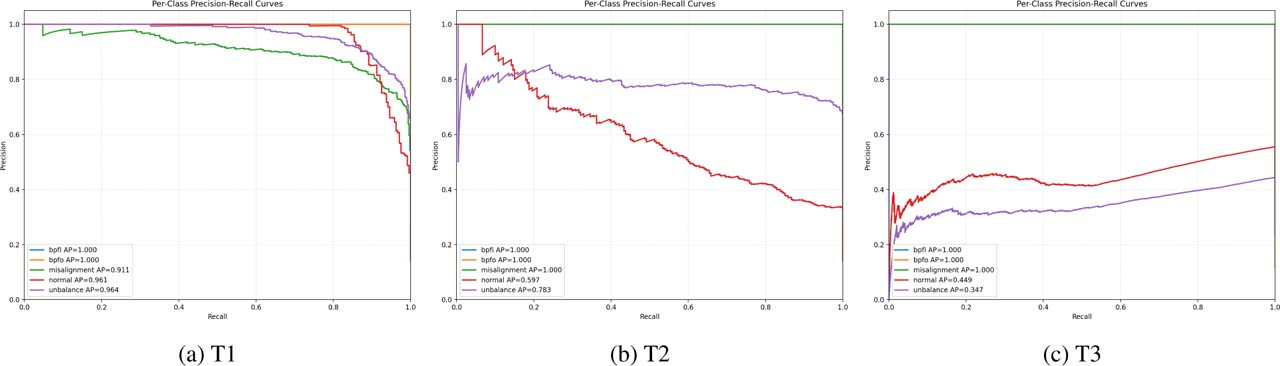
Fig. 4.
Per-class precision–recall curves of the proposed model under the three transfer tasks. AP denotes average precision.
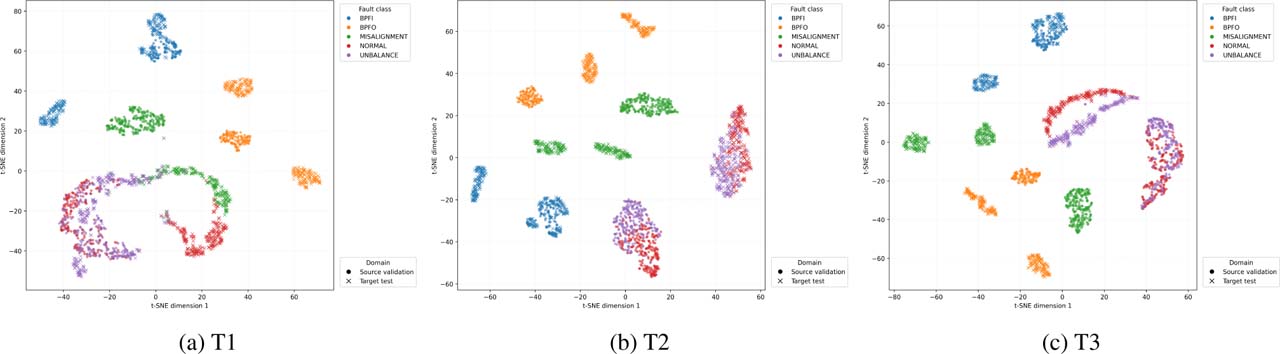
Fig. 5.
t-SNE visualization of fused source-validation (circles) and target-test (crosses) features. Colors denote fault classes.