
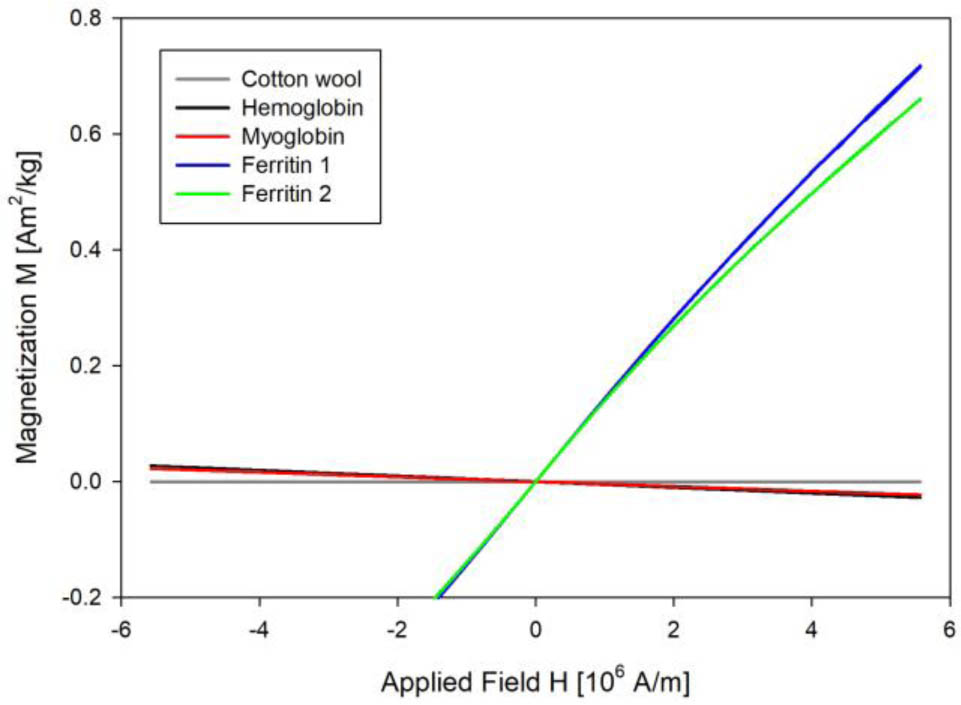
Fig 1.
M(H) dependences of cotton wool, hemoglobin, myoglobin, and ferritin preparations measured at 300 K.
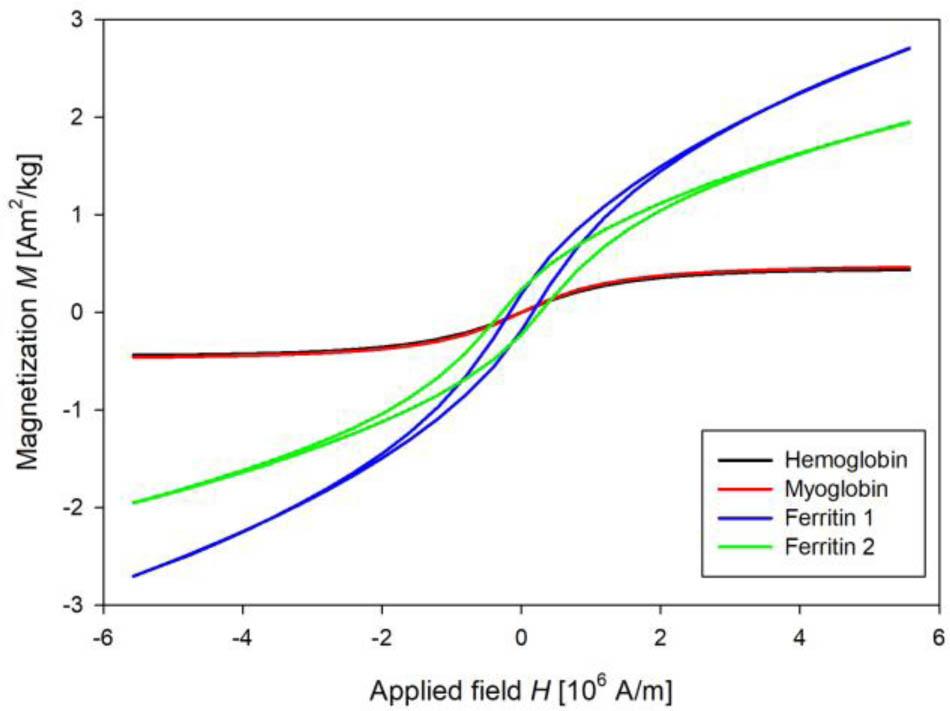
Fig 2.
M(H) dependences of hemoglobin, myoglobin, and ferritin preparations measured at 2 K after the diamagnetic corrections.
Table 1.
Derived parameters from M(H) dependences of protein preparations measured at 2 K.
| HC [A/m] | MR [10−3Am2/kg] | MMAX [Am2/kg] | |
|---|---|---|---|
| Hemoglobin | 1702 ± 81 | 0.49 ± 0.03 | 0.44 ± 0.21 |
| Myoglobin | 1032 ± 69 | 0.32 ± 0.02 | 0.46 ± 0.22 |
| Ferritin 1 | 164561 ± 8240 | 188.03 ± 9.51 | 2.71 ± 0.12 |
| Ferritin 2 | 275173 ± 14520 | 231.50 ± 10.25 | 1.95 ± 0.98 |
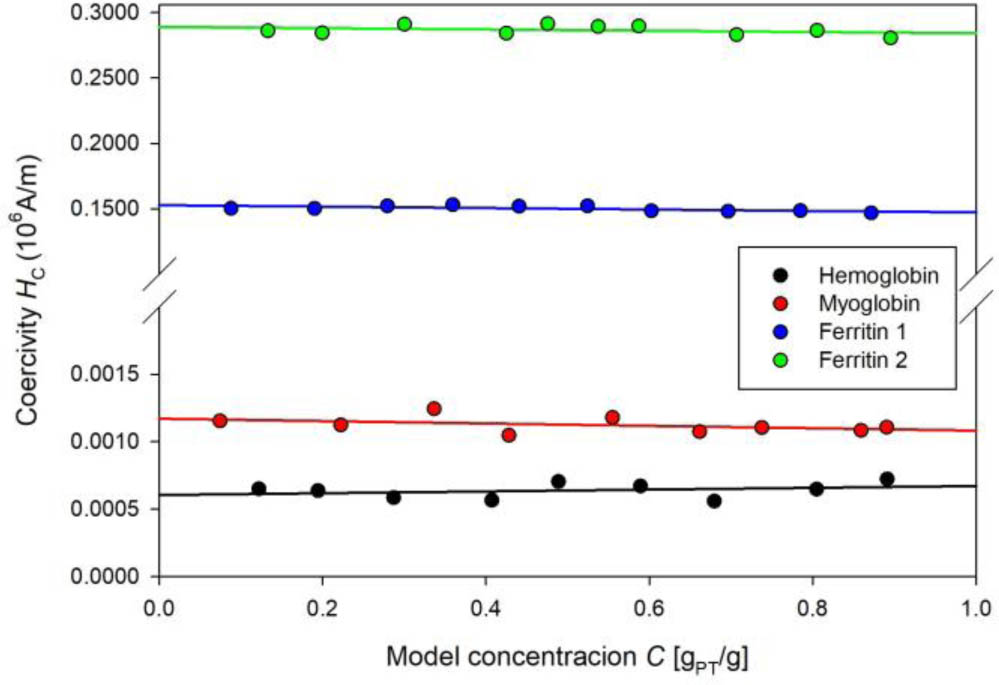
Fig. 3(a).
HC vs C for hemoglobin, myoglobin, and ferritin concentration models. SD of HC is 80, 83, 2400, and 2940 for hemoglobin, myoglobin, ferritin 1, and ferritin 2 models. The straight lines represent a linear regression of the measured data for each model (R2 = 0.092, 0.178, 0.433, 0.117, with slope 66, −88, −5431, −4975 and intercept 604, 1170, 152738, 289016).
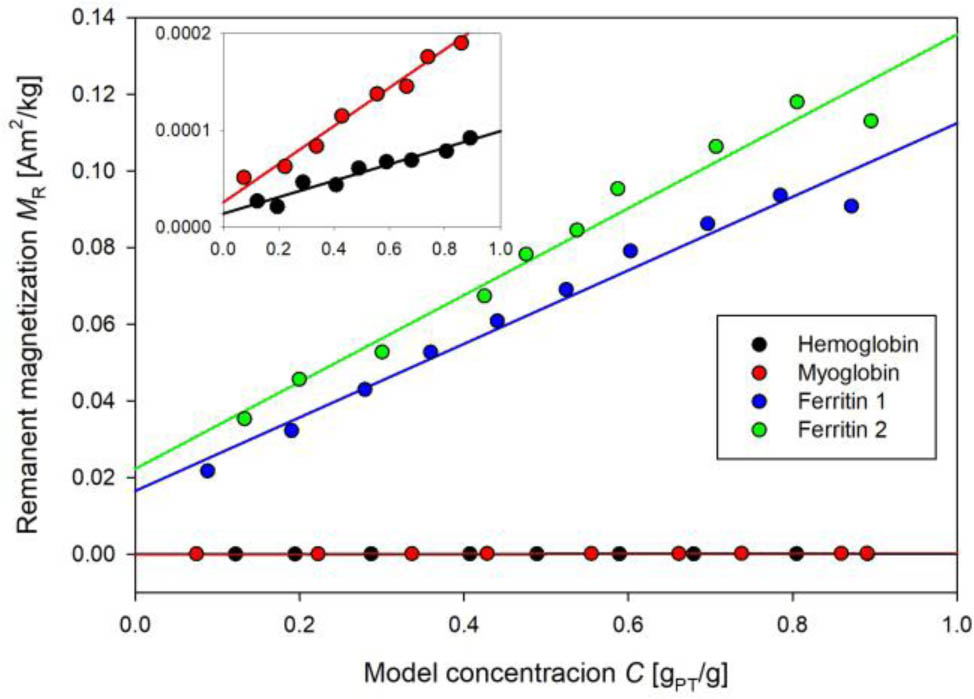
Fig. 3(b).
MR vs C for hemoglobin, myoglobin, and ferritin concentration models. SD of MR is 4.6 × 10⁻⁶, 5.1 × 10⁻⁶, 5.5 × 10⁻⁴, and 5.4 × 10⁻⁴ for hemoglobin, myoglobin, ferritin 1, and ferritin 2 models. The lines are a linear regression of the measured data for each model (R2 = 0.943, 0.979, 0.974, 0.970 with slope 8.5 × 10⁻⁵, 1.9 × 10⁻⁴, 9.6 × 10⁻², 11.3 × 10⁻² and intercept 1.4 × 10⁻⁵, 2.58 × 10⁻⁵, 1.6 × 10⁻², 2.2 × 10⁻²).
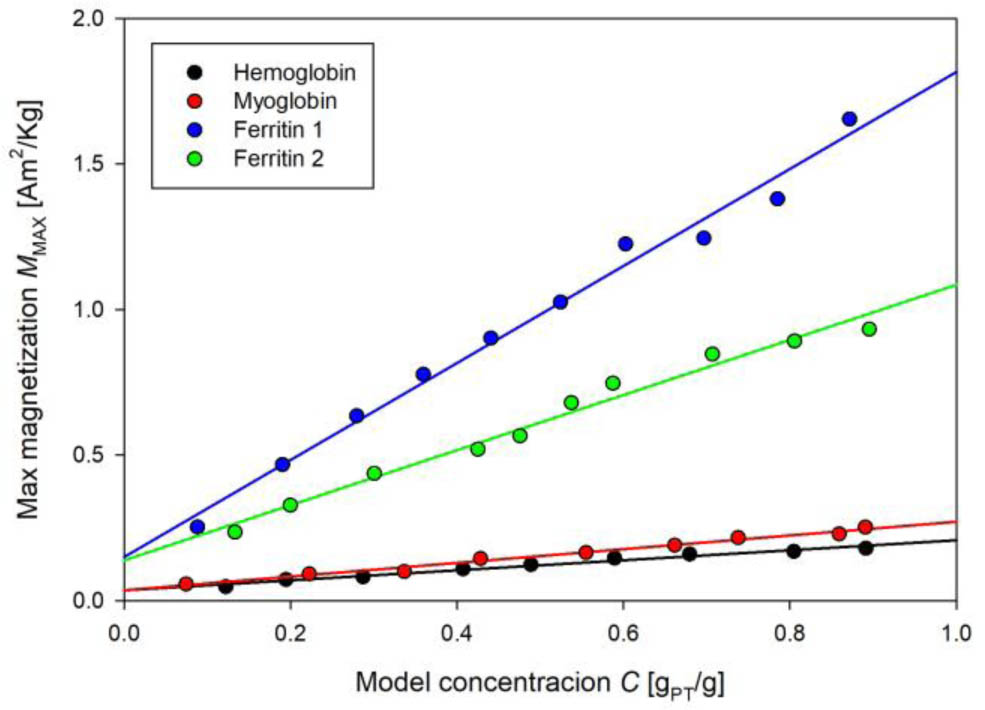
Fig. 3(c).
Dependence of MMAX vs C for hemoglobin, myoglobin, and ferritin concentration models. SD of MMAX is 9.6 × 10⁻³, 8.6 × 10⁻³, 1.6 × 10⁻³, and 1.8 × 10⁻³ for hemoglobin, myoglobin, ferritin 1, and ferritin 2 models. Lines are a linear regression of measured data for each model (R2 = 0.978, 0.986, 0.987, 0.980 with slope 17.1 × 10⁻², 23.5 × 10⁻², 1.67, 0.95 and intercept 3.5 × 10⁻², 3.6 × 10⁻², 15.0 × 10⁻², 13.9 × 10⁻²).
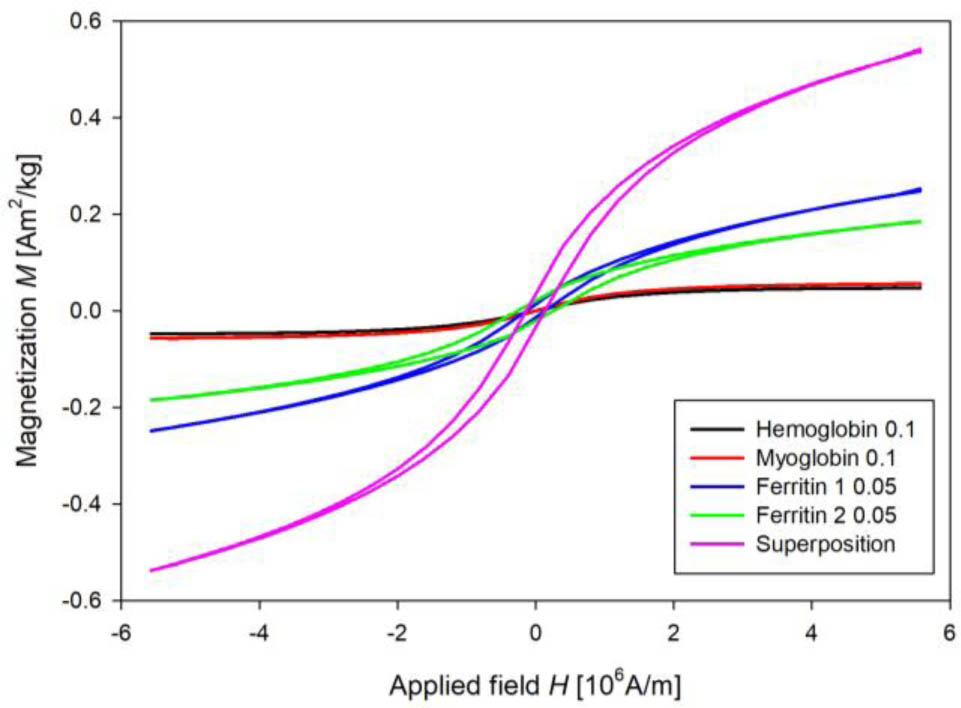
Fig. 4.
Superposition of individual proteins into the resulting curve. Simulated concentration of 0.1 gPT/g was used for hemoglobin and myoglobin, and 0.05 gPT/g was used for both ferritin preparations.