
Fig. 1.
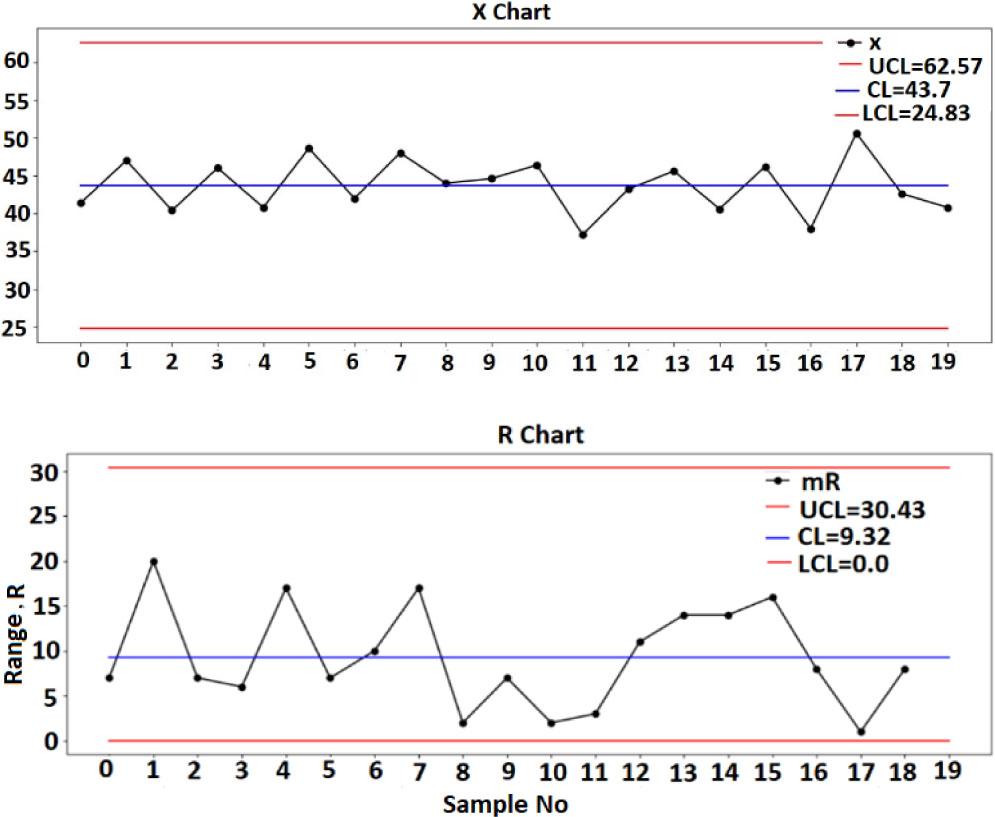
Fig. 2.
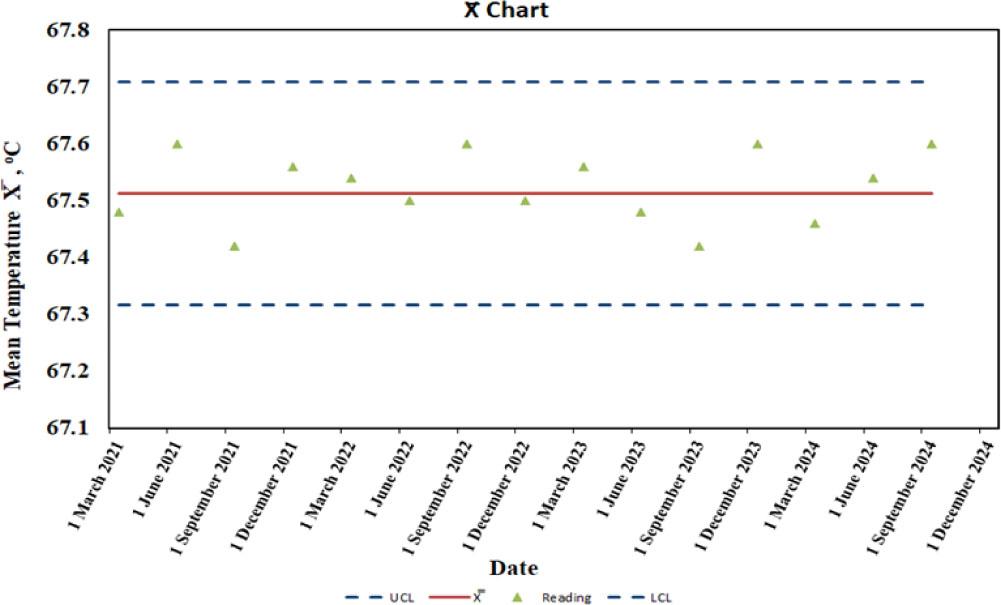
Fig. 3.
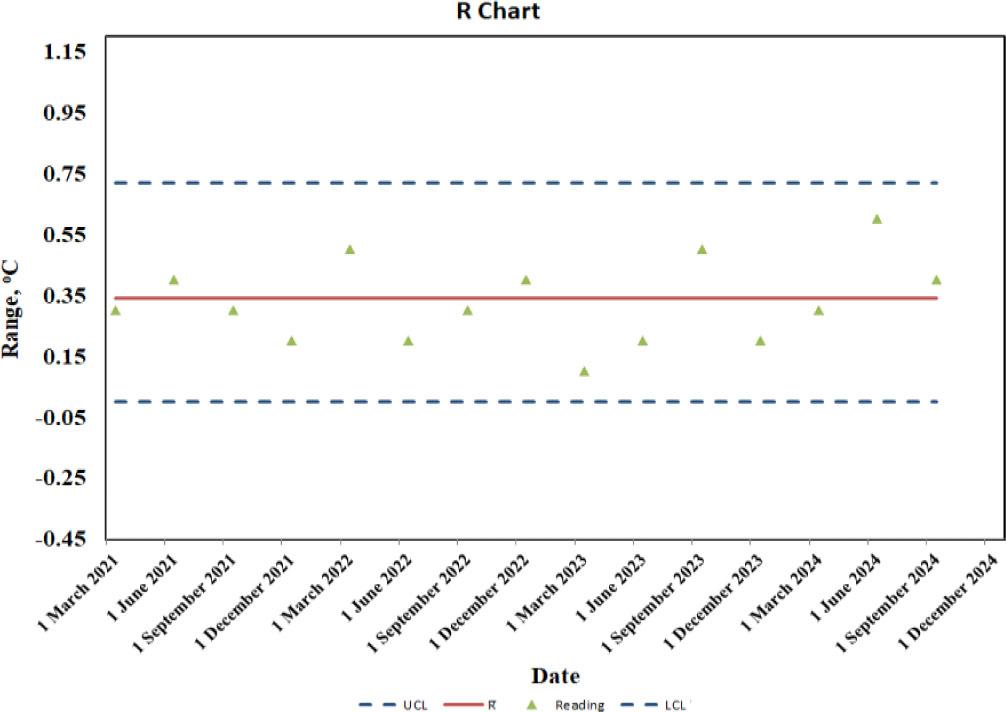
Fig. 4.
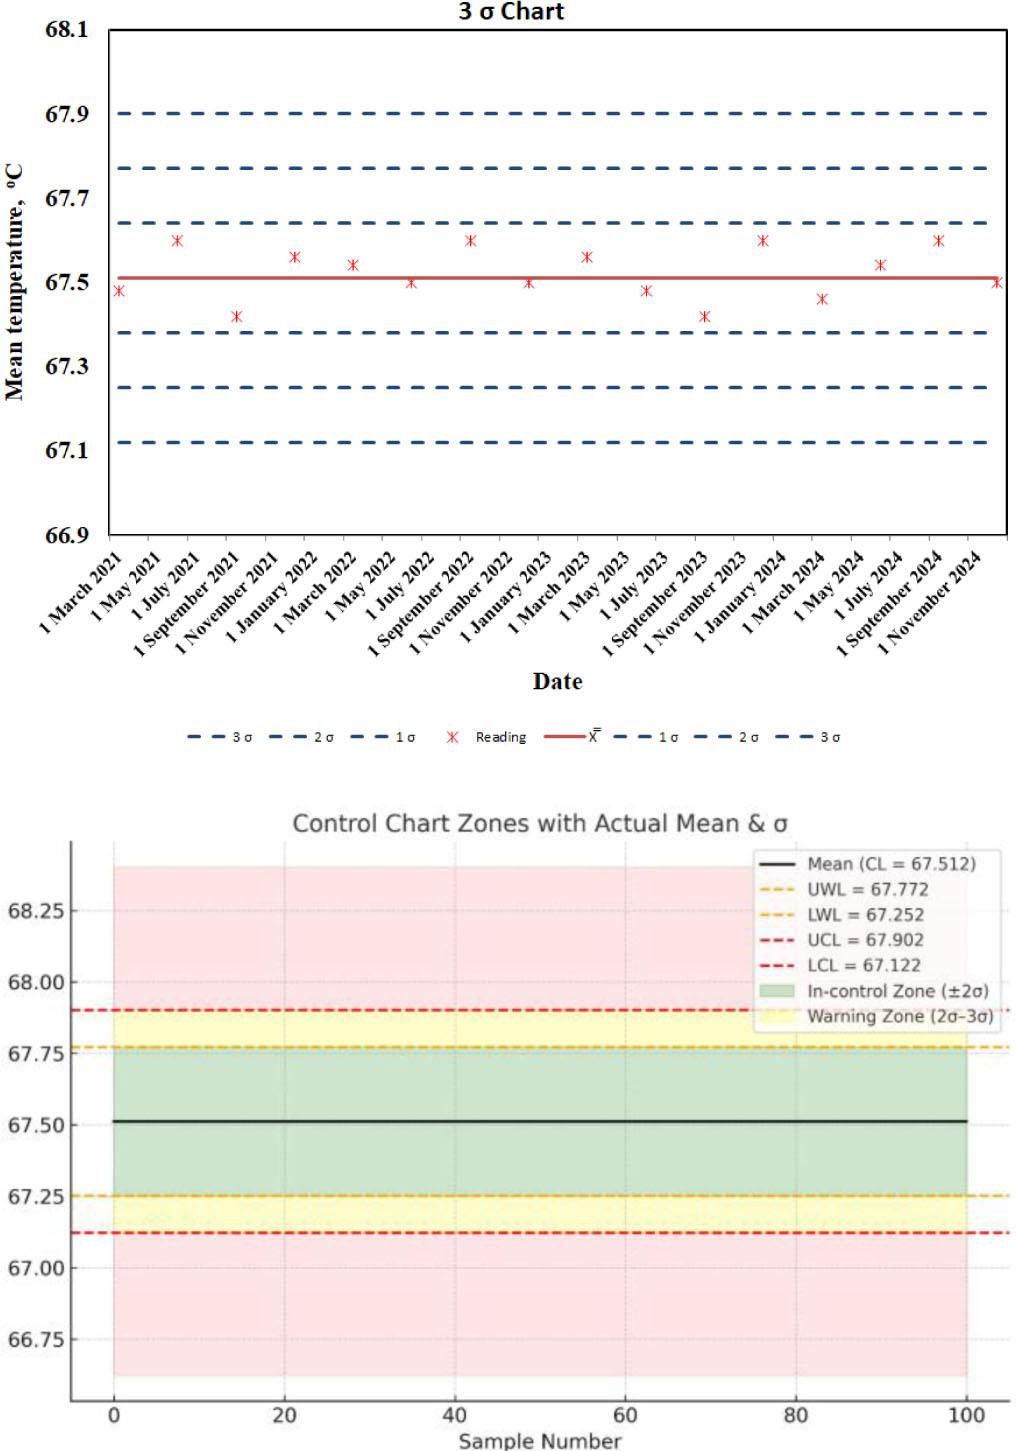
| Upper control limit (UCL) | UCL = Mean + 3StD = X + 3σ |
| Upper warning limit (UWL) | UWL = Mean + 2StD = X + 2σ |
| Control line (CL) | CL = Mean X |
| Lower warning limit (LWL) | LWL = Mean − 2StD = X − 2σ |
| Lower control limit (LCL) CL = Mean − 3StD = X − 3σ |
Distinction between Shewhart and Westgard rules in quality control_
| Aspect | Shewhart rules | Westgard rules |
|---|---|---|
| Origin | Walter A. Shewhart (industrial SPC) | James Westgard (clinical chemistry QC) |
| Application area | Manufacturing, engineering, calibration | Clinical laboratories, patient testing |
| Focus | Process stability & control | Analytical run validity & error detection |
| Tools used | X̅, R, S control charts | QC charts with multi-rule criteria |
| Decision outcome | Detects out-of-control process behavior | Accept/reject patient test runs |
The calculated control limits for the platinum resistance thermometer (Pt-100) calibration process over multiple years_
| Date | Reading [°C] | X̿ [°C] | 1σ | 2σ | 3σ | 1σ | 2σ | 3σ |
|---|---|---|---|---|---|---|---|---|
| UWL [°C] | LWL [°C] | |||||||
| 20 March 2021 | 67.48 | 67.512 | 67.64212814 | 67.77225628 | 67.90238443 | 67.38187186 | 67.25174372 | 67.12161557 |
| 20 June 2021 | 67.60 | 67.512 | 67.64212814 | 67.77225628 | 67.90238443 | 67.38187186 | 67.25174372 | 67.12161557 |
| 12 September 2021 | 67.42 | 67.512 | 67.64212814 | 67.77225628 | 67.90238443 | 67.38187186 | 67.25174372 | 67.12161557 |
| 22 December 2021 | 67.56 | 67.512 | 67.64212814 | 67.77225628 | 67.90238443 | 67.38187186 | 67.25174372 | 67.12161557 |
| 22 March 2022 | 67.54 | 67.512 | 67.64212814 | 67.77225628 | 67.90238443 | 67.38187186 | 67.25174372 | 67.12161557 |
| 22 June 2022 | 67.50 | 67.512 | 67.64212814 | 67.77225628 | 67.90238443 | 67.38187186 | 67.25174372 | 67.12161557 |
| 22 September 2022 | 67.60 | 67.512 | 67.64212814 | 67.77225628 | 67.90238443 | 67.38187186 | 67.25174372 | 67.12161557 |
| 22 December 2022 | 67.50 | 67.512 | 67.64212814 | 67.77225628 | 67.90238443 | 67.38187186 | 67.25174372 | 67.12161557 |
| 19 March 2023 | 67.56 | 67.512 | 67.64212814 | 67.77225628 | 67.90238443 | 67.38187186 | 67.25174372 | 67.12161557 |
| 19 June 2023 | 67.48 | 67.512 | 67.64212814 | 67.77225628 | 67.90238443 | 67.38187186 | 67.25174372 | 67.12161557 |
| 19 September 2023 | 67.42 | 67.512 | 67.64212814 | 67.77225628 | 67.90238443 | 67.38187186 | 67.25174372 | 67.12161557 |
| 22 December 2023 | 67.60 | 67.512 | 67.64212814 | 67.77225628 | 67.90238443 | 67.38187186 | 67.25174372 | 67.12161557 |
| 19 March 2024 | 67.46 | 67.512 | 67.64212814 | 67.77225628 | 67.90238443 | 67.38187186 | 67.25174372 | 67.12161557 |
| 25 June 2024 | 67.54 | 67.512 | 67.64212814 | 67.77225628 | 67.90238443 | 67.38187186 | 67.25174372 | 67.12161557 |
| 25 September 2024 | 67.60 | 67.512 | 67.64212814 | 67.77225628 | 67.90238443 | 67.38187186 | 67.25174372 | 67.12161557 |
| 19 December 2024 | 67.50 | 67.512 | 67.64212814 | 67.77225628 | 67.90238443 | 67.38187186 | 67.25174372 | 67.12161557 |
Control charts, constants, and calculated limits for Pt-100 calibration subgroup statistics_
| X̅ | R | S | σ | X̿ | R̅ | S̅ |
|---|---|---|---|---|---|---|
| 67.48 | 0.3 | 0.109544512 | 0.130128142 | 67.512 | 0.34 | 0.126802209 |
| 67.56 | 0.3 | 0.114017543 | ||||
| 67.50 | 0.4 | 0.129099445 | ||||
| 67.56 | 0.3 | 0.114017543 | ||||
| 67.46 | 0.4 | 0.167332005 |
The raw calibration readings of Pt-100 thermometer at (200 °C, 150 °C, and 70 °C)_
| Setting | Groups | Reading [°C] | ||||
| 1 | 2 | 3 | 4 | 5 | ||
| 200 °C | 1 | 200.4 | 200.5 | 200.5 | 200.4 | 200.5 |
| 2 | 200.6 | 200.6 | 200.5 | 200.5 | 200.6 | |
| 3 | 200.3 | 200.5 | 200.4 | 200.6 | 200.7 | |
| 4 | 200.6 | 200.5 | 200.5 | 200.4 | 200.6 | |
| 5 | 200.3 | 200.4 | 200.6 | 200.5 | 200.5 | |
| Setting | Groups | Reading [°C] | ||||
| 1 | 2 | 3 | 4 | 5 | ||
| 150 °C | 1 | 148.8 | 148.6 | 148.7 | 148.8 | 148.5 |
| 2 | 148.7 | 148.6 | 148.5 | 148.7 | 148.6 | |
| 3 | 148.7 | 148.6 | 148.8 | 148.7 | 148.7 | |
| 4 | 148.9 | 148.7 | 148.8 | 148.7 | 148.6 | |
| 5 | 148.7 | 148.8 | 148.7 | 148.6 | 148.7 | |
| Setting | Groups | Reading [°C] | ||||
| 1 | 2 | 3 | 4 | 5 | ||
| 70 °C | 1 | 67.5 | 67.6 | 67.5 | 67.3 | 67.5 |
| 2 | 67.7 | 67.6 | 67.5 | 67.4 | 67.6 | |
| 3 | 67.3 | 67.5 | 67.4 | 67.6 | 67.7 | |
| 4 | 67.6 | 67.7 | 67.5 | 67.4 | 67.6 | |
| 5 | 67.2 | 67.4 | 67.6 | 67.6 | 67.5 | |
Control chart constants (X̅- and R-charts)_
| Sample size = m | A2 | A3 | d2 | D3 | D4 | B3 | B4 |
|---|---|---|---|---|---|---|---|
| 2 | 1.880 | 2.659 | 1.128 | 0 | 3.267 | 0 | 3.267 |
| 3 | 1.023 | 1.954 | 1.693 | 0 | 2.574 | 0 | 2.568 |
| 4 | 0.729 | 1.628 | 2.059 | 0 | 2.282 | 0 | 2.266 |
| 5 | 0.577 | 1.427 | 2.326 | 0 | 2.114 | 0 | 2.089 |
| 6 | 0.483 | 1.287 | 2.534 | 0 | 2.004 | 0.030 | 1.970 |
| 7 | 0.419 | 1.182 | 2.704 | 0.076 | 1.924 | 0.118 | 1.882 |
| 8 | 0.373 | 1.099 | 2.847 | 0.136 | 1.864 | 0.185 | 1.815 |
| 9 | 0.337 | 1.032 | 2.97 | 0.184 | 1.816 | 0.239 | 1.761 |
| 10 | 0.308 | 0.975 | 3.078 | 0.223 | 1.777 | 0.284 | 1.716 |
The uncertainty budget of the platinum resistance thermometer (Pt-100) at 200 °C_
| Symbol | Source uncertainty | Value Xi ± (°C, Ω) | Divisor | Sensitivity coefficient | Uncertainty contribution | Method of estimation |
|---|---|---|---|---|---|---|
| Ust1 | Uncertainty of standard | 0.005 | 2 | 1 | 0.0025 | Calibration certificate |
| Ures | Resolution | 0.0001 | 3.46 | 1 | 2.88675E-05 | Digital indicator = 0.5 of resolution |
| Umul | Bridge | 0.0003 | 2 | 2.5 | 0.00037 | Calibration certificate |
| Udrf | Drift of bridge | 0 | 2 | 1 | 0 | Maximum difference between two successive calibrations of the standard |
| Ures uut | Resolution of UUT | 0.001 | 3.46 | 1 | 0.00028 | Digital indicator = 0.5 of resolution |
| Uaxi | Axial of dry block | 0.07 | 1.73 | 1 | 0.040 | Maximum difference between dry block holes for axial measurement |
| Urad | Radial of dry block | 0.04 | 1.73 | 1 | 0.023 | Maximum difference between dry block holes for radial measurement |
| Ustab | Stability of dry block | 0.05 | 3.46 | 1 | 0.0144 | Difference between maximum and minimum value of measurements |
| Uhyst | Hysteresis effects | 0.01 | 1.73 | 1 | 0.007 | Maximum difference between increase and decrease measurements |
| Urep | Repeatability (A) | 0.002 | 1 | 1 | 0.002 | Standard deviation of measurements |
| Combined uncertainty | 0.049 | |||||
| Expanded uncertainty | ± 0.09 oC |