
Fig. 1.
Fig. 2.
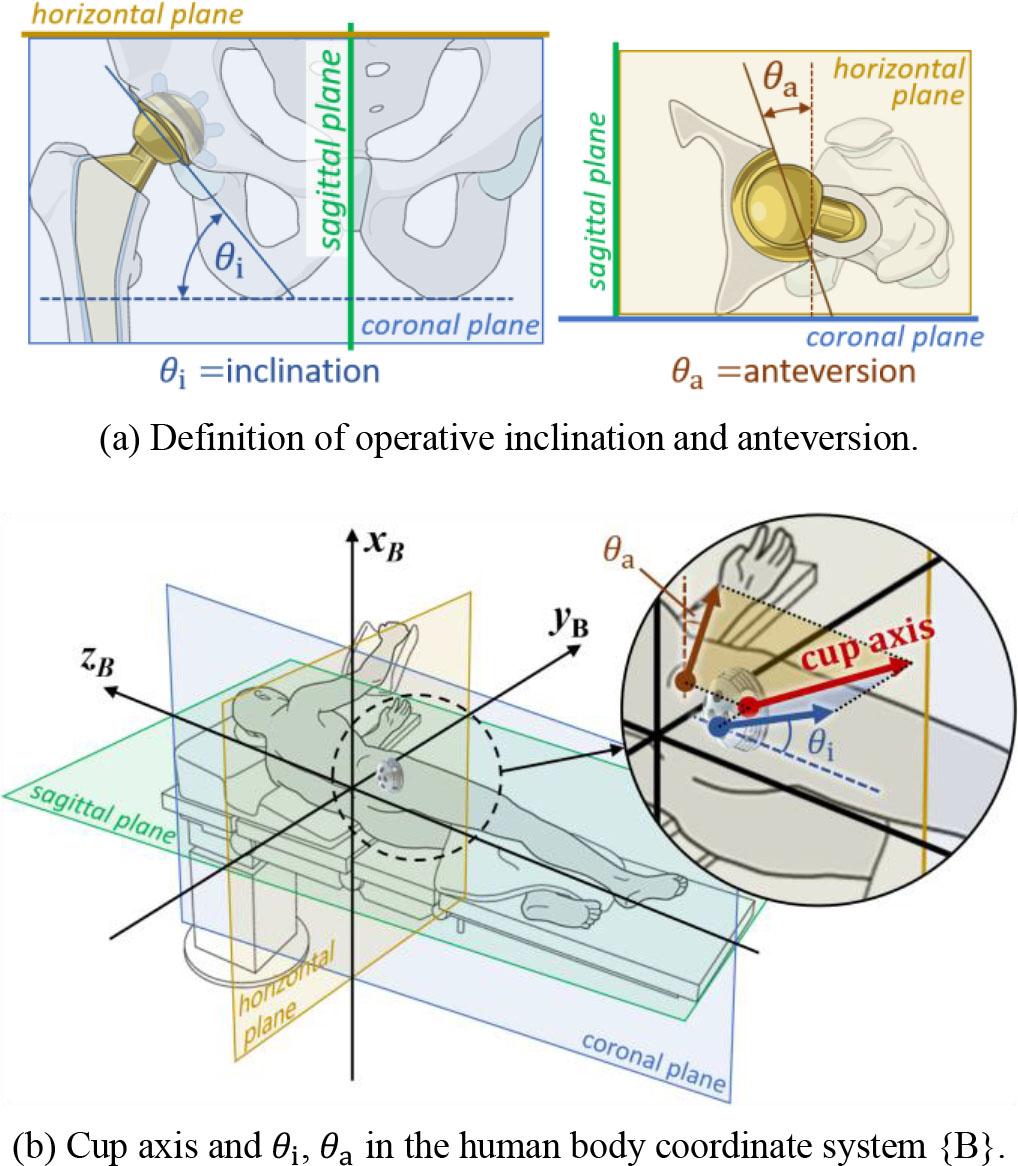
Fig. 3.
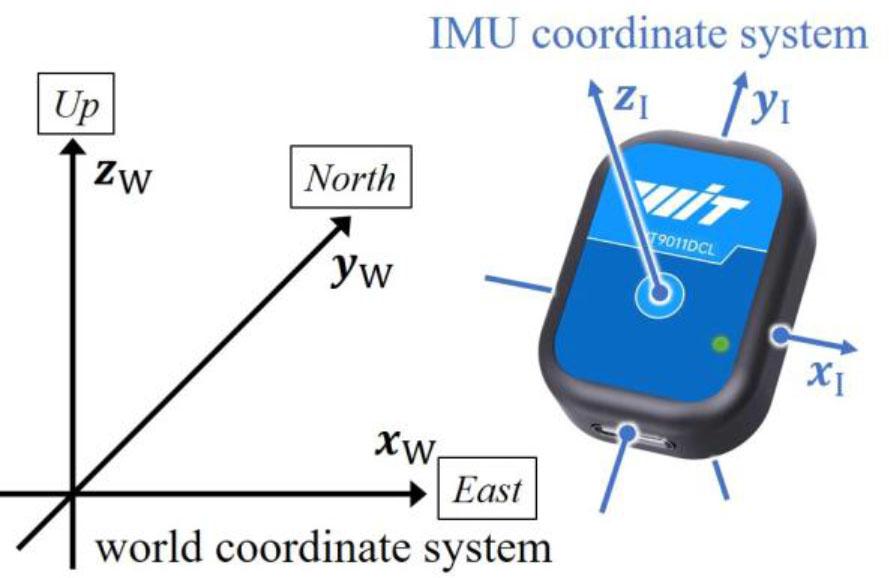
Fig. 4.
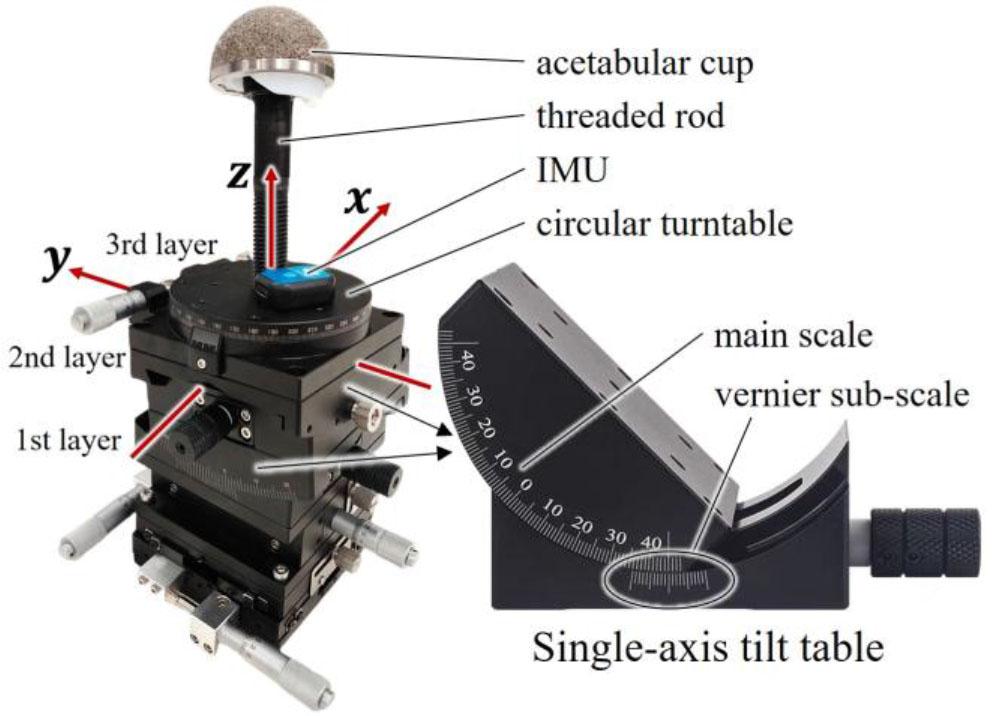
Fig. 5.
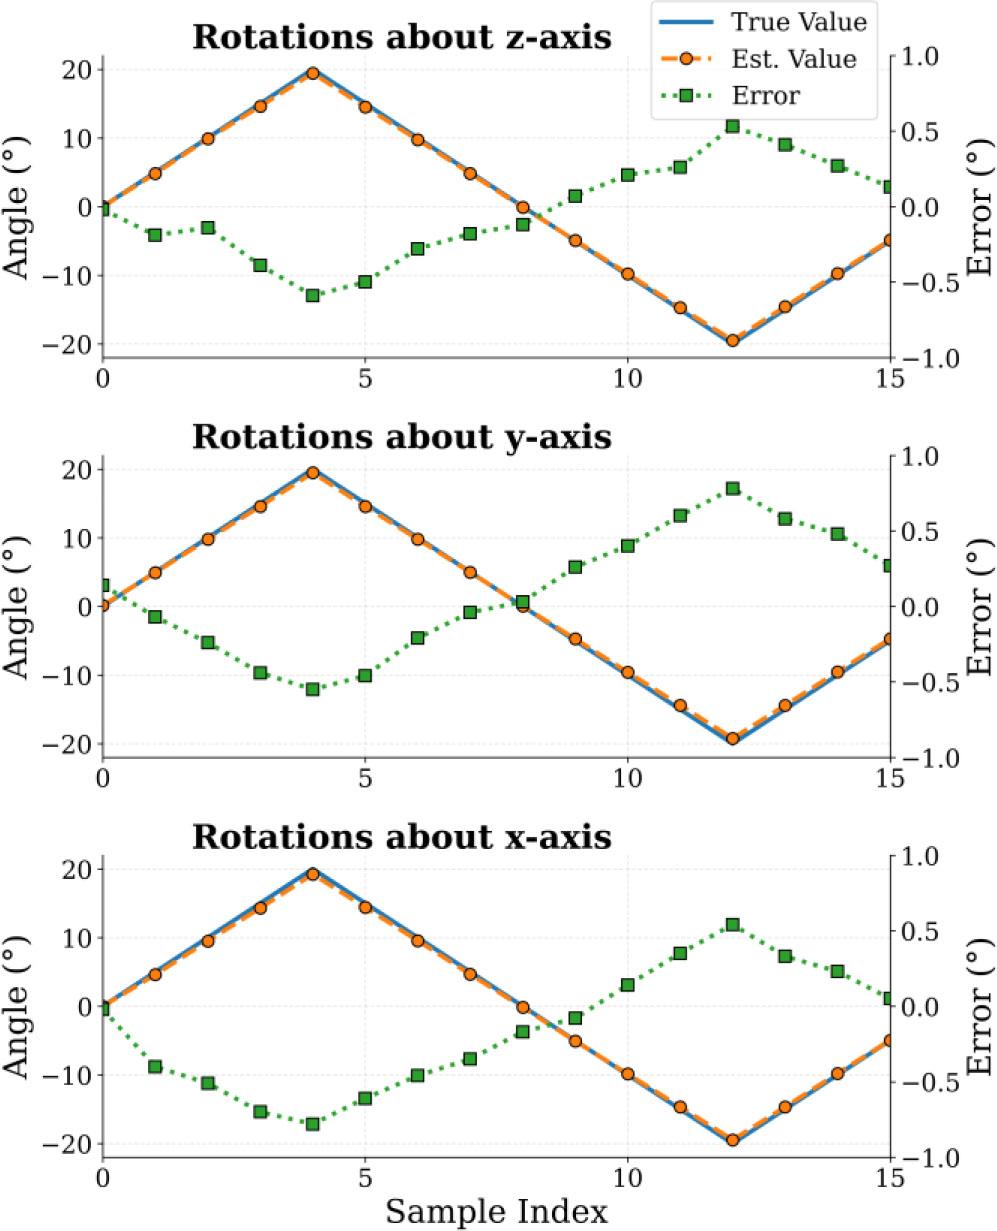
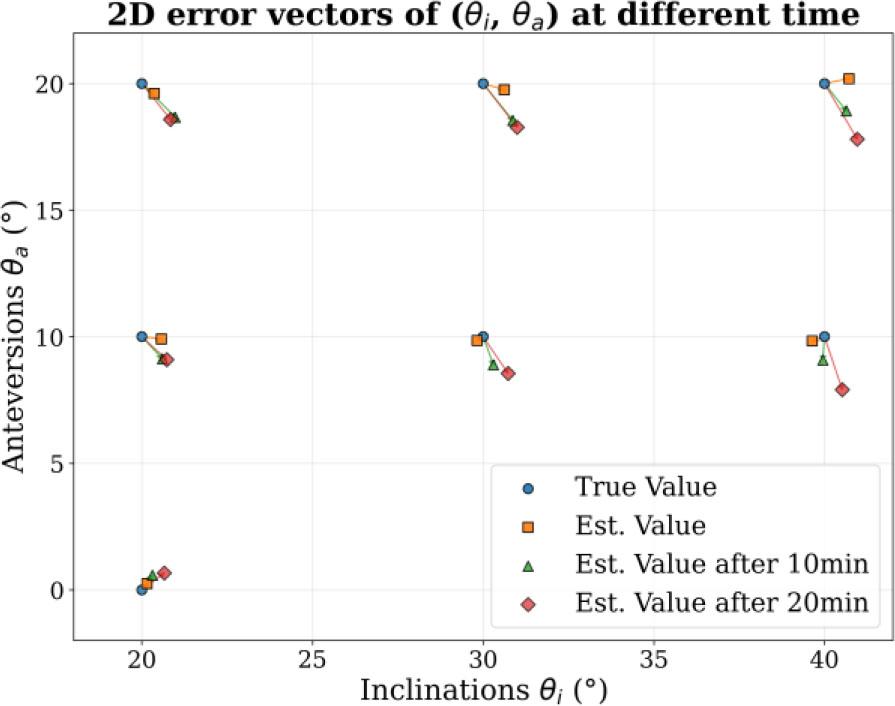
Fig. 6.
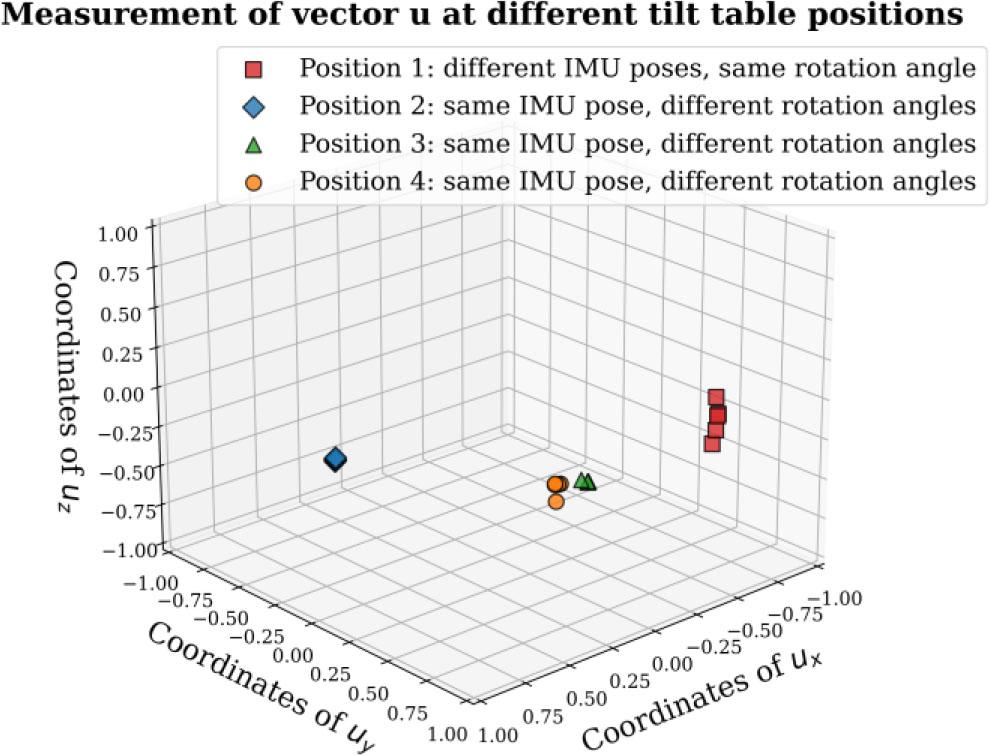
Fig. 7.
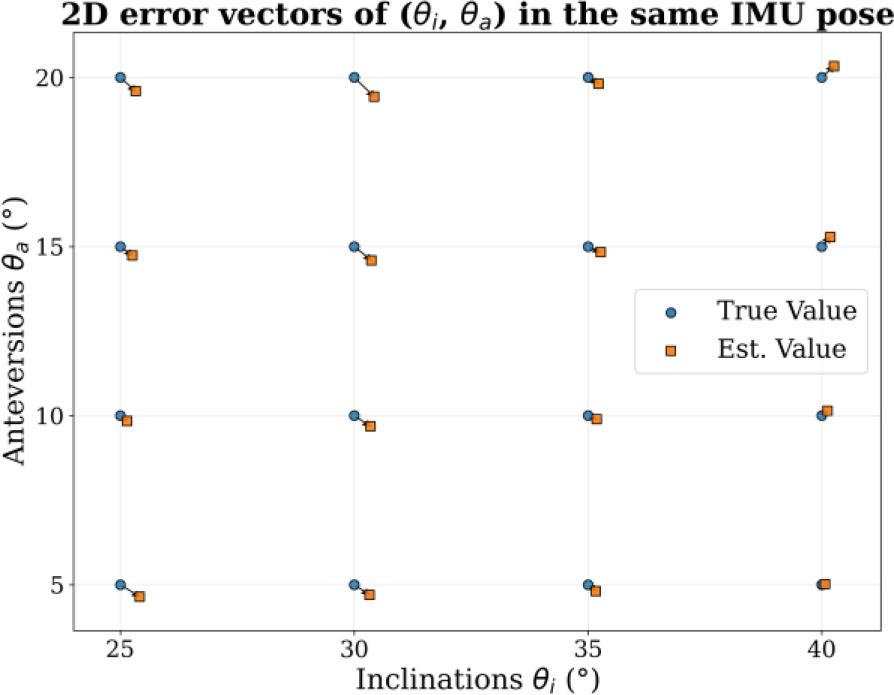
Fig. 8.
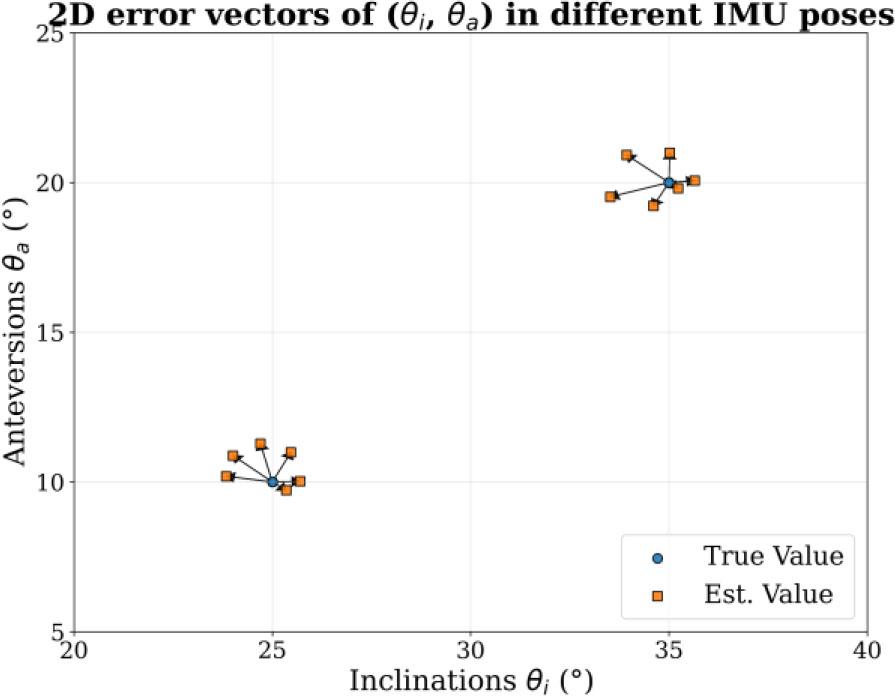
Fig. 9.
Performance comparison among different prosthesis pose estimation technologies for THA_
| This work | Chen et al. (2021) [16] | Tang et al. (2025) [17] | Computer-assisted system [11] | |
|---|---|---|---|---|
| Sensor type | IMU | IMU | IMU | camera |
| Angular error | RMSE: | RMSE: | MAE: | MAE: |
| Prosthesis adaptability | high | low | low | high |
| Invasiveness | non-invasive | non-invasive | non-invasive | invasive |
| Radiation exposure | no | no | no | yes |
| Experimental environment | 3-axis tilt table | customized measuring device | in vitro tests on sawbones | real cases (25 patients) |
Definitions of the three coordinate systems: world system{W}, IMU system {I}, and body system {B}_
| Name & notation | Definition |
|---|---|
| World | xW: pointing east |
| system | yW: pointing north |
| {W} | zW: pointing up, orthogonal to the local Earth surface |
| IMU | xI: pointing right (viewing from front-facing direction) |
| system | yI: pointing up (viewing from front-facing direction) |
| {I} | zI: pointing forward (front-facing direction) |
| Body | xB: pointing to the body’s right |
| system | yB: pointing forward |
| {B} | zB: pointing up along the spinal axis |
Angle estimation accuracy (using RMSE and MAPE) of rotations in the three axes_
| Rotation axis | RMSE | MAPE |
|---|---|---|
| z-axis | 0.315° | 2.5 % |
| y-axis | 0.409° | 3.3 % |
| x-axis | 0.423° | 3.6 % |
Part of the data (estimated coordinates of rotation axis vector at Position 1 & 2) and the corresponding test conditions (IMU pose & rotation angle)_
| Tilt table position | IMU pose | Rotation angle | Estimated axis vector
|
|---|---|---|---|
| Position 1 | Pose A | 10° | (−0.586, 0.810, −0.024) |
| Pose B | (−0.565, 0.819, 0.103) | ||
| Pose C | (−0.579, 0.808, −0.111) | ||
| Pose D | (−0.601, 0.799, −0.022) | ||
| Pose E | (−0.553, 0.812, −0.186) | ||
| Position 2 | Pose A | 3° | ( 0.993, 0.119, 0.020) |
| 6° | ( 0.993, 0.120, 0.006) | ||
| 9° | ( 0.993, 0.119, 0.006) | ||
| 12° | ( 0.993, 0.117, −0.004) | ||
| 15° | ( 0.994, 0.114, 0.007) |
Results of θi and θa measurement accuracy experiment_
| Test time | θi RMSE | θa RMSE | Average error vector magnitude |
|---|---|---|---|
| 0 min | 0.469° | 0.234° | 0.494° |
| 10 min | 0.618° | 1.085° | 1.199° |
| 20 min | 0.791° | 1.586° | 1.704° |