
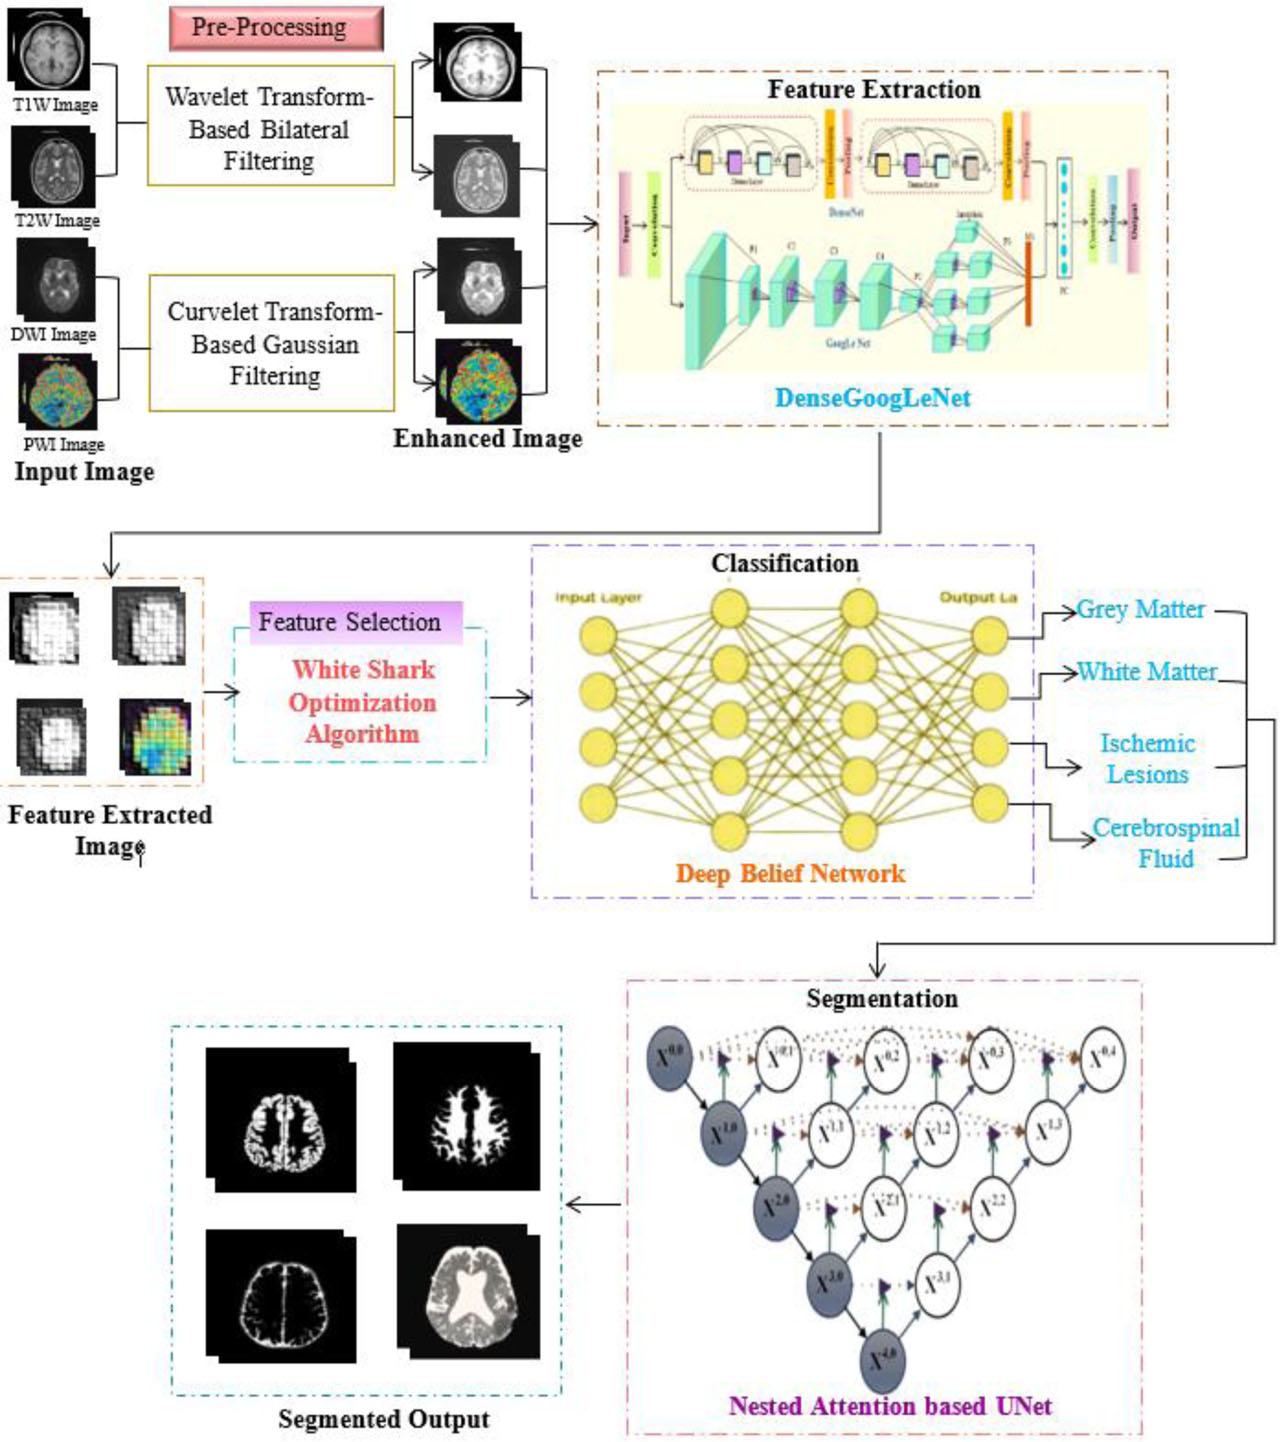
Fig. 1.
Proposed BTS-NEUNET model.
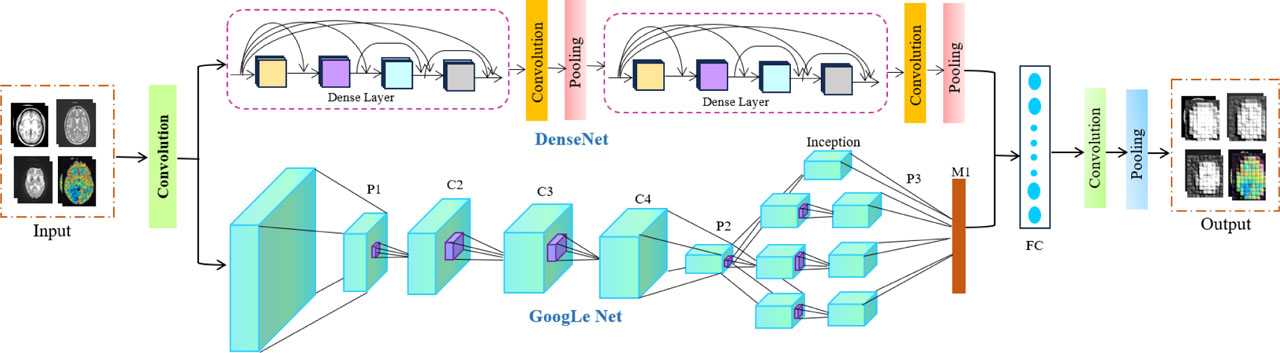
Fig. 2.
Architecture of DenseGoogLeNet.
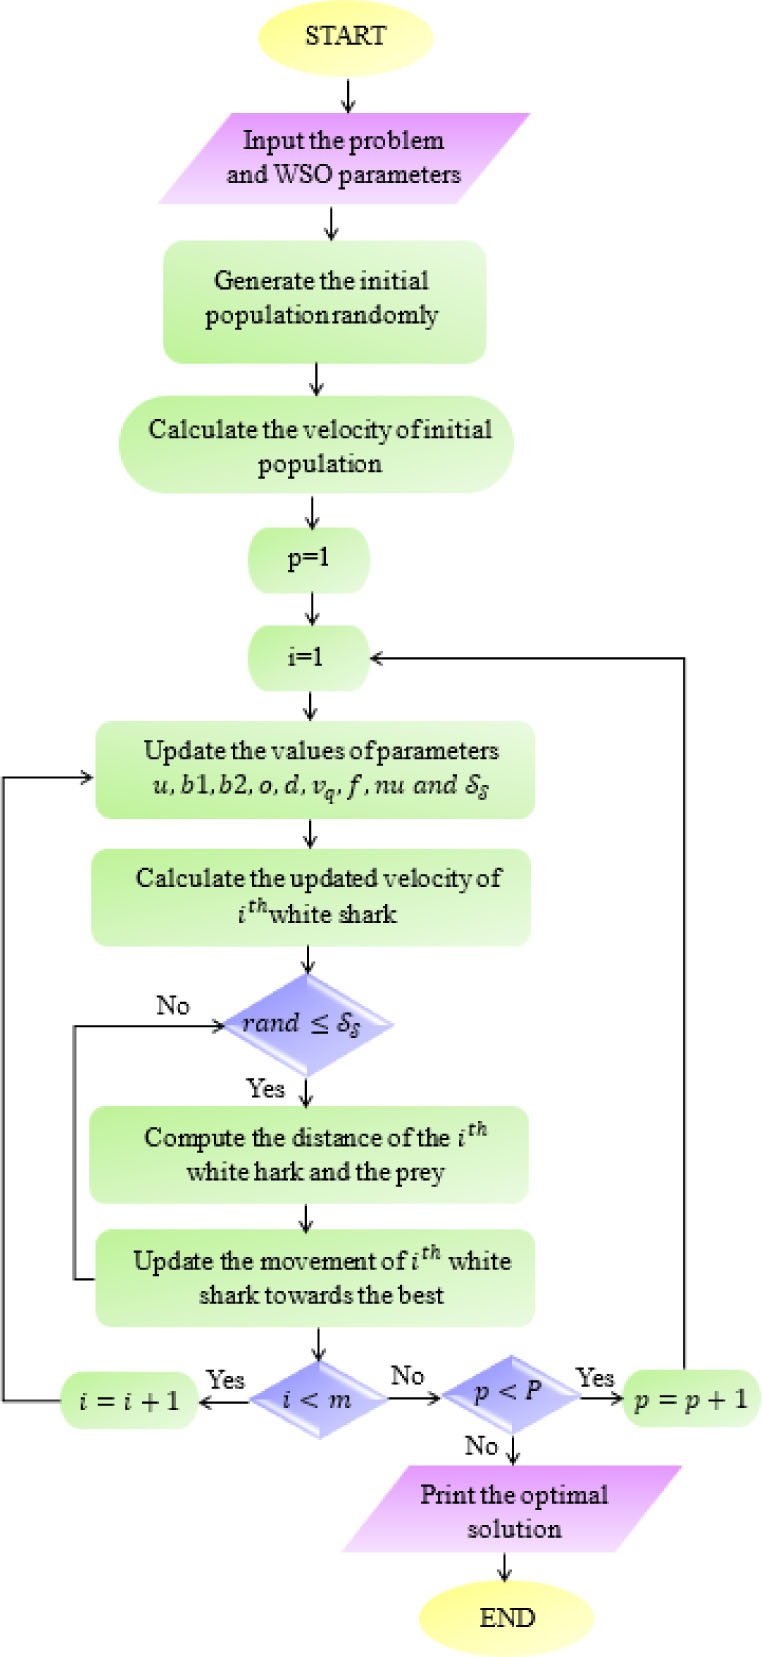
Fig. 3.
Flowchart of White Shark Optimization Algorithm.
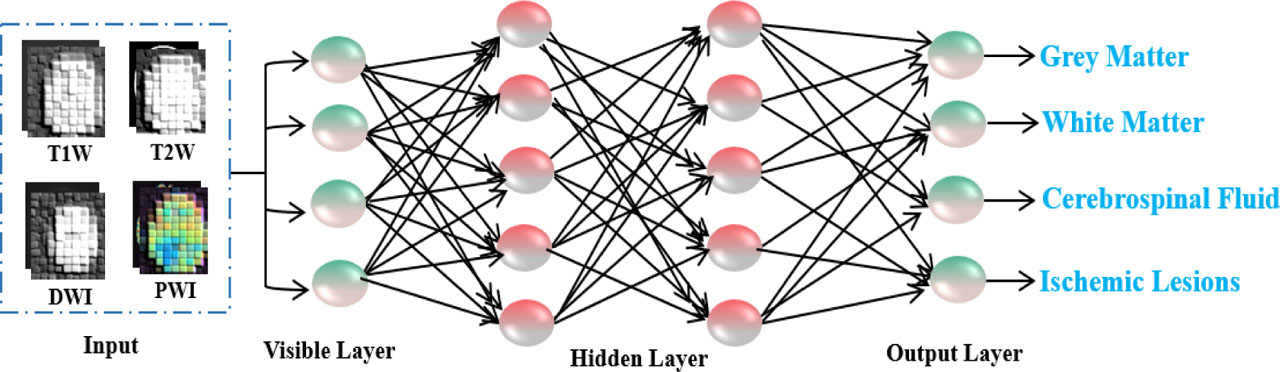
Fig. 4.
Architecture of a DBN.
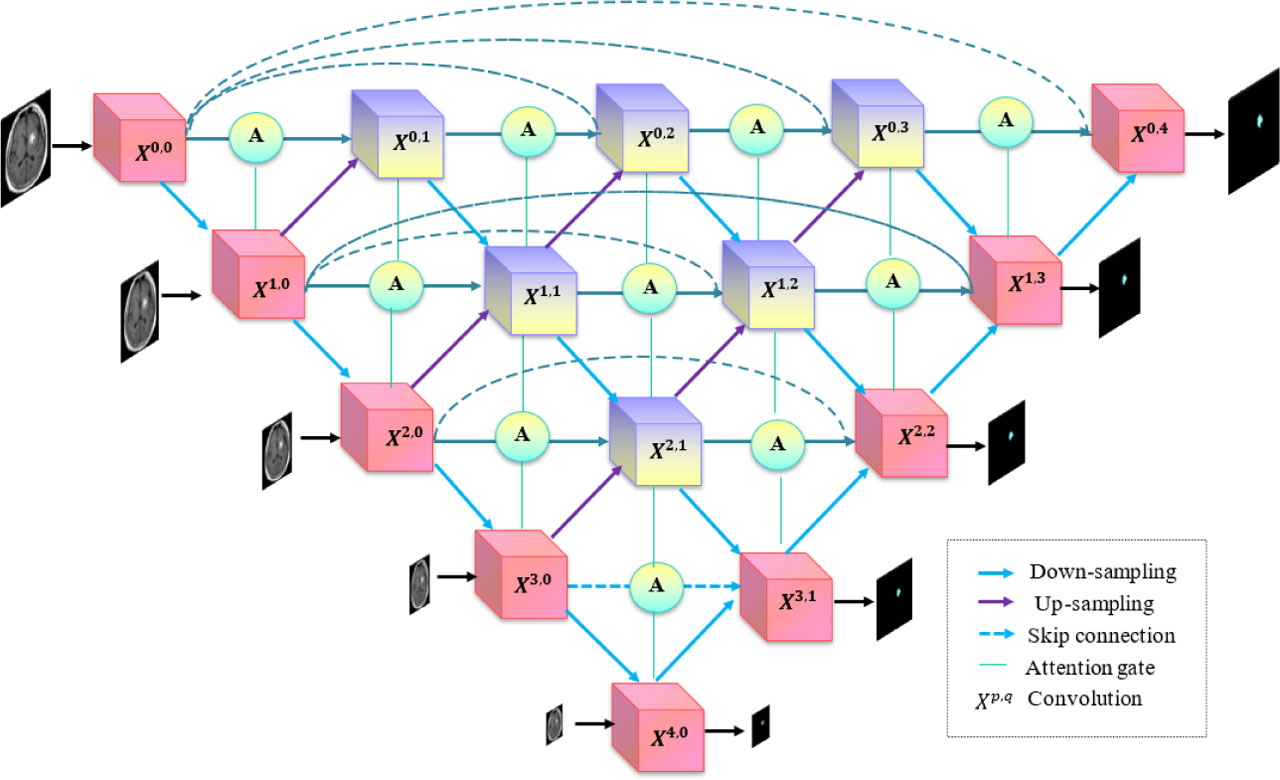
Fig. 5.
Structure of Nested Attention U-Net.
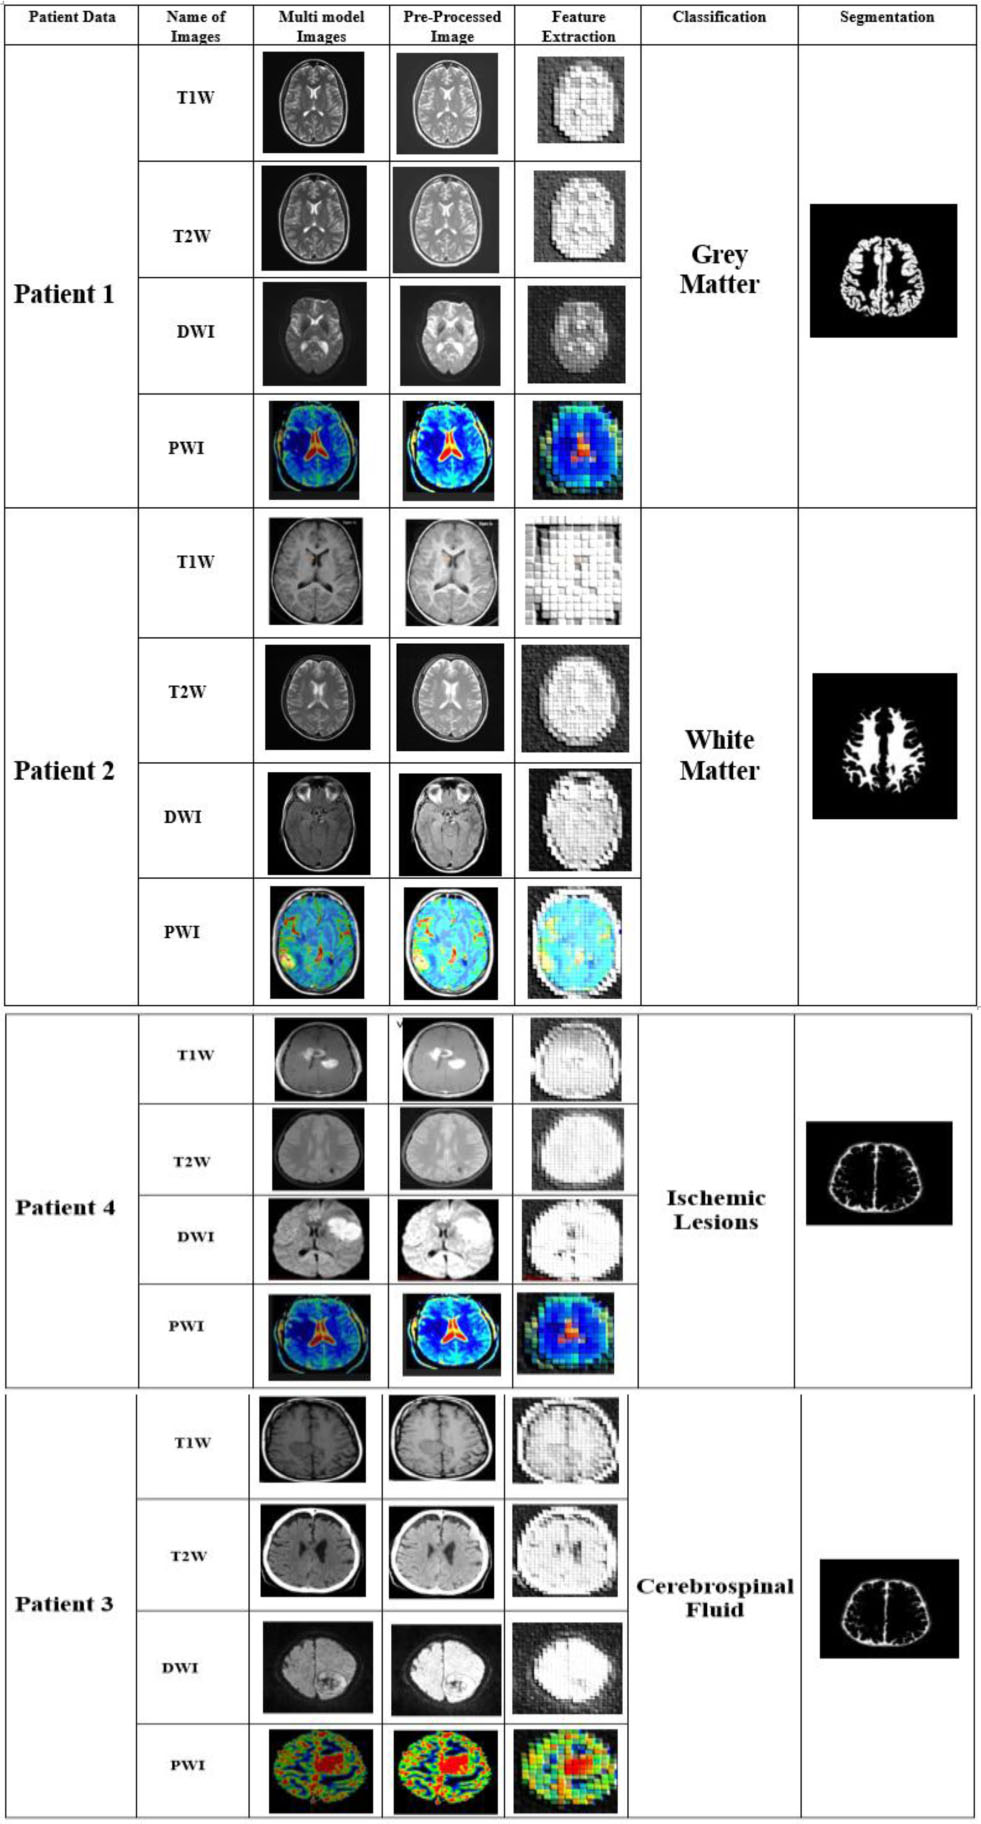
Fig. 6.
Experimental result of the proposed BTS-NEUNET.
Table 1.
Performance of the proposed BTS-NEUNET method.
| Classes | Accuracy [%] | Precision [%] | Recall [%] | Specificity [%] | F1-Score [%] |
|---|---|---|---|---|---|
| Grey matter | 99.75 | 97.69 | 98.52 | 98.62 | 97.64 |
| White matter | 99.85 | 98.91 | 97.74 | 97.41 | 98.17 |
| Cerebrospinal fluid | 98.96 | 99.45 | 96.92 | 96.58 | 96.43 |
| Ischemic lesions | 99.69 | 99.17 | 98.28 | 97.34 | 97.49 |
| Healthy | 99.75 | 99.51 | 99.46 | 95.61 | 95.42 |
| Overall | 99.60 | 98.95 | 98.18 | 97.11 | 97.03 |
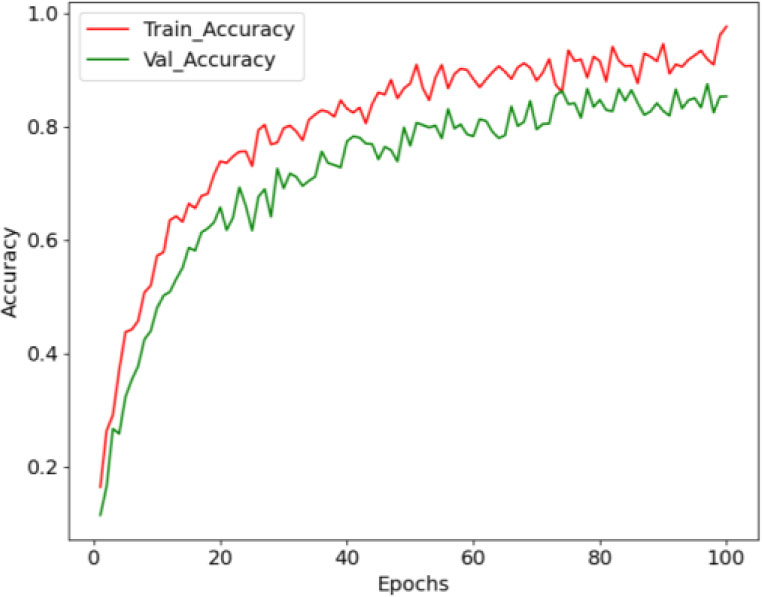
Fig. 7.
Accuracy curve of the proposed BTS-NEUNET method.
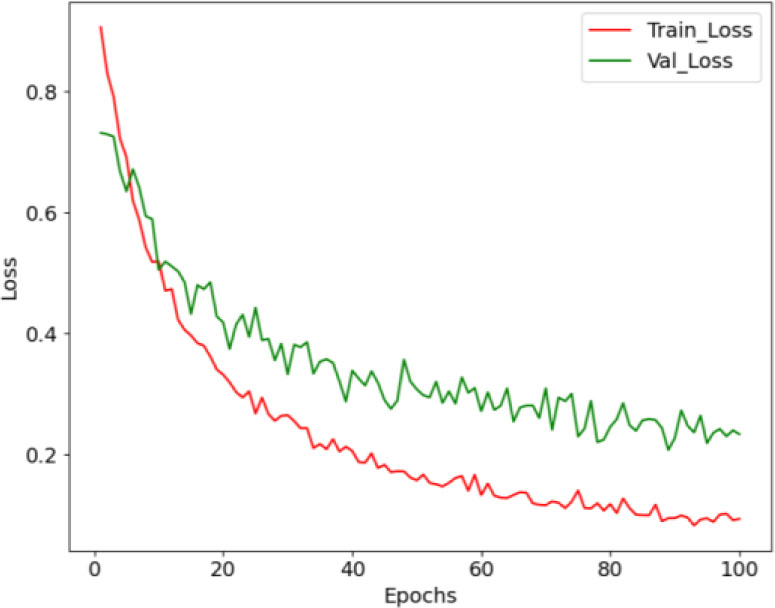
Fig. 8.
Loss curve of the proposed BTS-NEUNET method.