
Brain tissue is clearly visualized at high resolution using nuclear magnetic resonance imaging. It is a widely used method for identifying brain diseases [1]. There are several important brain regions, including grey matter, white matter, and cerebrospinal fluid [2]. The role of these tissues in memory, cognition, and consciousness is enormous. Leukodystrophy and cerebral atrophy expansion are severe brain dysfunction disorders that are common in young children and the elderly [3]. The segmentation enables objective diagnosis and research, rather than expert eye inspection, by providing a quantitative assessment of brain tissue volume [4]. The volume changes in specific areas of the brain can serve as significant biomarkers. A popular method for automatically discriminating brain tissue is statistical parametric mapping (SPM) [5]. The software has been developed by researchers at the Wellcome Department of Imaging Neuroscience at the University College London. Numerous automatic segmentation techniques have long computation times and employ exhaustive search strategies [6]-[7]. These approaches can also incorporate soft computing techniques. Manual segmentation is the procedure by which an expert or doctor manually separates pixels with the same intensity range. It uses a multidisciplinary board of highly qualified medical professionals to make decisions [8].
The automated segmentation of brain tissue faces three primary challenges. First, there are significant differences in brain structure across phenotypes, including age, gender, race, and illness [9]. This makes it challenging to apply a single segmentation technique across all phenotypic categories [10]. Secondly, challenges may arise due to variations in cytoarchitecture, including gyral folds, thin tissue design, sulci depths, and smooth tissue boundaries. This makes categorical classification into different tissue classes confusing and complicated, even for a human expert [11]. Finally, there are limitations to imaging technology concerning motion artifacts in the recorded magnetic resonance imaging (MRI) images, signal-to-noise ratio, and scanner bias effects [12]. Most automatic methods for brain tissue segmentation use manually constructed features. These methods use a conventional data mining pipeline, in which features are first extracted and then fed into a classifier whose training process does not alter the features' properties [13]. A different method for creating task-adapted feature representations is to use in-domain data to directly learn a hierarchy of progressively sophisticated features [14]-[15]. Tissue segmentation in MRI images poses challenges due to intensity inhomogeneities that affect tissue differentiation and lead to uneven signal variations. Moreover, overlapping tissue intensities can result in misclassification and reduced segmentation accuracy. To overcome this, a novel BTS-NEUNET is proposed for brain tissue segmentation based on multimodal MRI images. The key contributions of this work are as follows:
Initially the input brain MRI images, such as T1W, T2W, perfusion-weighted imaging (PWI), and diffusion-weighted imaging (DWI), are pre-processed using the wavelet transform-based bilateral (WTBB) filter and the curvelet transform-based adaptive Gaussian notch (CTBAGN) filter to enhance image quality.
Then, the improved DenseGoogLe network is used to extract relevant features from the enhanced multimodal MRI images.
A White Shark Optimization Algorithm is used to select the features from the MRI images.
A Deep Belief Network (DBN) classification network is used to segment the white matter, gray matter, cerebrospinal fluid, and ischemic lesions of the brain.
Finally, the four types of brain tissues are segmented using a Nested Attention-based U-Net.
The following is the structure of the research: The relevant literature is thoroughly summarized in Section 2; the suggested BTS-NEUNET for brain tissue segmentation is explained in Section 3. Section 4 displays the results and discussion. Section 5 presents the conclusion and recommendations for further research.
Several deep learning-based methods for brain tissue segmentation have recently been released to assist radiologists in doing more accurate diagnostic assessments. This section summarizes some of the most recent research works.
In 2021, Zhang et al. [16] proposed a DL technique, known as DDSeg, for MRI diffusion segmentation. The suggested approach improves the accuracy of anatomical MRI-to-dMRI registration by learning tissue segmentation from HCP's high-quality image data. The DKI parameters are computed using the recently proposed mean-kurtosis-curve approach. The additional features offered by this method help distinguish between different tissue types and account for illogical DKI parameter values.
In 2021, Karayegen and Aksahin [17] proposed a CNN-based semantic segmentation method that uses 3D brain tumor segmentation (BraTS) images to segment brain tumors automatically. The evaluation results of semantic segmentation performed by a DL network show significant potential for tumor prediction. The 3D imaging measurements and semantic segmentation are crucial for precisely detecting brain cancers.
In 2021, Veluchamy and Subramani [18] proposed a medical decision assistance system that uses brain tissue segmentation. A modified fuzzy c-means clustering algorithm was subsequently used to segment the enhanced brain MRI. The suggested approach provides radiologists and clinical facilities substantial support and confirms its success in brain tissue segmentation. The experimental findings demonstrate that this suggested model successfully balances noise and intensity inhomogeneity.
In 2022, Ottom et al. [19] proposed a novel deep neural network (DNN) architecture to differentiate MR images from 2D brain malignancies. The ZNet model was used independently to identify and segment brain tumors in MR images, based on the tumor masks generated by DNNs. This study provides a helpful instance of AI applied to medical imaging, offering a tool for automatically identifying cancers in MRI images.
In 2021, Khan et al. [20] proposed a VGG19 CNN model for thorough brain tumor segmentation and classification using MRI data. Numerous tests were conducted to assess the proposed method on benchmark datasets from BraTS 2015. The outcomes validate the suggested method's effectiveness and demonstrate that it outperformed the previously documented cutting-edge methods in terms of accuracy.
In 2022, Agrawal et al. [21] developed the 3D-UNet model, which employs CNN to categorize and segment volumetric tumors in MRI data. The present research aims to develop a practical DL framework for brain tumor classification and segmentation. The three most prevalent kinds of brain cancers are specially treated using the CNN model.
In 2023, Nizamani et al. [22] proposed four feature-enhanced hybrid U-Net (FE-HU-NET) models designed to optimize the segmentation pipeline's preparation, segmentation, and post-processing stages. The HU-Net module is exceptionally effective at correctly distinguishing between brain tissues, especially compared to other designs. CNN-based post-processing, combined with the creation of tailored layered structures within the U-Net model, produces better segmentation results.
In 2024, Kollem et al. [23] proposed an optimal support vector machine (SVM) method to categorize and segment MRI brain tumor tissue. The contourlet transform uses a twin filter bank arrangement consisting of a directed filter bank and a Laplacian pyramid to provide a sparse representation of the smooth contours of an image. The proposed technique was tested for accuracy, sensitivity, and specificity using the BraTS2021 and Figshare datasets.
In 2024, Daoudi and Mahmoudi [24] proposed HMRF-WOA for brain tissue segmentation and classification using MRI brain imaging. The Whale Optimization Algorithm (WOA) and the Hidden Markov Random Field (HMRF) model are two algorithms that are combined in the proposed segmentation process to improve treatment accuracy. The experimental results from a collection of brain MR scans show that the proposed strategy is more effective than earlier techniques.
In 2024, Gudise et al. [25] proposed an enhanced Firefly Algorithm (FA) based on chaos, integrated with Fuzzy C-means (FCM), to segment brain tissues from brain MRIs. The FA and a chaotic map are used together with a spatially modified FCM method called CEFAFCM to initialize the firefly population. The experimental findings show that the proposed method outperforms several current brain MRI segmentation techniques.
In the above literature review, several deep learning techniques were employed in the brain tissue segmentation. It introduces high computational complexity, which may limit real-time processing and deployment on devices with limited resources. To address this, a novel BTS-NEUNET has been proposed for high-accuracy brain tissue segmentation.
In this section, a novel BTS-NEUNET is proposed for brain tissue segmentation based on multimodal MRI images. Initially, the input brain MRI images, such as T1W, T2W, PWI, and DWI, are pre-processed using the WTBB filter and CTBAGN filter to enhance image quality. Then, the improved DenseGoogLe network is used to extract relevant features from the enhanced multimodal MRI images. A White Shark Optimization Algorithm is used to select the features from the MRI images. The DBN classification network is used to segment four types of brain tissue: white matter, grey matter, cerebrospinal fluid, and ischemic lesions. Finally, the four types of brain tissues are segmented using a Nested Attention-based U-Net. Fig. 1. illustrates the proposed BTS-NEUNET method.
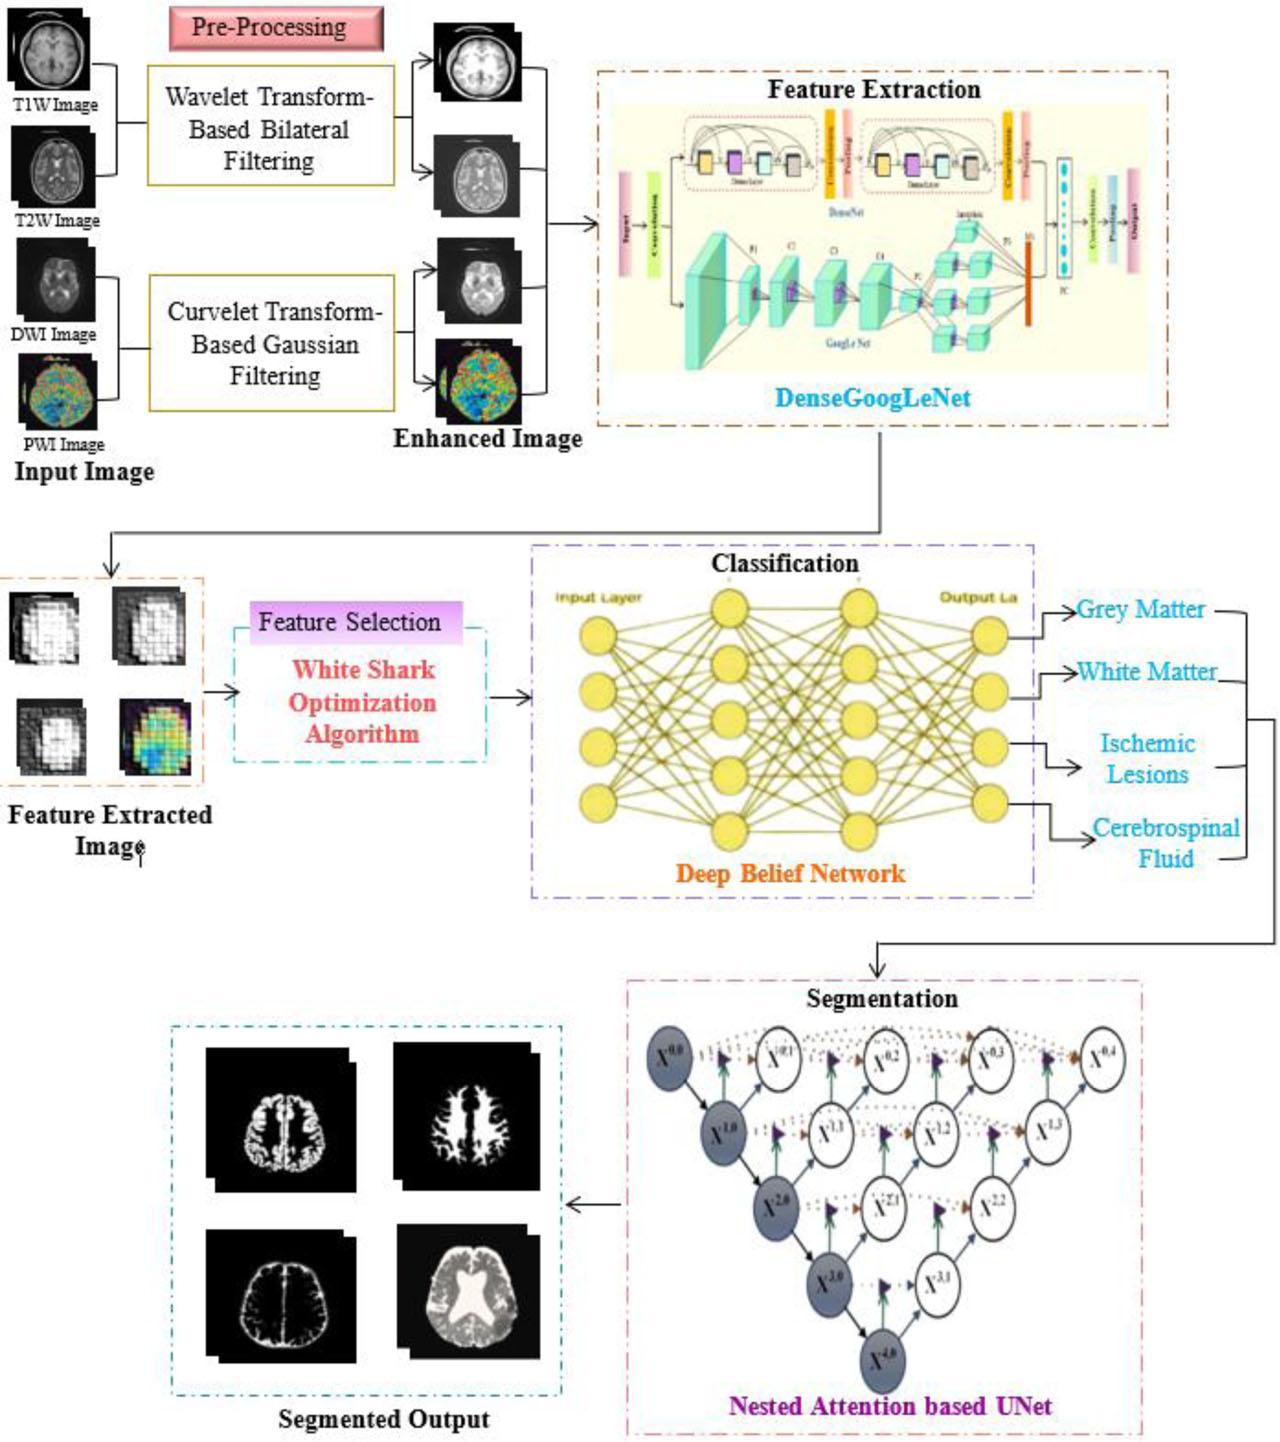
Proposed BTS-NEUNET model.
In this section, the T1W and T2W MRI images of the brain are pre-processed using the WTBB filter and the PWI, and DWI images of the brain are pre-processed using the CTBAGN filter to enhance the quality of the images.
Pre-processing is a technique for removing unwanted noise and smoothing images using the WTBB filter. Bilateral filtering combined with the wavelet transform is a useful method for reducing noise while maintaining significant T1W, T2W, PWI, and DWI image features in MRI. The wavelet transform substitutes a finite fading wavelet basis for the Fourier transform's infinite trigonometric basis. The positive and negative parts of the frequencies are separated by the Hewlett-Packard (HP) channels. The integral value of the wavelet basis is zero, its energy is finite, and it typically focuses around a single point. A popular and effective local technique for processing digital images, based on the geometry and intensity distances between nearby pixels, is bilateral filtering.
The general shape of the wavelet sequence is shown below and was obtained by scaling and translating the mother wavelet function.
Here, φ typically represents the function that depends on the variable h. The scale factor x and the time shift y are theoretically continuously changing during the wavelet transform process, and this calculation takes a finite amount of time for a computer to complete. The wavelet transform, also referred to as the discrete wavelet transform (DWT), assumes that the time shift y and the scale factor x are discrete, based on specific constraints. The analysis of images is more precise and effective if the scale factor x and the temporal shift y are selected with a power of 2. The wavelet function is expressed as
The adaptive Gaussian notch filter with curvelet transform is intended to eliminate noise from T1W, T2W, PWI, and DWI MRI images caused by interferences during image capture. The Adaptive Gaussian Notch Filter converts the image's spatial domain to the frequency domain to detect and locate regions where noise is a problem. The window size of the notch filter is adjusted to match the size of the noisy peak areas. Let Y represent the distorted view of a P × Q original image X, and let Ya,b stand for the intensity value at (a, b) such that 0 ≤ a < P and 0 ≤ a < Q. A noisy observation image that has been tainted by periodic or quasi-periodic sounds is indicated by
Here, Gi,j denotes the Fourier transform of Y at position (i, j). In contrast to wavelets and Fourier transforms, the curvelet transform requires fewer coefficients, making it a good choice for images with sharp edges. The first generation of the curvelet transform relies on unequally-spaced Fast Fourier transforms (USFFT), while the subsequent generation employs frequency wrapping of specific Fourier samples.
In this section, the denoised MRI images are processed using DenseGoogLeNet for feature extraction. It is a combination of DenseNet and an inception model from GoogLeNet. It uses a hierarchical feature-extraction approach, combined with effective feature reuse, to extract relevant characteristics from images. DenseNet is a cutting-edge CNN architecture for visual object detection that uses fewer parameters. With a few key differences, DenseNet and ResNet are relatively comparable. The architecture of DenseGoogLeNet is shown in Fig. 2.
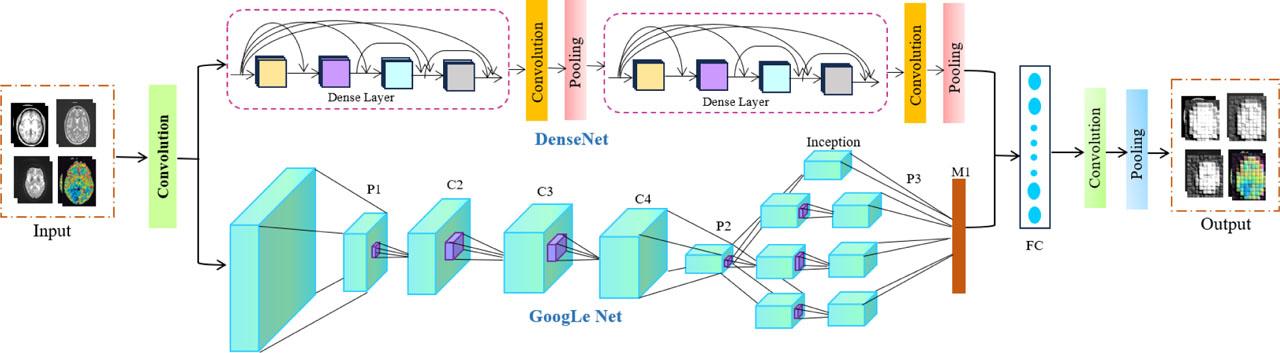
Architecture of DenseGoogLeNet.
The output layers (ith) are often calculated using conventional CNNs, applying the output of the previous layer Yi−1 to a non-linear transformation Ri(.).
The layer output functionality maps are concatenated by DenseNets rather than summarizing them with the inputs. To enhance information flow across layers, DenseNet offers a straightforward approach: The features of the previous layers' inputs are transmitted to the ith layer. The equation (6) is then changed to:
The model parameters are significantly reduced by two auxiliary classifiers, dimensionality reduction, and mapping using a 1 × 1 convolutional kernel and a fully connected layer instead of the average pooling layer. The model was created to classify the original image in the domain (𝒟1). The dataset of the labelled images is shown as
The output of the feature-extraction functions is represented by H applied to input xi. H1024 represents the output in a vector with 1024 dimensions. The detection sequence is converted into a feature vector by extracting each pixel using DenseGoogLe Net.
The White Shark Optimizer (WSO) is an advanced metaheuristic model used to select relevant features from medical images. The movements of great white sharks, which use their extraordinary senses of smell and hearing for navigation and foraging, have influenced the main idea and basic notion of this algorithm. These special components can be theoretically and numerically studied to balance the analysis and execution of this strategy effectively. The supporting search agents explore and use each possible zone within the search area to improve optimization. To eventually achieve the desired results, WSO's search agents may arbitrarily adjust their positions based on the closest optimal possibilities. Some of the functional linkages involved in the WSO are evaluated in this investigation. A white shark's location can be estimated using (11).
The maximum and minimum speeds at which great white sharks can move are denoted by bmax and bmin. In this scenario, pmax and pmin are assumed to be 1.5 and 0.5, respectively. The flowchart of White Shark Optimization Algorithm is shown in Fig. 3.
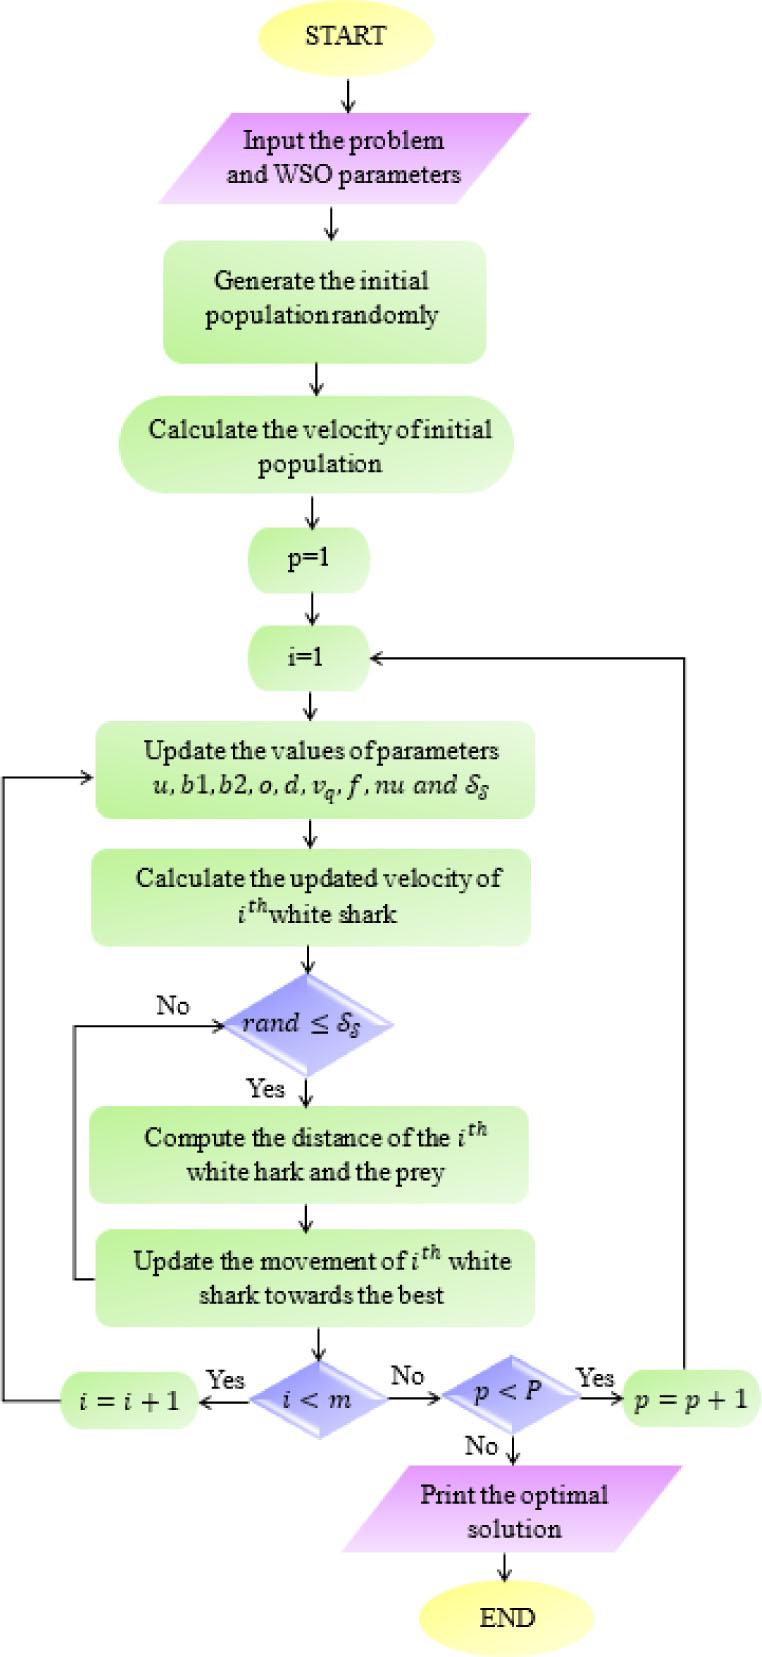
Flowchart of White Shark Optimization Algorithm.
In the meantime, P is the present version, identified by p and the maximum iteration. The following formula is employed to update the white shark position:
The process of finding the best shark was described as follows:
DBNs are probabilistic generative models containing several Restricted Boltzmann Machines (RBMs). Discriminative supervised fine-tuning is used to train DBNs with greedy unsupervised layer-wise pre-training. In DBN, weight connections only exist between neighboring layers; buried neurons do not share any connections within the same layer. An RBM with one visible and one hidden layer is the basic building block of a DBN. The hidden layer of a prior RBM is assumed to be the visible layer of the subsequent RBM when building a DBN. Pre-training each RBM layer by layer, from the bottom to the top, is typically how a DBN is learned. Then, supervised learning techniques are employed to optimize the entire network. The output layer uses the probability distribution from the preceding layer to produce the expected forecast. Fig. 4 shows the DBN architecture.
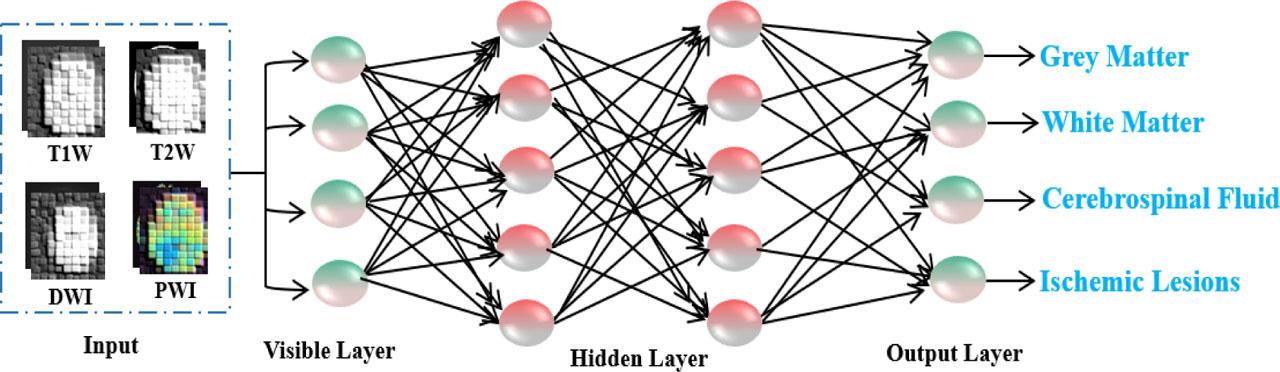
Architecture of a DBN.
An RBM is an undirected generative model that is based on energy. The formula for its energy function for a given set of states (w, t) is as follows:
There is a connection between the i neurons in the hidden layer and the j neurons in the visible layer, represented by vij . The component form is displayed earlier; however, the matrix form is an alternative:
The joint probability distribution of the state (W, T) can be obtained by using the following energy function:
Data are normalized using a normalization factor, also referred to as a partition function. The four types of brain tissues such as white matter, cerebrospinal fluid, grey matter, and ischemic lesions are classified.
A Nested Attention-based U-Net is used to segment the brain tissue diseases of the classified white matter, cerebrospinal fluid, grey matter, and ischemic lesions. Combining task-related selections with features extracted at other craters is possible. Fig. 5 depicts the Nested Attention U-Net topology. The Nested Attention U-Net is composed of a decoder and an encoder, connected by a series of thick nested convolutional blocks.
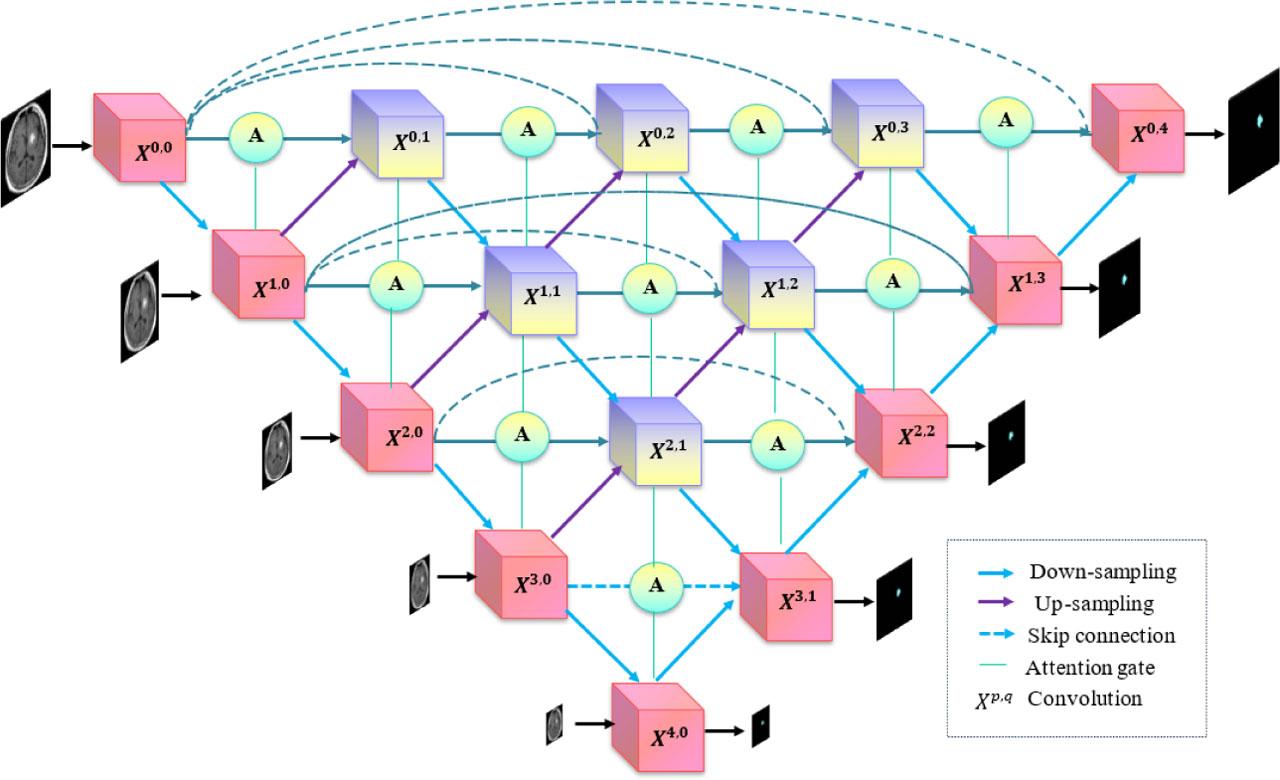
Structure of Nested Attention U-Net.
In addition, the model was more flexible by having the final outputs of X0,1, X0,2, and X0,3 connected directly at the same time, which is equivalent to the network trim. Additionally, by using skip connections to propagate feature information more efficiently, attention gates (AG) can be used. The portion of the encoder that corresponds to the augmenting path and its up-sampling function is the AG inputs. The former serves as a gating signal to suppress regions unrelated to the mission and to enhance the target area's learning related to the segmentation objective.
Thus, AG can improve the productivity of producing semantic data by removing linkages. Furthermore, the focus coefficient α is obtained by training the Gate's parameters to converge using the sigmoid activation function. To obtain the output, multiply each pixel of the encoder characteristic by coefficient α. The decoder retrieves the feature in a bottom-up way, using the circular edge feature at each layer. The output of node Xp is represented by the matrix Xp,q, where p and q are the convolutional layer of dense blocks in conjunction with the skip connection index and the sampling layer beneath the encoder index. The formula that follows is used to ascertain the characteristic graph stack that Xp,q represents:
The Nested Attention U-Net gives each output node a brief introduction to the sigmoid function and the convolution layer. The loss function in DL measures how discordant the actual results are from the predictions. The stronger the model's robustness, the less the function's loss value as training time increases. Consequently, the Nested Attention U-Net training process's loss function has adapted the binary cross-entropy (BCE) loss:
In the Nested Attention U-Net prediction output, zp represents the predicted label at pixel p, The total of all pixel losses is the loss to the image. Greater significance will be attributed to the loss if there is a notable discrepancy between the marked and the expected images. Finally, the Nested Attention U-Net segmented the grey matter, white matter, cerebrospinal fluid, and ischemic lesions features from the Brain MRI images.
An experimental setup for this research has been implemented in MATLAB 2019b using a deep learning toolbox. The brain MRI images from the collected dataset are divided into five categories in this analysis of the results. By applying the ADNI and ISLES datasets, the success is assessed using the proposed method's Accuracy, Precision, Recall, Specificity, and F1-Score.
The ADNI is a large-scale, longitudinal collection of imaging and clinical data that aims to improve Automated brain tissue segmentation. It is a longitudinal study of more than 8000 MRI scans from 2000 participants, including those with normal cognitive abilities. The data can be used to study disease progression at very early stages, since it provides data across a wide age range.
ISLES are the datasets presented to the public in stroke segmentation competitions, held within the scope of “The International Conference on Medical Image Computing and Computer-Assisted Intervention (MICCAI)”. The ISLES dataset consists of 156 PWI, and DWI MRI images of the brain. Of these, 94 images are under training, and 62 are under testing. It captures blood flow dynamics in brain tissue using contrast-based or arterial-spin–labeling techniques. PWI is included among the MRI inputs (along with T1W, T2W, and DWI) for accurate brain tissue segmentation. These datasets provide a comprehensive collection of different sequences for acute and sub-acute stroke instances.
Fig. 6 illustrates the virtual result of the proposed BTS-NEUNET method using the ADNI and ISLES datasets. The patient data are described in column 1. The names of the multimodal MRI images, such as T1W, T2W, DWI, and PWI, are displayed in column 2. The brain's multimodal MRI images are presented in column 3. The pre-processed multimodal images are described in column 4. The feature extracted images are illustrated in column 5. Column 6 shows the four classification outcomes of the proposed BTS-NEUNET approach. Finally, the segmented output of the brain tissue is illustrated in column 7.
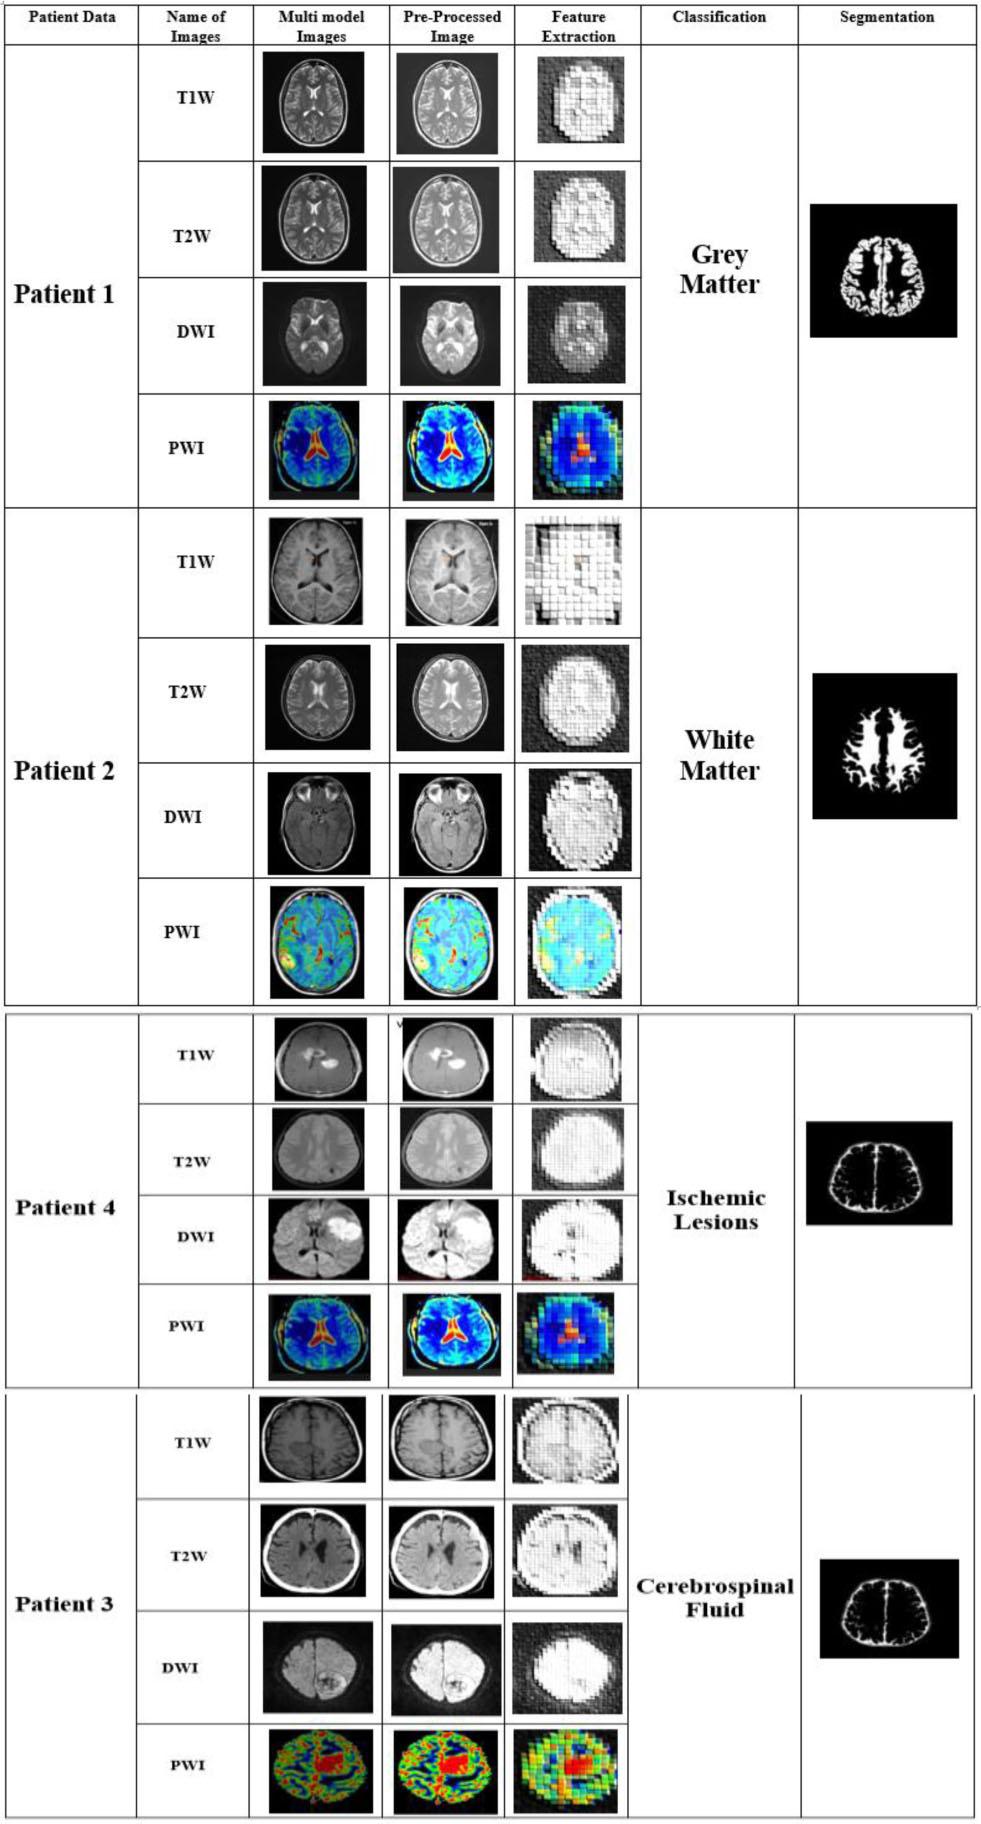
Experimental result of the proposed BTS-NEUNET.
The performance of the proposed model is evaluated using the following statistical metrics: Accuracy, Precision, Recall, Specificity, and F1-Score.
True-Positive, False-Positive, True-Negative, and False-Negative are all represented by the symbols True+, True−, False+, and False−, respectively.
Table 1 shows the performance evaluation of the proposed BTS-NEUNET approach for brain tissue segmentation. The overall Accuracy, Precision, Recall, Specificity, and F1-Score of the proposed BTS-NEUNET approach are 99.60 %, 98.95 %, 98.18 %, 97.11 %, and 97.03 %, respectively.
Performance of the proposed BTS-NEUNET method.
| Classes | Accuracy [%] | Precision [%] | Recall [%] | Specificity [%] | F1-Score [%] |
|---|---|---|---|---|---|
| Grey matter | 99.75 | 97.69 | 98.52 | 98.62 | 97.64 |
| White matter | 99.85 | 98.91 | 97.74 | 97.41 | 98.17 |
| Cerebrospinal fluid | 98.96 | 99.45 | 96.92 | 96.58 | 96.43 |
| Ischemic lesions | 99.69 | 99.17 | 98.28 | 97.34 | 97.49 |
| Healthy | 99.75 | 99.51 | 99.46 | 95.61 | 95.42 |
| Overall | 99.60 | 98.95 | 98.18 | 97.11 | 97.03 |
Fig. 7 shows an accuracy curve with epochs on the x-axis and accuracy rate on the y-axis. A high accuracy level of 99.60 % based on the epochs is shown by the training and testing accuracy curves. Fig. 8 displays the loss curve, with epochs on the x-axis and the loss rate on the y-axis. The proposed BTS-NEUNET performs well during testing and training.
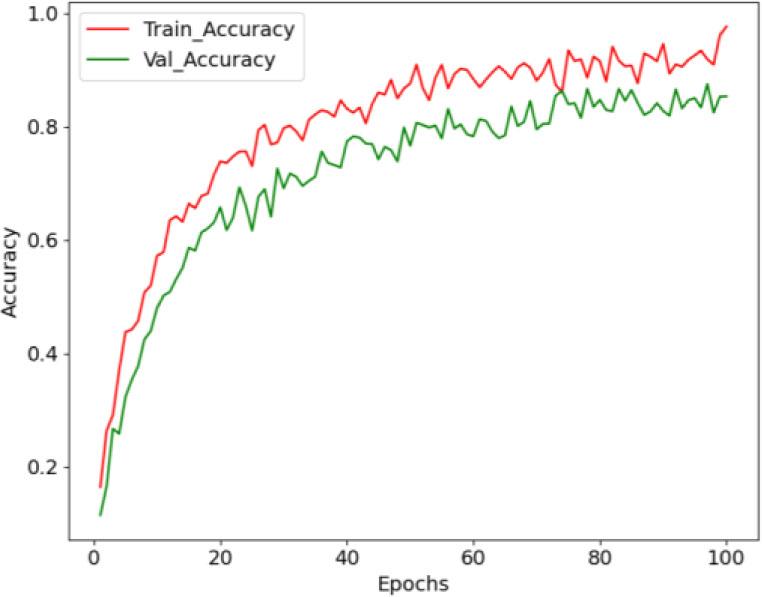
Accuracy curve of the proposed BTS-NEUNET method.
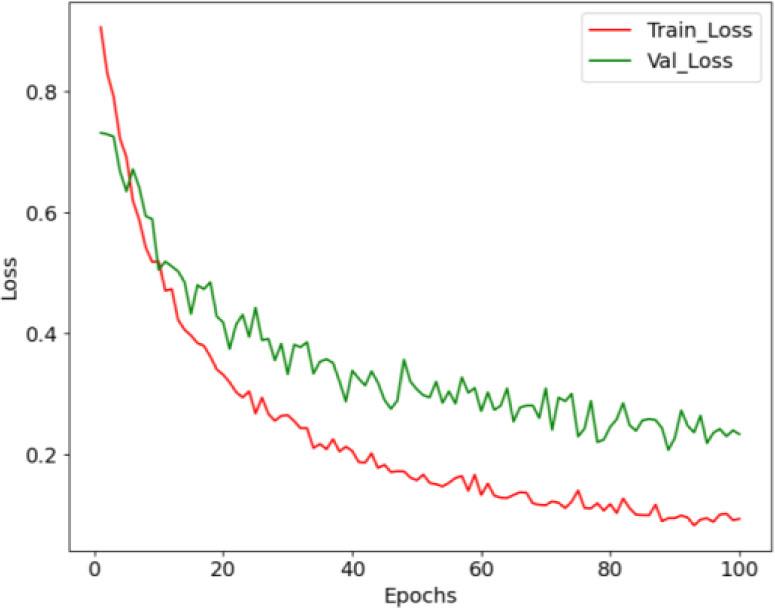
Loss curve of the proposed BTS-NEUNET method.
The deep network was determined to be the most effective method after evaluating the effectiveness of previous methods. Four deep learning networks, such as ShuffleNet, ResNet, GhostNet, and MobileNet, as well as the proposed network, were tested. To assess the effectiveness of current methods and demonstrate the superiority of the proposed network technique, we use Accuracy, Precision, Recall, Specificity, and F1-Score. Table 2 shows the results of a comparative analysis conducted between existing techniques and the proposed model.
Comparison of a traditional network with the proposed DenseGoogLeNet.
| Technique | Accuracy [%] | Precision [%] | Recall [%] | Specificity [%] | F1-Score [%] |
|---|---|---|---|---|---|
| ShuffleNet [26] | 97.96 | 93.61 | 93.21 | 96.84 | 94.21 |
| ResNet [27] | 95.07 | 92.08 | 87.60 | 94.59 | 91.03 |
| Ghost Net [28] | 98.84 | 87.02 | 94.71 | 93.62 | 89.61 |
| MobileNet [29] | 95.66 | 94.42 | 92.35 | 97.85 | 95.87 |
| DenseGoogLeNet | 99.60 | 98.95 | 98.18 | 97.11 | 97.03 |
Table 2 compares the performance of different neural networks for feature extraction across Accuracy, Precision, Recall, Specificity, and F1-Score. The proposed DenseGoogLeNet method for feature extraction achieves an overall Accuracy of 1.64 %, 4.53 %, 0.76 %, and 3.94 % higher than ShuffleNet [26], ResNet [27], GhostNet [28], and MobileNet [29], respectively.
Table 3 illustrates the accuracy evaluation of the proposed technique with the existing DDSeg, optimal SVM, and CEFAFCM methods. The proposed BTS-NEUNET method improves overall Accuracy by 1.92 %, 1.34 %, and 1.74 % over existing methods such as DDSeg, optimal SVM, and CEFAFCM. However, the aforementioned techniques do not perform as well as the proposed method. The proposed method outperforms other models, achieving precise results with 99.60 % Accuracy.
In this paper, a novel BTS-NEUNET was proposed for brain tissue segmentation using multimodal MRI images. The multimodal MRI images, such as T1W, T2W, PWI, and DWI, undergo pre-processing using the WTBB and CTBAGN filters to enhance image quality. An improved DenseGoogLe network was used to extract the relevant features from the enhanced multimodal images. The proposed BTS-NEUNET method uses the WSO Algorithm to select features from the MRI images. The four types of brain tissues, such as grey matter, white matter, cerebrospinal fluid, and ischemic lesions, are classified using a DBN. Brain tissues are classified using a nested, attention-based U-Net. The proposed DenseGoogLeNet method for feature extraction achieves an overall Accuracy of 1.64 %, 4.53 %, 0.76 %, and 3.94 % higher than ShuffleNet, ResNet, GhostNet and MobileNet, respectively. The proposed BTS-NEUNET method achieves the highest Accuracy rate of 99.60 %. The proposed BTS-NEUNET method improves overall Accuracy by 1.92 %, 1.34 %, and 1.74 % over existing methods, such as DDSeg, optimal SVM, and CEFAFCM. Future work will involve integrating transformers for enhanced segmentation and deploying real-time edge computing to improve disease characterization.