
Fig. 1.
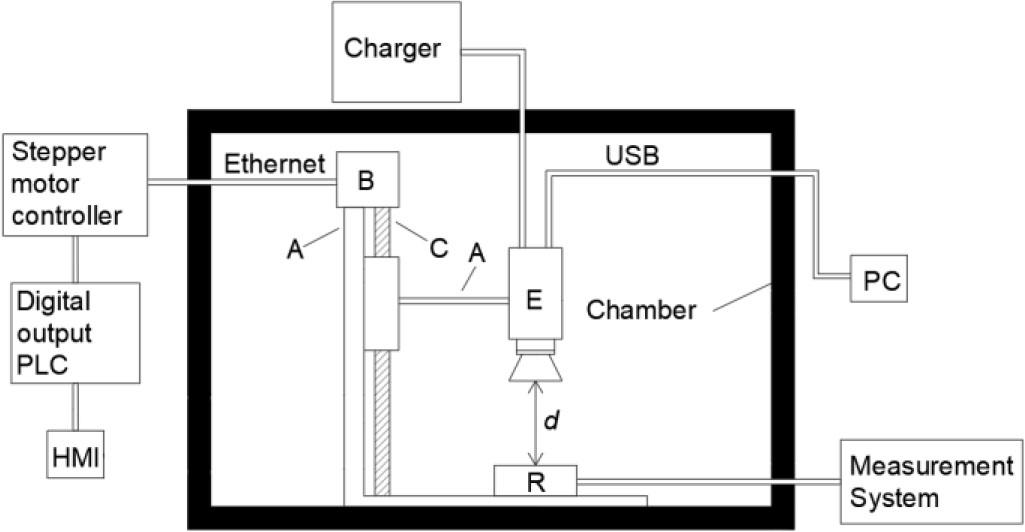
Fig. 2.
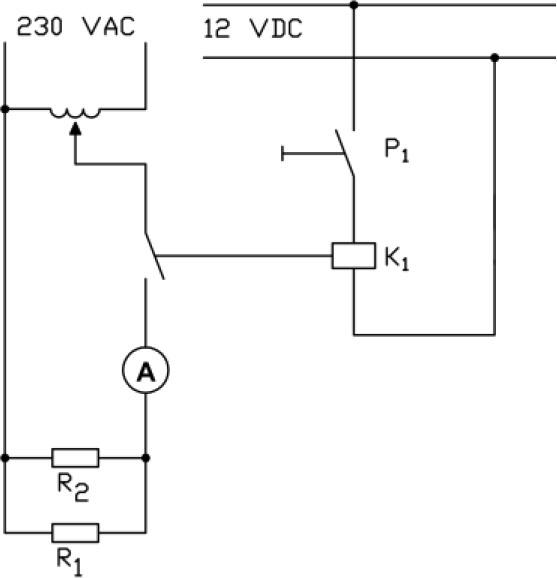
Fig. 3.
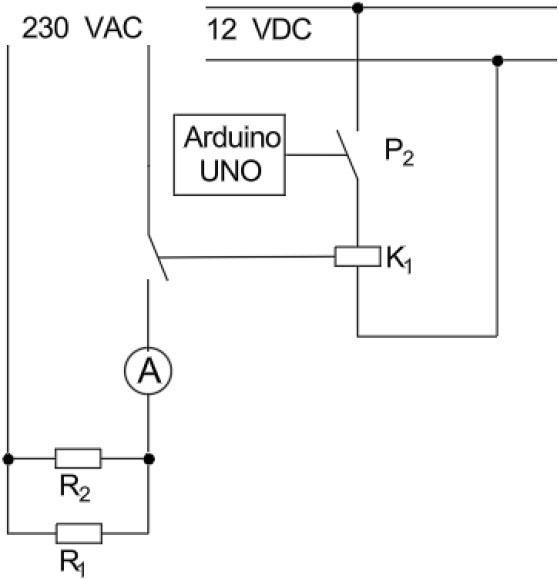
Fig. 4.
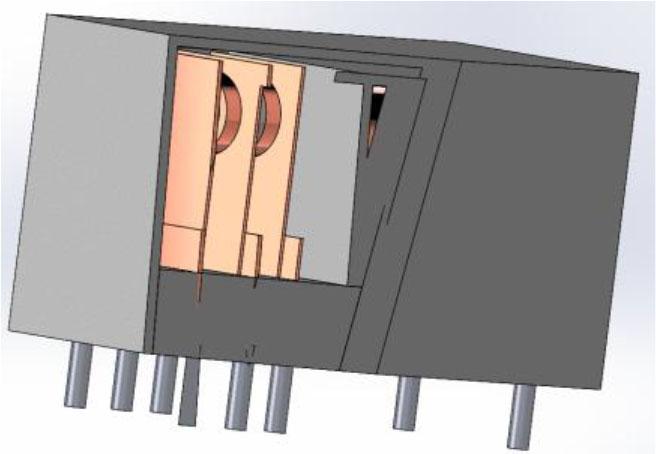
Fig. 5.
The values of coefficients elam, eturb, flam, and fturb_
| Shape | Gr ⋅ Pr | elam | eturb | elam | eturb |
|---|---|---|---|---|---|
| Vertical flat wall | 109 | 0.59 | 0.129 | 0.25 | 0.33 |
| Upper flat wall | 108 | 0.54 | 0.14 | 0.25 | 0.33 |
| Lower flat wall | 105 | 0.25 | NA | 0.25 | NA |
Edge size of the mesh element and the corresponding simulation time and simulation accuracy_ The values of ΔTcs represent the largest recorded differences in the determined contact temperatures Tcs among the five simulations_
| No. | Mesh element edge [mm]length | Simulation [s]time | ΔTcs [K] |
|---|---|---|---|
| 1 | 2.0 | 16 | 2.5 |
| 2 | 1.0 | 64 | 0.8 |
| 3 | 0.7 | 175 | 0.2 |
| 4 | 0.5 | 473 | 0.1 |
| 5 | 0.2 | 3 139 | 0.1 |
The obtained values of the contact temperature Tcs (from simulation), package temperature Tps (from simulation), and the temperatures Tct (contact temperature measured with the thermocouple) and Tpt (package temperature measured with the thermocouple)_
| No. | Tcs [K] | Tct [K] | Tps [K] | Tpt [K] |
|---|---|---|---|---|
| 1 | 293.1 | 293.2 | 292.7 | 293.2 |
| 2 | 294.2 | 294.2 | 293.5 | 293.2 |
| 3 | 297.3 | 297.2 | 294.7 | 294.2 |
| 4 | 302.6 | 301.2 | 298.4 | 297.2 |
| 5 | 306.8 | 305.2 | 300.1 | 299.2 |
| 6 | 312.8 | 312.2 | 302.1 | 301.2 |
| 7 | 321.5 | 320.2 | 307.3 | 305.2 |
| 8 | 333.8 | 332.2 | 315.1 | 314.2 |
| 9 | 341.0 | 339.2 | 322.1 | 320.2 |
Measurement results for seven successive relay operating cycles with a pause time of 500 ms between ON/OFF switching operations_
| No. | Tpcam [K] | Tpt [K] | Tps [K] | Tcs [K] |
|---|---|---|---|---|
| 1 | 302.1 | 302.15 | 302.5 | 310.9 |
| 2 | 306.3 | 306.15 | 306.6 | 318.3 |
| 3 | 309.0 | 309.15 | 309.1 | 322.7 |
| 4 | 311.2 | 311.15 | 310.8 | 325.8 |
| 5 | 309.6 | 310.15 | 309.4 | 323.3 |
| 6 | 312.4 | 312.15 | 312.7 | 329.2 |
| 7 | 314.0 | 314.15 | 314.1 | 331.7 |
Measurement results for seven successive relay operating cycles with a pause time of 100 ms between ON/OFF switching operations_
| No. | Tpcam [K] | Tpt [K] | Tps [K] | Tcs [K] |
|---|---|---|---|---|
| 1 | 311.3 | 311.15 | 311.1 | 326.3 |
| 2 | 313.8 | 313.15 | 313.5 | 330.6 |
| 3 | 317.8 | 317.15 | 317.6 | 337.9 |
| 4 | 319.6 | 319.15 | 319.4 | 341.1 |
| 5 | 322.0 | 322.15 | 321.8 | 345.4 |
| 6 | 322.8 | 323.15 | 322.7 | 347.0 |
| 7 | 325.4 | 324.15 | 325.2 | 351.5 |
Measurement results for seven successive relay operating cycles with a pause time of 300 ms between ON/OFF switching operations_
| No. | Tpcam [K] | Tpt [K] | Tps [K] | Tcs [K] |
|---|---|---|---|---|
| 1 | 301.7 | 301.15 | 301.5 | 309.1 |
| 2 | 307.5 | 307.15 | 307.3 | 319.5 |
| 3 | 312.9 | 312.15 | 312.6 | 329.0 |
| 4 | 315.8 | 316.15 | 315.4 | 334.0 |
| 5 | 317.9 | 318.15 | 317.3 | 337.4 |
| 6 | 320.1 | 320.15 | 319.6 | 341.5 |
| 7 | 323.9 | 322.15 | 323.5 | 348.5 |
Summary of the materials assigned to individual components of the relay model and their corresponding thermal conductivity coefficients λ_
| Part of the relay | Material | λ [W/m∙K] |
|---|---|---|
| Coil | Copper | 385 |
| Contact | Copper | 385 |
| Case | Plastics | 0.22 |
| Leads | Aluminum | 204 |