
An electromechanical relay is a component that enables the control of an electrical circuit carrying a high current using a control signal of significantly lower amplitude [1]. The device provides galvanic isolation between the two circuits. As a result, safety is ensured – the galvanic separation eliminates the risk of breakdown from the high-current circuit to the low-current circuit [2]. The relay consists of a coil, a set of contacts, and a package [3]. Owing to its simple design and low production cost, this type of relay is widely used in various industrial applications as well as in railway control systems [4].
In scientific publications, two primary approaches to diagnosing electromechanical relays are identified: direct testing, based on electrical measurements [5], [6], and indirect testing, which involves analyzing operational parameters such as surface temperature [7]. The temperature of the relay contacts plays a crucial role, as it significantly affects the device’s reliability, lifespan, and proper functioning.
According to Joule–Lenz’s law [8], the temperature of relay contacts depends on the current flowing through them and on the contact resistance [9]. The value of the contact resistance (resistance between the contacts) changes during operation due to mechanical wear and progressive oxidation processes [10]. It also depends on the contact material, the effective contact area, and the contact force [11]. As these phenomena occur, both the temperature of the contacts and their resistance continue to increase. Additionally, the formation of electric arcs [12] contributes to local heating of the contacts and a gradual reduction of their effective conductive surface.
Excessive contact temperature may result in an increased voltage drop across the relay and higher power losses in its current path [13]. It can also lead to improper device operation [14]. Therefore, monitoring the contact temperature is an important aspect of relay diagnostics. Due to the small size of the contacts and their location inside the package, direct temperature measurement is difficult.
There are two primary methods for measuring the temperature of relay contacts. One of them, the contact method, involves opening the package and placing a temperature sensor as close to the relay contacts as possible. Applying the contact method to measure the temperature of relay contacts is a challenging task. Due to the small size of the contacts, positioning the temperature sensor near them requires high precision and experience. Additionally, the transition resistance between the relay element and the temperature sensor is unknown, as is the contact pressure between the sensor and the surface. Moreover, the operating conditions of the relay contacts in an open package differ from those in a closed one [15].
These problems can be eliminated by using thermography. This non-contact method is based on detecting infrared radiation emitted by the observed surface. To preserve the operating conditions of the relay contacts, an indirect thermographic temperature measurement can be applied. This approach consists of two steps. The first involves performing a thermographic measurement of the relay package temperature at a point located directly above the contacts. The second step involves determining the contact temperature based on the results of the thermographic surface temperature measurement (from the first step) and on simulation studies.
In the available literature, examples can be found of using thermography to analyze the operation of relays, where histograms obtained during experimental measurements were compared [16]. However, no studies have been reported that examine the relationship between the temperature of relay contacts and the package temperature determined by the thermographic method. There is also a lack of research describing indirect measurement of contact temperature using thermal imaging techniques. For this reason, it was decided to conduct a study in this area.
The indirect thermal imaging measurement of relay contact temperature consists of two stages: the first involves performing a thermographic measurement of the relay package temperature Tpcam, and the second determines the relationship between the contact temperature Tc and the measured package temperature Tpcam. For the experimental study, a Relpol RM85-2011-35-1012 relay was used, featuring a coil voltage of Vc = 12 V and a rated contact current of 16 A [17].
To obtain reliable results of the thermographic measurement of temperature Tpcam, a dedicated measurement setup was designed and built. Its main component was the Flir E50 thermal imaging camera operating in the long wavelength infrared (LWIR) range. The device is equipped with an array of uncooled microbolometer detectors with a resolution of 180 × 240 pixels. The instantaneous field of view (IFOV) value is 1.82 mrad, which allows nine detector fields to be projected onto the relay package surface. The noise equivalent differential temperature (NEDT) parameter of 50 mK [18] enables the detection of small temperature variations on the package surface. The camera was mounted on a tripod, allowing precise adjustment of the distance d between the lens and the tested relay. The entire setup was placed inside a plexiglass chamber with dimensions of 40 × 30 × 30 cm. To minimize reflections, the interior of the chamber was lined with polyurethane foam. A schematic diagram of the constructed measurement system is shown in Fig. 1.
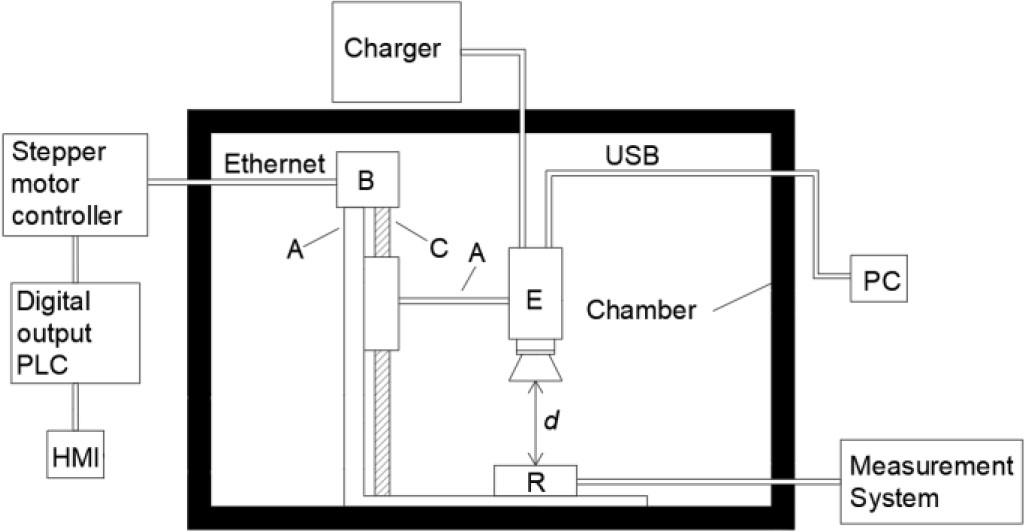
The measurement system that enables thermographic measurement of the temperature of the relay package Tpcam. A – tripod, C – screw, E – thermographic camera, R – observed relay, d – distance between package and thermographic camera lens.
The value of temperature Tc was varied by adjusting the power dissipated on the primary contact of the relay. The relay coil was powered by a 12 V DC power supply. The primary contact circuit was connected to an autotransformer, which allowed precise voltage adjustment and smooth control of the current to the desired level. The diagram of the measurement setup is shown in Fig. 2.
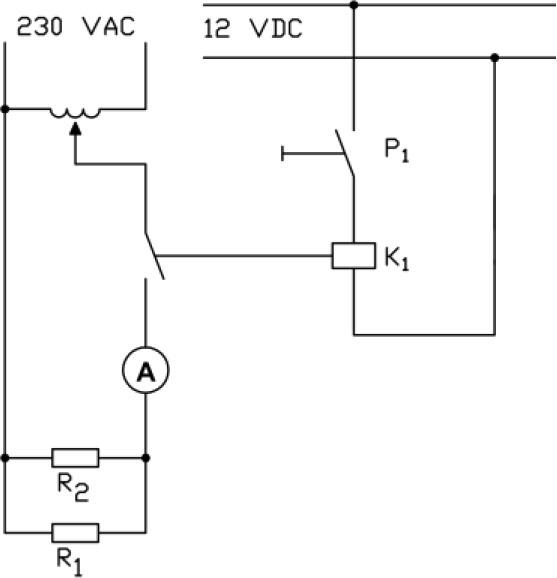
Measuring system that enables relay control. K1 – tested relay, R1, R2 – load, P1 – button.
To examine the extent of heating of the electromechanical relay housing resulting from rapid switching, the relay was again placed in the chamber shown in Fig. 1. A different circuit was used to control the relay operation, designed for automatic, cyclic switching on and off of the relay powered from the 230 V mains. Resistors R1 and R2 were placed in the relay’s supply circuit to limit the current to a value corresponding to the rated current of the tested component. The relay operation was controlled using an Arduino Uno microcontroller (Arduino S.r.l., Monza, Italy), which generated appropriate control signals, enabling precise definition of the switching time and the intervals between subsequent operating cycles.
The switching process was continued until the tested object reached a steady-state temperature. To investigate the influence of switching frequency on the thermal characteristics of the system, measurements were performed for three different pause durations between successive relay activations: 500 ms, 300 ms, and 100 ms. The duration of the relay energized state was typical for this type of relay. The designed setup enabled obtaining repeatable and comparable measurement results while ensuring the safe operation of the actuating components. The described system is shown in Fig. 3.
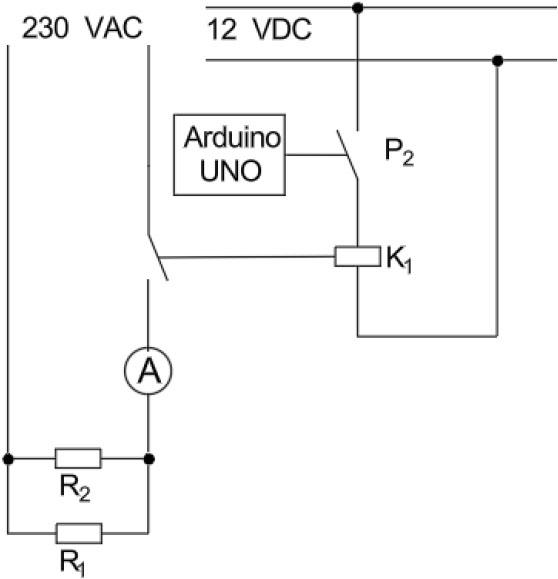
Measuring system used to force a specific number of relay switching cycles. P2 – button controlled by an Arduino Uno microcontroller.
The second stage of the indirect thermographic measurement involved determining the relationship between the contact temperature Tc and the package temperature Tpcam. For this purpose, a three-dimensional relay model was developed and analyzed using the finite element method (FEM). The modeling was performed using SolidWorks software. The created 3D model is presented in Fig. 4, while Table 1 lists the materials used in the model along with their thermal conductivity coefficients λ.
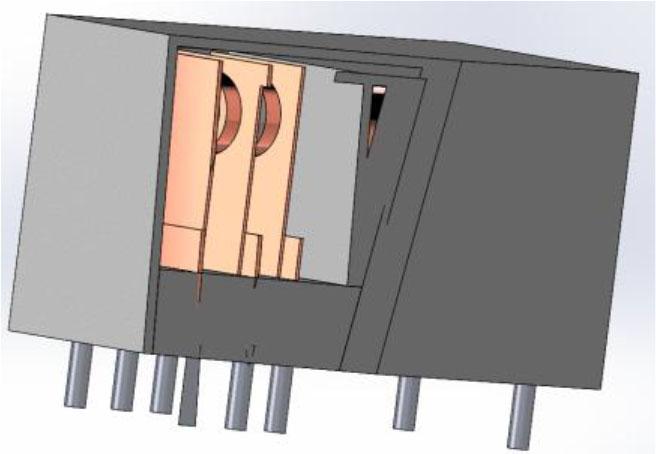
Three-dimensional model of the tested relay.
Summary of the materials assigned to individual components of the relay model and their corresponding thermal conductivity coefficients λ.
| Part of the relay | Material | λ [W/m∙K] |
|---|---|---|
| Coil | Copper | 385 |
| Contact | Copper | 385 |
| Case | Plastics | 0.22 |
| Leads | Aluminum | 204 |
To verify the accuracy of the developed model and the obtained results, a comparison was made with measurements obtained using an alternative method. The contact temperature Tct was measured with a type K thermocouple, while the package temperature Tpt was determined using the same measurement technique.
To develop an accurate model, it was necessary to determine the radiation coefficients hr (1) [19] and the convection coefficients hc (2) [20].
The relationship for the Nusselt number is given in (3) [20].
The coefficients elam, eturb, flam, and fturb depend on the product of the Grashof and Prandtl numbers, as well as on the surface orientation and the nature of the airflow (laminar or turbulent). Their specific values are presented in Table 2 − values of the coefficients elam, eturb, flam, and fturb [21].
The values of coefficients elam, eturb, flam, and fturb.
| Shape | Gr ⋅ Pr | elam | eturb | elam | eturb |
|---|---|---|---|---|---|
| Vertical flat wall | 109 | 0.59 | 0.129 | 0.25 | 0.33 |
| Upper flat wall | 108 | 0.54 | 0.14 | 0.25 | 0.33 |
| Lower flat wall | 105 | 0.25 | NA | 0.25 | NA |
The Prandtl number is calculated according to (4) [22].
The Grashof number is calculated using (5) [20].
Before performing the simulation, the edge length of the finite element was optimized. The chosen value minimized computation time while maintaining stability of the results. The obtained data are summarized in Table 3.
Edge size of the mesh element and the corresponding simulation time and simulation accuracy. The values of ΔTcs represent the largest recorded differences in the determined contact temperatures Tcs among the five simulations.
| No. | Mesh element edge [mm]length | Simulation [s]time | ΔTcs [K] |
|---|---|---|---|
| 1 | 2.0 | 16 | 2.5 |
| 2 | 1.0 | 64 | 0.8 |
| 3 | 0.7 | 175 | 0.2 |
| 4 | 0.5 | 473 | 0.1 |
| 5 | 0.2 | 3 139 | 0.1 |
The obtained model, with the applied mesh and the point at which the package temperature was determined, is shown in Fig. 5.
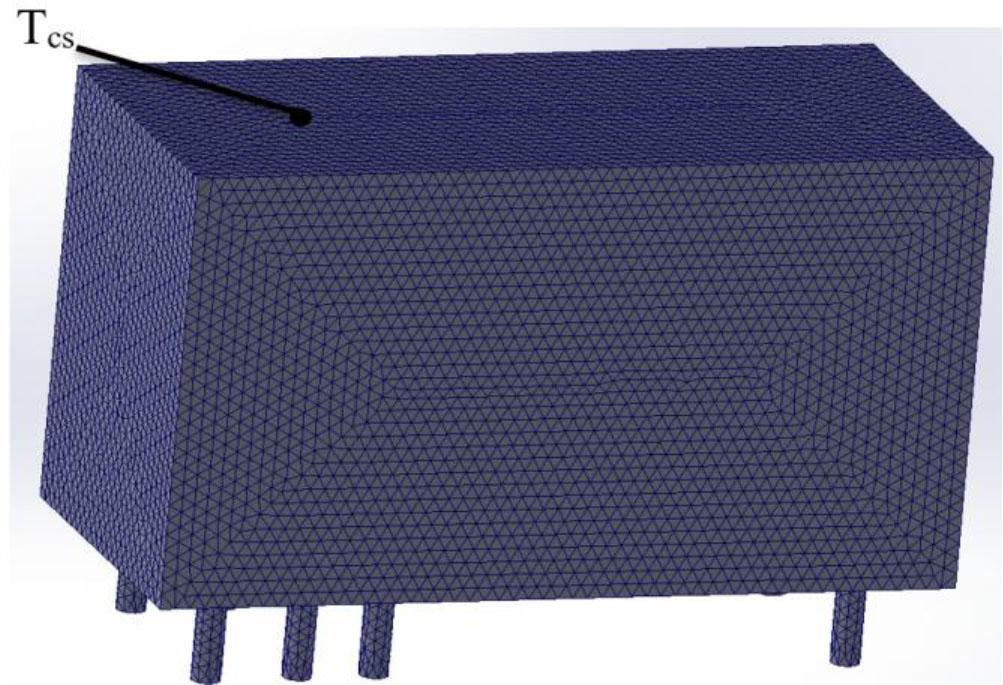
The obtained model with the applied mesh and the point at which the package temperature was determined.
As a result of the carried out work, the obtained results allowed determining the relationship between the temperature Tcs and the temperature Tps. The values of the temperatures Tct and Tpt were also measured (Table 4).
The obtained values of the contact temperature Tcs (from simulation), package temperature Tps (from simulation), and the temperatures Tct (contact temperature measured with the thermocouple) and Tpt (package temperature measured with the thermocouple).
| No. | Tcs [K] | Tct [K] | Tps [K] | Tpt [K] |
|---|---|---|---|---|
| 1 | 293.1 | 293.2 | 292.7 | 293.2 |
| 2 | 294.2 | 294.2 | 293.5 | 293.2 |
| 3 | 297.3 | 297.2 | 294.7 | 294.2 |
| 4 | 302.6 | 301.2 | 298.4 | 297.2 |
| 5 | 306.8 | 305.2 | 300.1 | 299.2 |
| 6 | 312.8 | 312.2 | 302.1 | 301.2 |
| 7 | 321.5 | 320.2 | 307.3 | 305.2 |
| 8 | 333.8 | 332.2 | 315.1 | 314.2 |
| 9 | 341.0 | 339.2 | 322.1 | 320.2 |
After verifying the correctness of the model, an investigation was conducted to determine the extent of relay contact heating resulting from different time intervals between successive switching operations. The values were measured after each of seven cycles. One cycle consisted of 50 relay activations. For each series, different intervals between switching events were applied (500 ms, 300 ms, and 100 ms, respectively). The measured enclosure temperatures and the corresponding relay contact temperatures (obtained from simulation results) are presented in Table 5 – Table 7.
Measurement results for seven successive relay operating cycles with a pause time of 500 ms between ON/OFF switching operations.
| No. | Tpcam [K] | Tpt [K] | Tps [K] | Tcs [K] |
|---|---|---|---|---|
| 1 | 302.1 | 302.15 | 302.5 | 310.9 |
| 2 | 306.3 | 306.15 | 306.6 | 318.3 |
| 3 | 309.0 | 309.15 | 309.1 | 322.7 |
| 4 | 311.2 | 311.15 | 310.8 | 325.8 |
| 5 | 309.6 | 310.15 | 309.4 | 323.3 |
| 6 | 312.4 | 312.15 | 312.7 | 329.2 |
| 7 | 314.0 | 314.15 | 314.1 | 331.7 |
Note:
Tpcam – package temperature measured using a thermal imaging camera,
Tpt – package temperature measured using a thermocouple,
Tps – package temperature determined from simulation results,
Tcs – contact temperature determined from simulation results.
Measurement results for seven successive relay operating cycles with a pause time of 300 ms between ON/OFF switching operations.
| No. | Tpcam [K] | Tpt [K] | Tps [K] | Tcs [K] |
|---|---|---|---|---|
| 1 | 301.7 | 301.15 | 301.5 | 309.1 |
| 2 | 307.5 | 307.15 | 307.3 | 319.5 |
| 3 | 312.9 | 312.15 | 312.6 | 329.0 |
| 4 | 315.8 | 316.15 | 315.4 | 334.0 |
| 5 | 317.9 | 318.15 | 317.3 | 337.4 |
| 6 | 320.1 | 320.15 | 319.6 | 341.5 |
| 7 | 323.9 | 322.15 | 323.5 | 348.5 |
Note:
Tpcam – package temperature measured using a thermal imaging camera,
Tpt – package temperature measured using a thermocouple,
Tps – package temperature determined from simulation results,
Tcs – contact temperature determined from simulation results.
Measurement results for seven successive relay operating cycles with a pause time of 100 ms between ON/OFF switching operations.
| No. | Tpcam [K] | Tpt [K] | Tps [K] | Tcs [K] |
|---|---|---|---|---|
| 1 | 311.3 | 311.15 | 311.1 | 326.3 |
| 2 | 313.8 | 313.15 | 313.5 | 330.6 |
| 3 | 317.8 | 317.15 | 317.6 | 337.9 |
| 4 | 319.6 | 319.15 | 319.4 | 341.1 |
| 5 | 322.0 | 322.15 | 321.8 | 345.4 |
| 6 | 322.8 | 323.15 | 322.7 | 347.0 |
| 7 | 325.4 | 324.15 | 325.2 | 351.5 |
Note:
Tpcam – package temperature measured using a thermal imaging camera,
Tpt – package temperature measured using a thermocouple,
Tps – package temperature determined from simulation results,
Tcs – contact temperature determined from simulation results.
In the conducted research work, an indirect thermographic measurement of the contact temperature of an electromechanical relay Tc was performed. The relationship between the Tc value and the temperature of the relay package Tpcam was determined. The Tcs and Tps value was determined based on the FEM method. The results obtained using FEM were compared with the results obtained using the contact method (Tpt, Tct). It was noted that the smallest difference between the values of Tcs and Tct was 0.1 K, and Tps and Tpt was 0.3 K. For this reason, the defined model can be considered reliable. The largest value between Tcs and Tps was 18.9 K.
Additionally, thermal tests revealed that increasing the switching frequency results in a significant rise in both the case and contact temperatures. For the shortest pause time between switching cycles (100 ms), the maximum simulated contact temperature reached 351.5 K, which is approximately 21 K higher than the corresponding package temperature and considerably higher than in the 500 ms and 300 ms test conditions. This demonstrates that rapid cyclic switching intensifies thermal stress within the relay structure, potentially accelerating contact degradation.
The results confirm that indirect thermographic measurement combined with FEM analysis can be successfully applied for relay diagnostics without interfering with the relay structure or its operating conditions. The developed methodology enables monitoring of thermal behavior during switching processes and may serve as a valuable tool for assessing relay health, detecting abnormal heating, and optimizing operating conditions to increase device lifetime.