
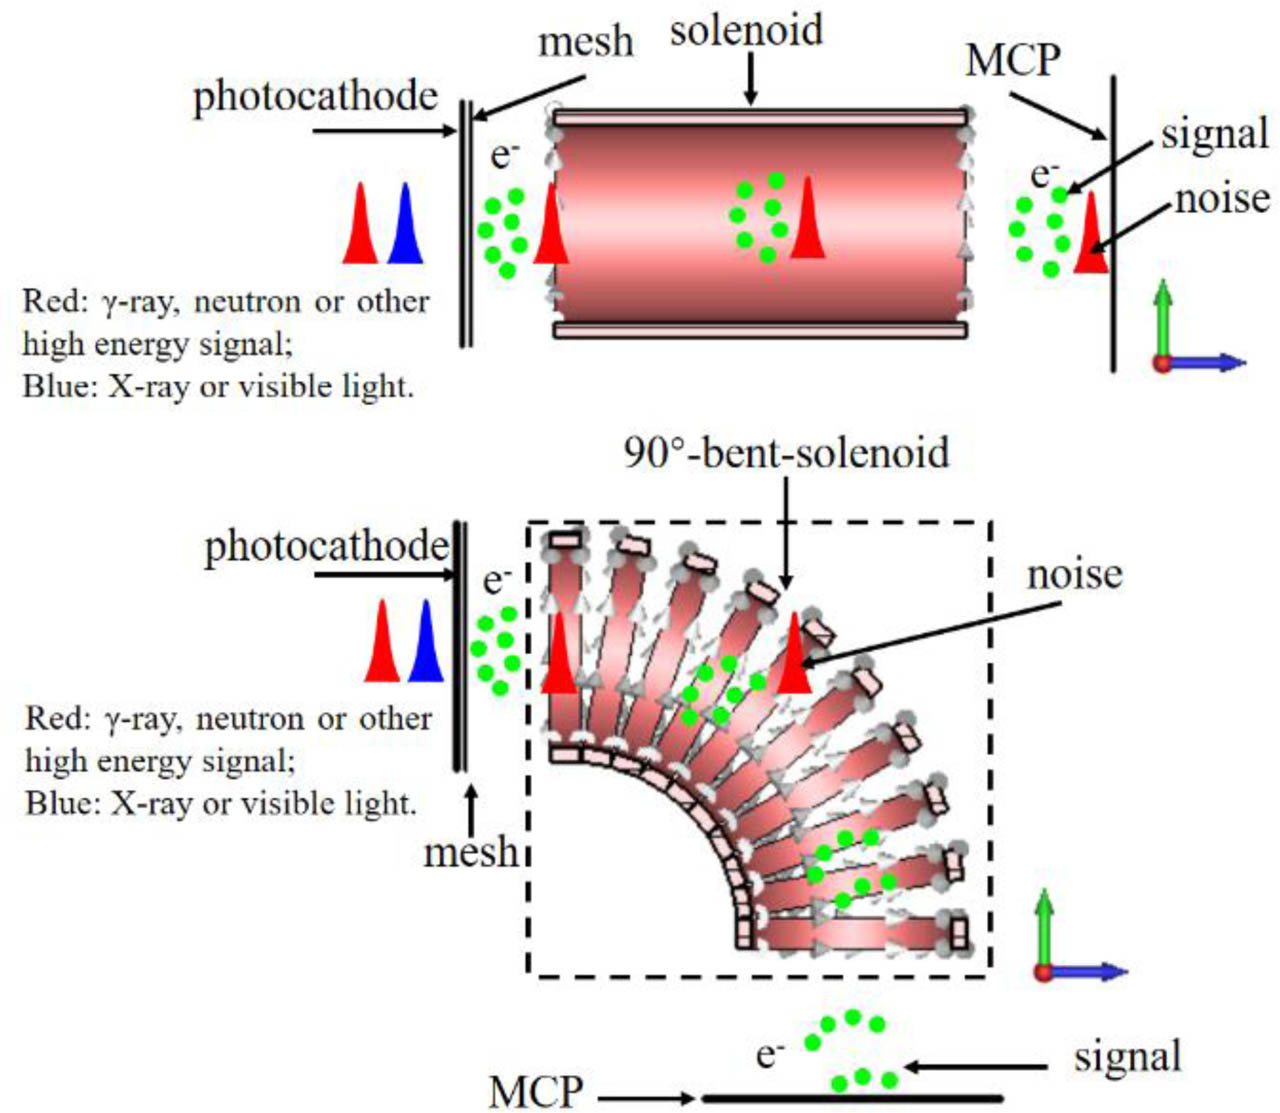
Fig. 1.
Schematic diagram of the traditional (upper) and novel (lower) X-ray detector.
Table 1.
Voltage and current parameter distribution.
| Components | Voltage [V] | Number of single turns | Current of turns [A] | ||
|---|---|---|---|---|---|
| Photocathode | Mesh | MCP | |||
| Parameters | −1200 | −300 | 0 | 40 | 200 |
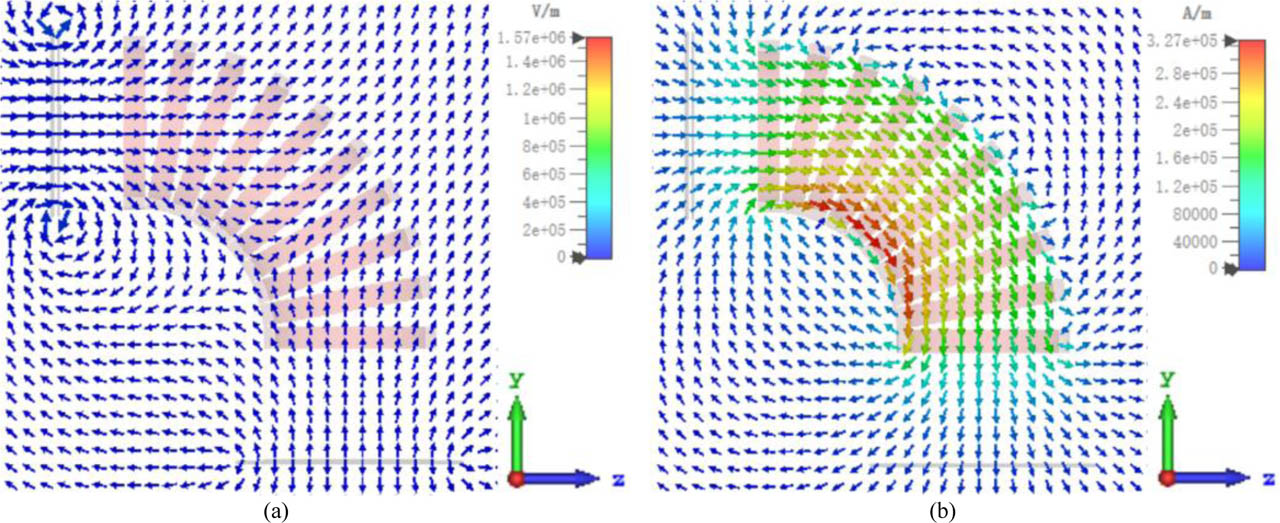
Fig. 2.
Electromagnetic field distribution. (a) Electric field distribution; (b) Magnetic field distribution.
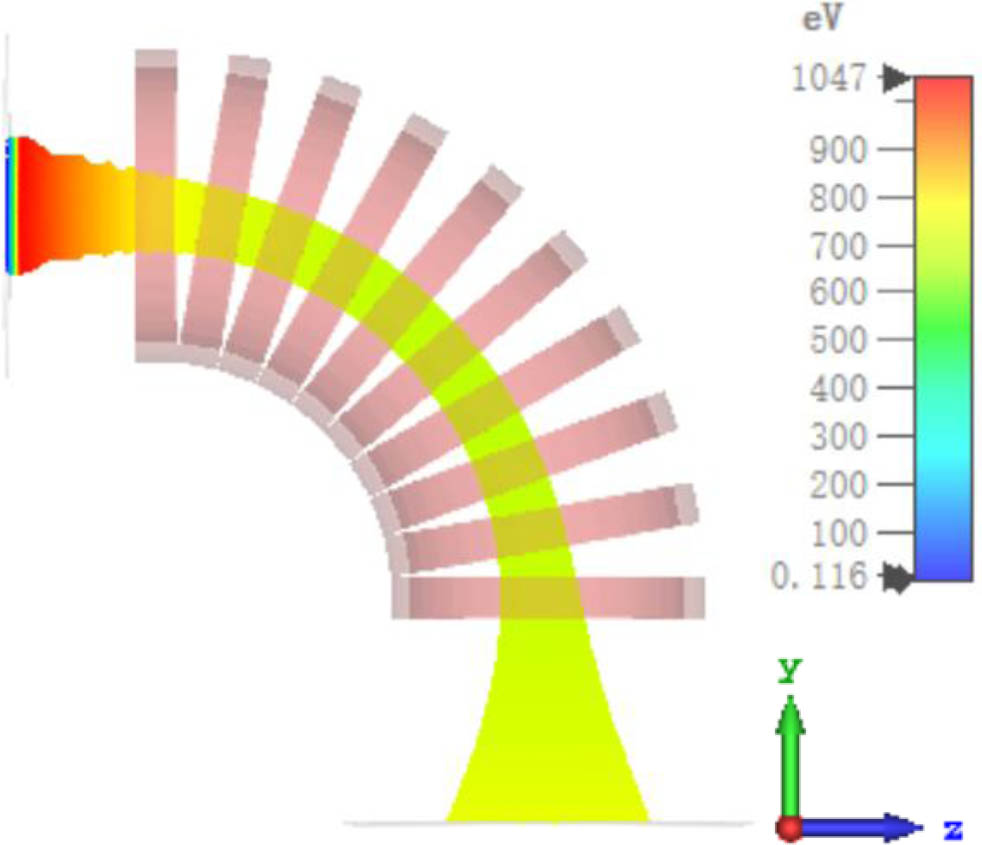
Fig. 3.
Photoelectron trajectories from the whole photocathode.
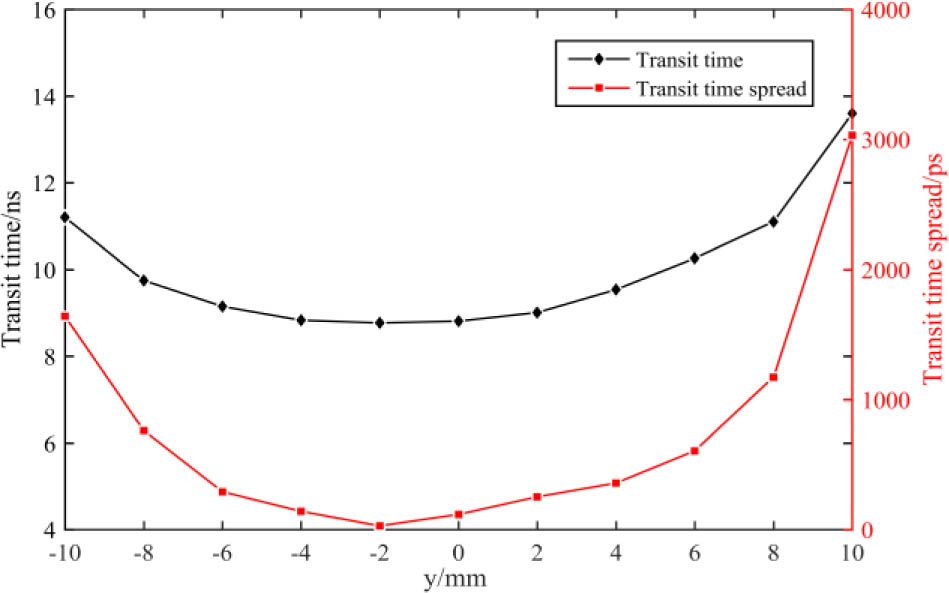
Fig. 4.
Transit time and transit time spread versus the photocathode positions (slit direction).
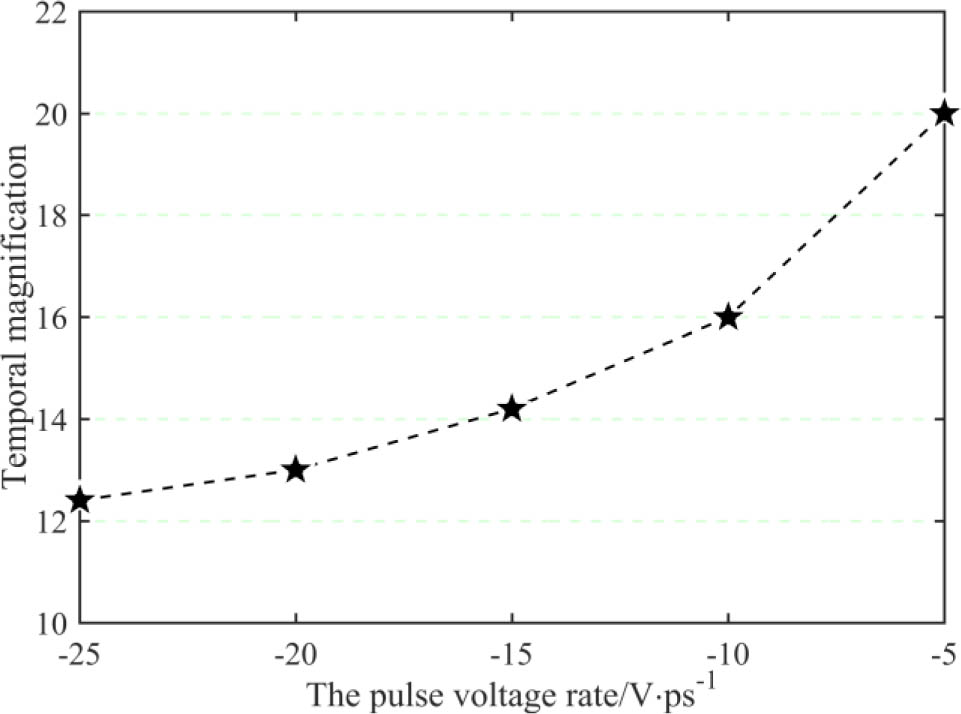
Fig. 5.
Temporal magnification versus the ramped pulsed ramp rate.
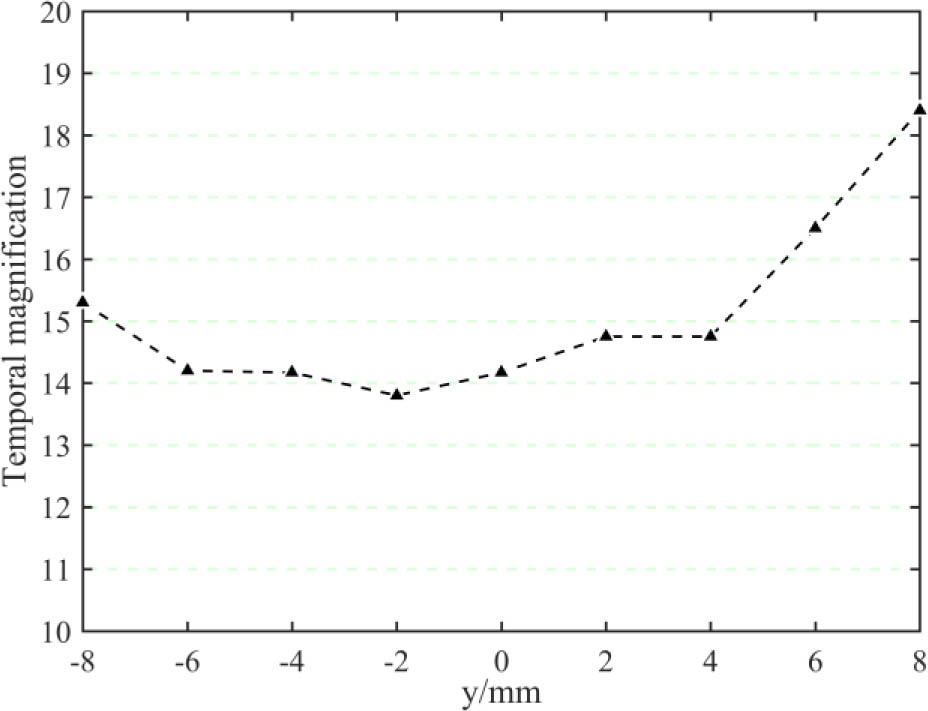
Fig. 6.
Temporal magnification versus the photocathode illuminated position.
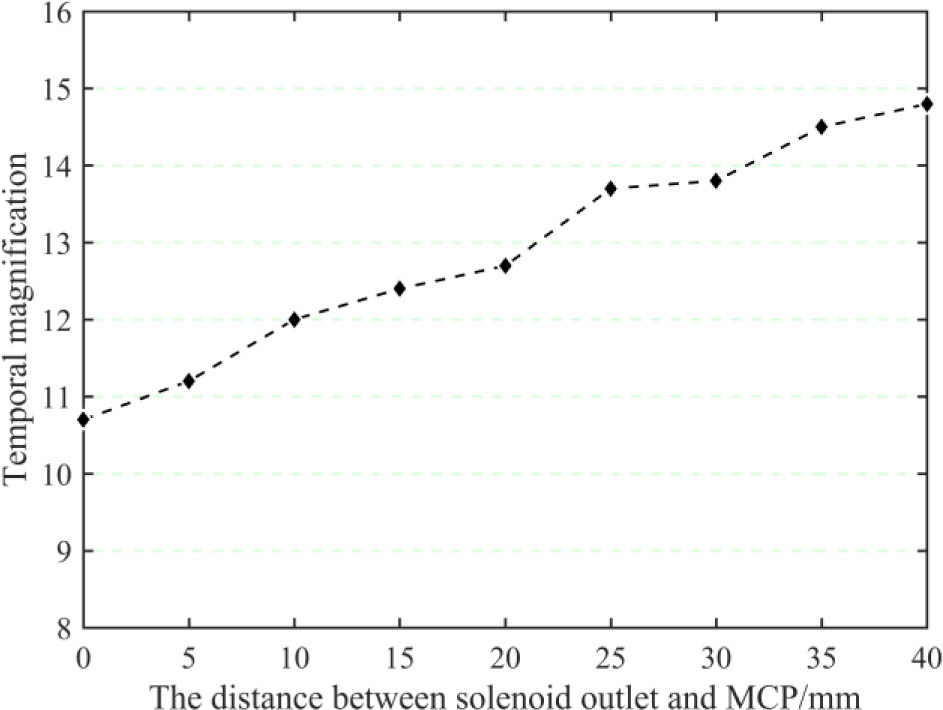
Fig. 7.
Temporal magnification versus the distance between the solenoid outlet and the MCP.
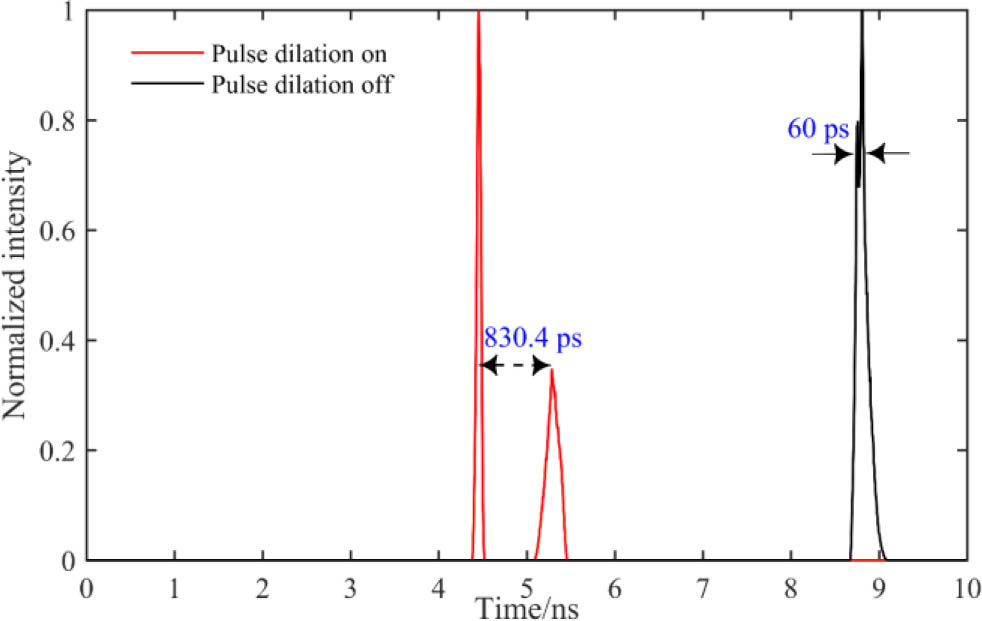
Fig. 8.
Comparison of dilated vs non-dilated signal for input double peaks separated by 60 ps.
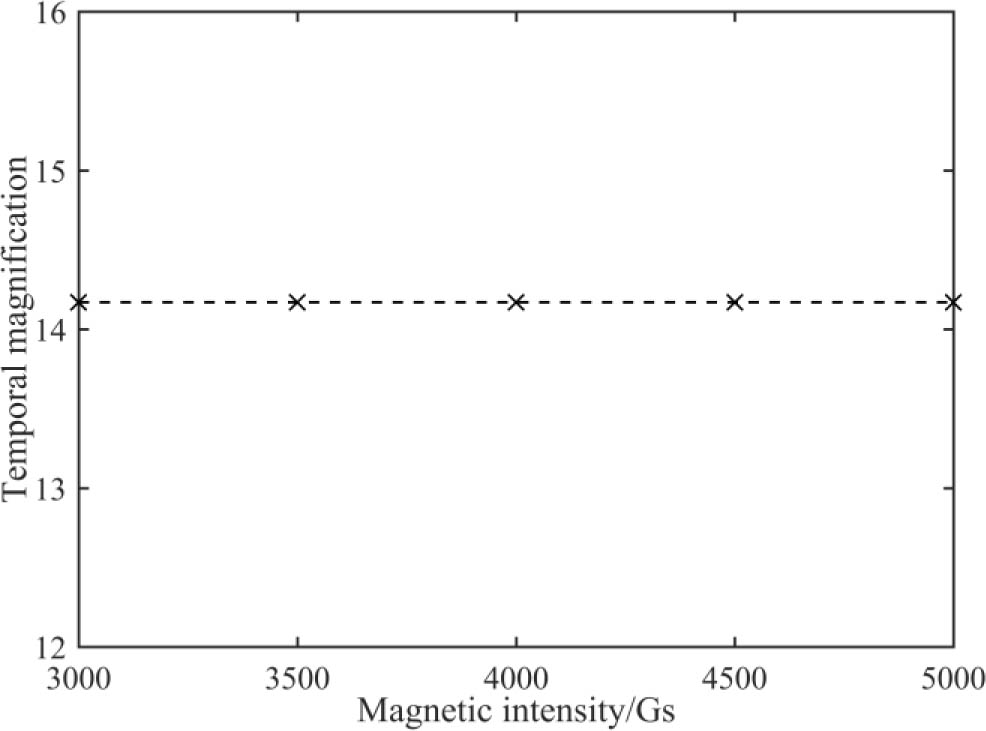
Fig. 9.
Magnification versus the magnetic intensity.
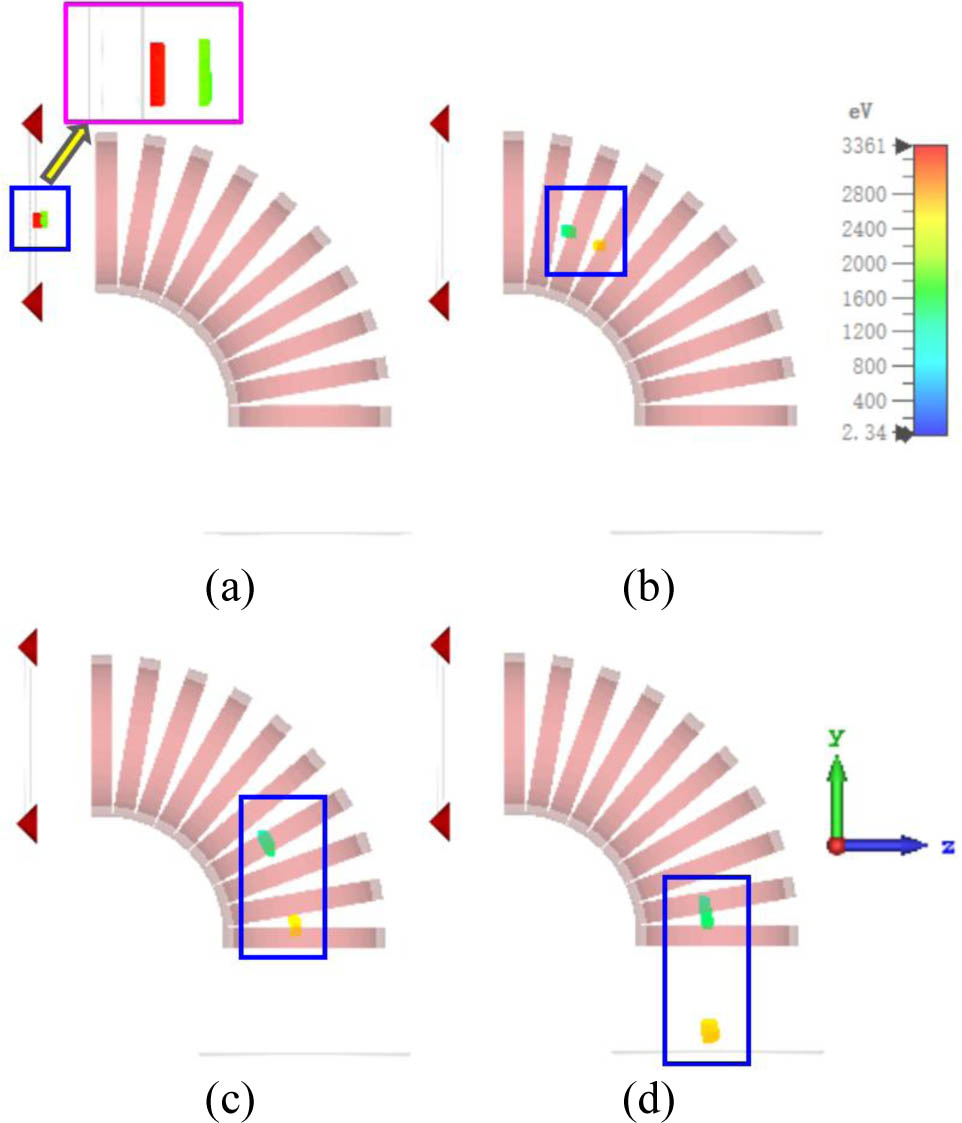
Fig. 10.
Demonstration of electric trajectory: (a) t = 230 ps; (b) t = 1640 ps; (c) t = 3740 ps; (d) t = 4520 ps.
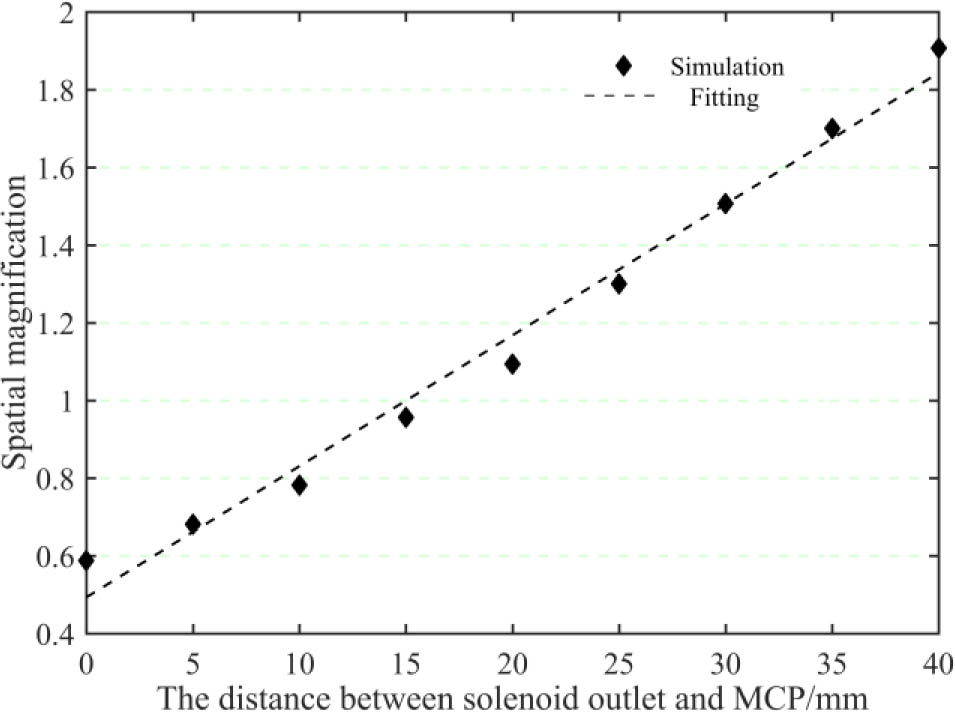
Fig. 11.
Spatial magnification versus the distance between the solenoid outlet and the MCP.