
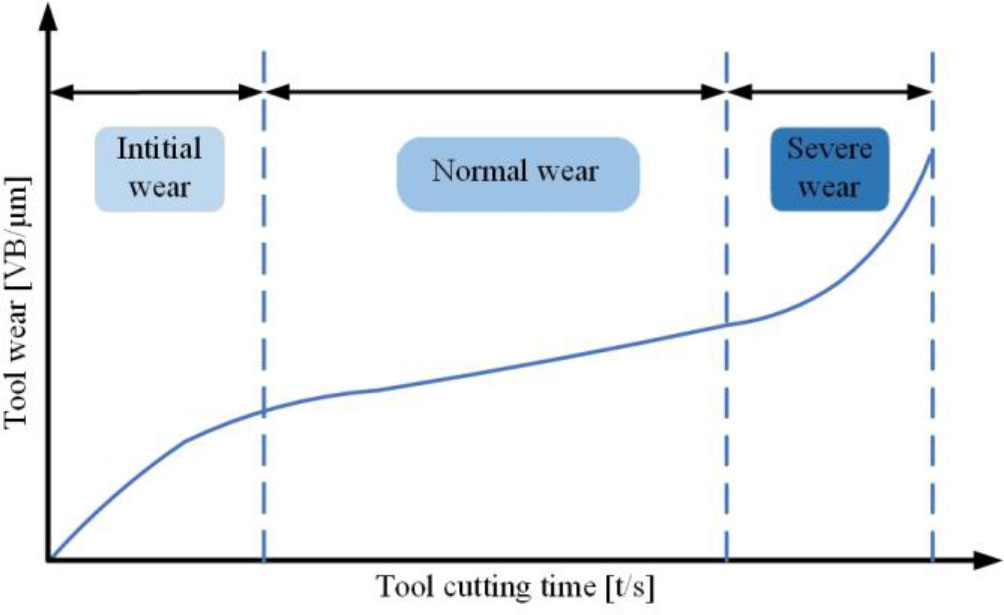
Fig. 1.
Tool wear curve.
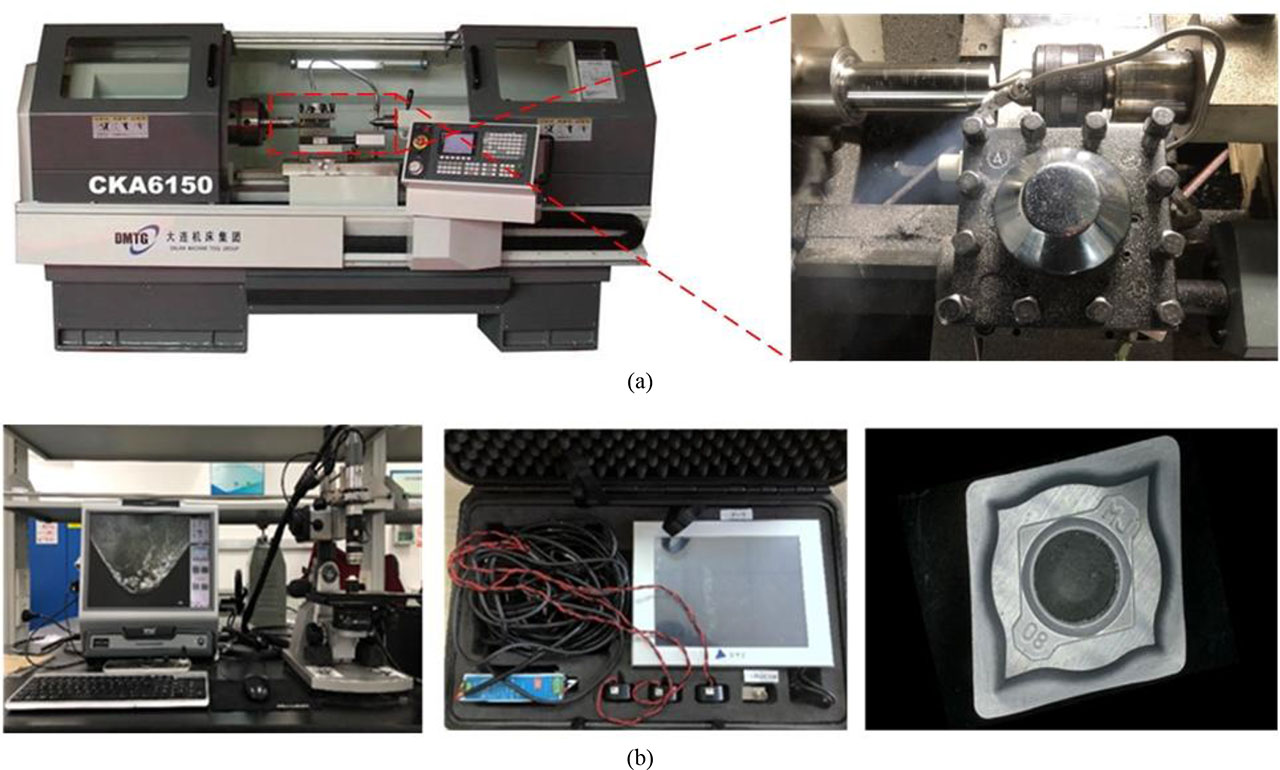
Fig. 2.
Experimental and signal acquisition equipment. (a) Experimental machine tool and cutting test site; (b) Super depth-of-field microscope, vibration signal acquisition equipment, and test tool.
Table 1.
Tool wear status classification.
| Tool wear [mm] | Tool wear status | Time [min] |
|---|---|---|
| [0, 0.0675) | Initial wear | [0, 9) |
| [0.0675, 0.245) | Normal wear | [9, 23.5) |
| [0.245, +∞) | Severe wear | [23.5, 29] |
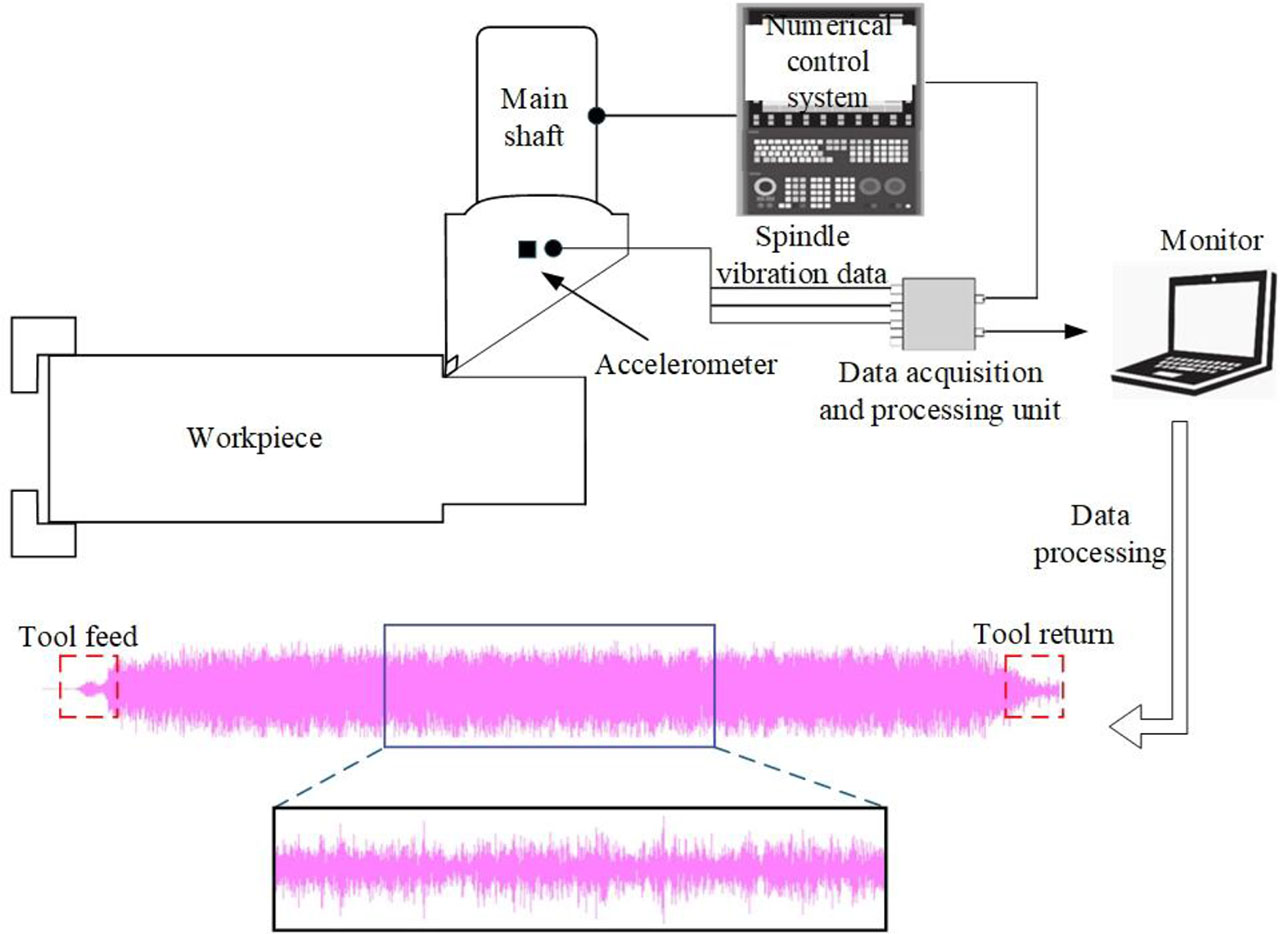
Fig. 3.
Data collection and preprocessing.
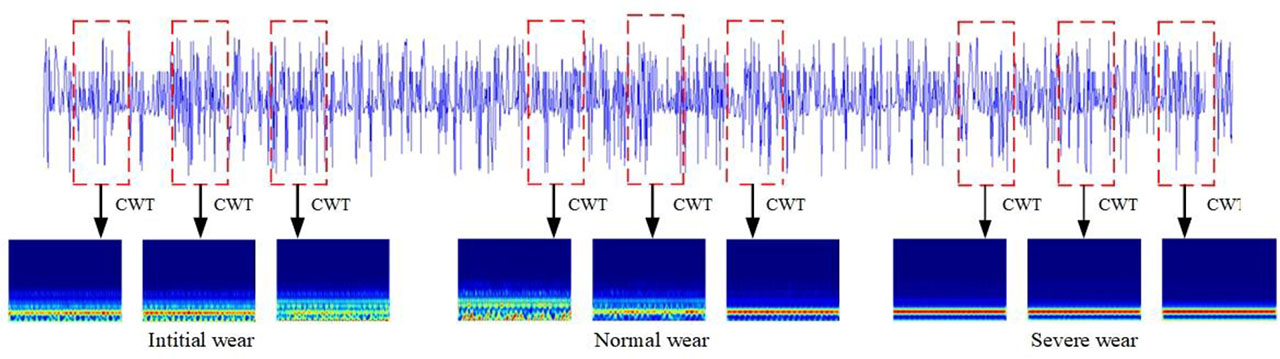
Fig. 4.
The vibration signals and their CWT at different stages of tool wear.

Fig. 5.
Basic block in ResNet network.
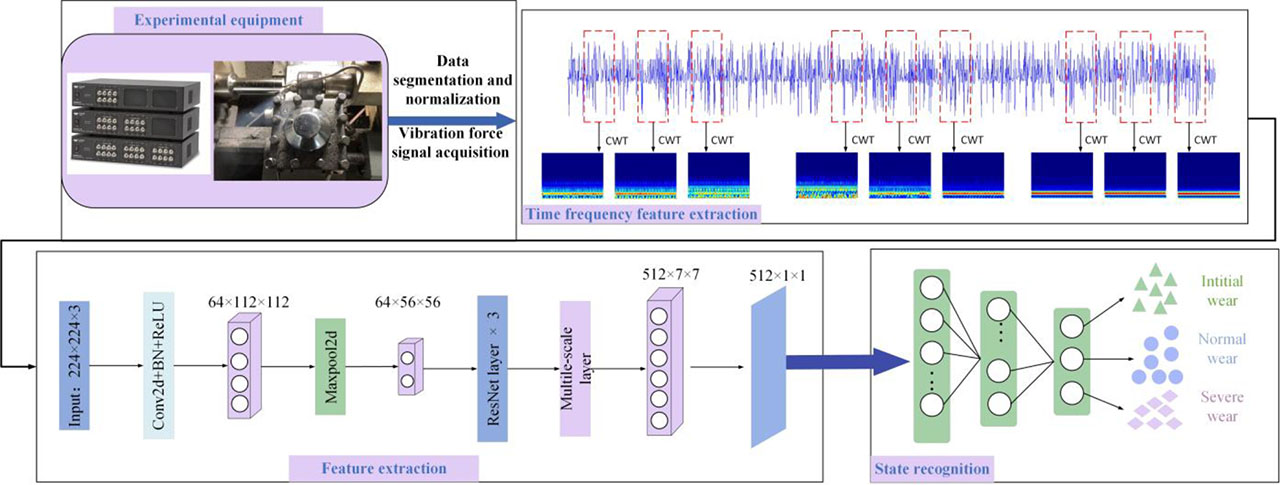
Fig. 6.
Overall framework of the proposed methodology.
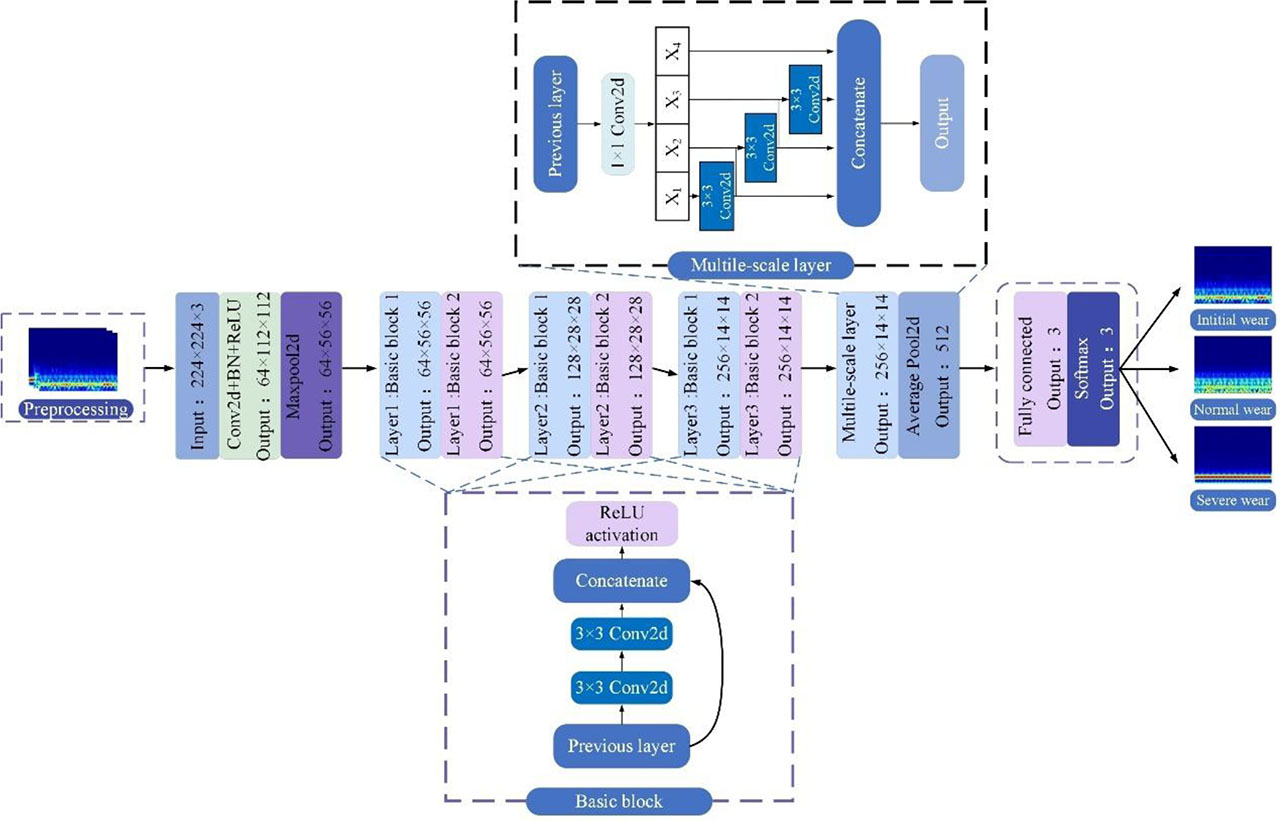
Fig. 7.
Overview of a Multi-scale ResNet-based model for tool wear condition recognition.
Table 2.
Comparison of experimental results with other models.
| Models | Accuracy [%] | Recall [%] | Precision [%] | F1 score [%] | |
|---|---|---|---|---|---|
| CNN–SVM[5] | Initial wear | -- | 90.9 | 83.3 | 87.0 |
| Normal wear | -- | 86.8 | 93.9 | 90.2 | |
| Severe wear | -- | 100.0 | 95.5 | 97.7 | |
| Average | 90.6 | 92.6 | 90.9 | 91.6 | |
| Transformer[6] | Initial wear | -- | 78.8 | 76.4 | 77.6 |
| Normal wear | -- | 84.9 | 86.5 | 85.7 | |
| Severe wear | -- | 100.0 | 100.0 | 100.0 | |
| Average | 86.0 | 87.9 | 87.7 | 87.8 | |
| ResNet | Initial wear | -- | 78.8 | 83.8 | 81.3 |
| Normal wear | -- | 90.6 | 87.3 | 88.9 | |
| Severe wear | -- | 100.0 | 100.0 | 100.0 | |
| Average | 88.8 | 89.8 | 90.4 | 90.0 | |
| Multi-scale ResNet | Initial wear | -- | 90.0 | 87.1 | 88.5 |
| Normal wear | -- | 92.4 | 94.2 | 93.3 | |
| Severe wear | -- | 100.0 | 100.0 | 100.0 | |
| Average | 93.3 | 94.2 | 93.8 | 94.0 |
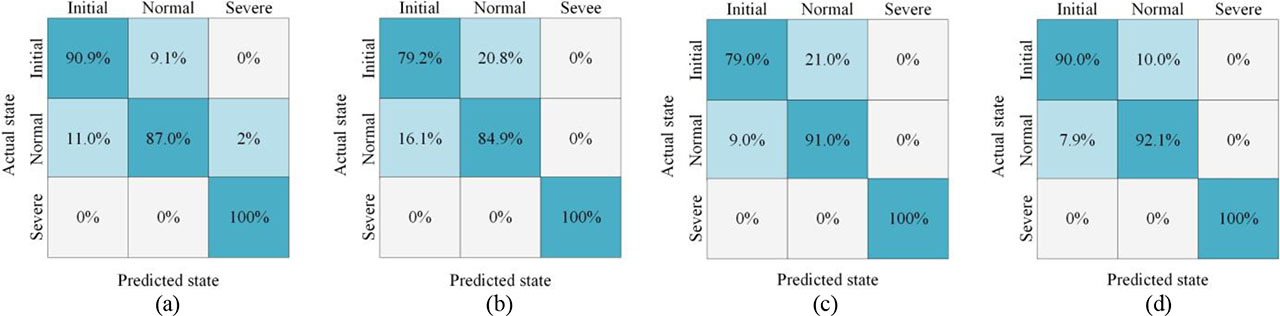
Fig. 8.
Confusion matrix (a) CNN–SVM; (b) Transformer; (c) ResNet; (d) Multi-scale ResNet.
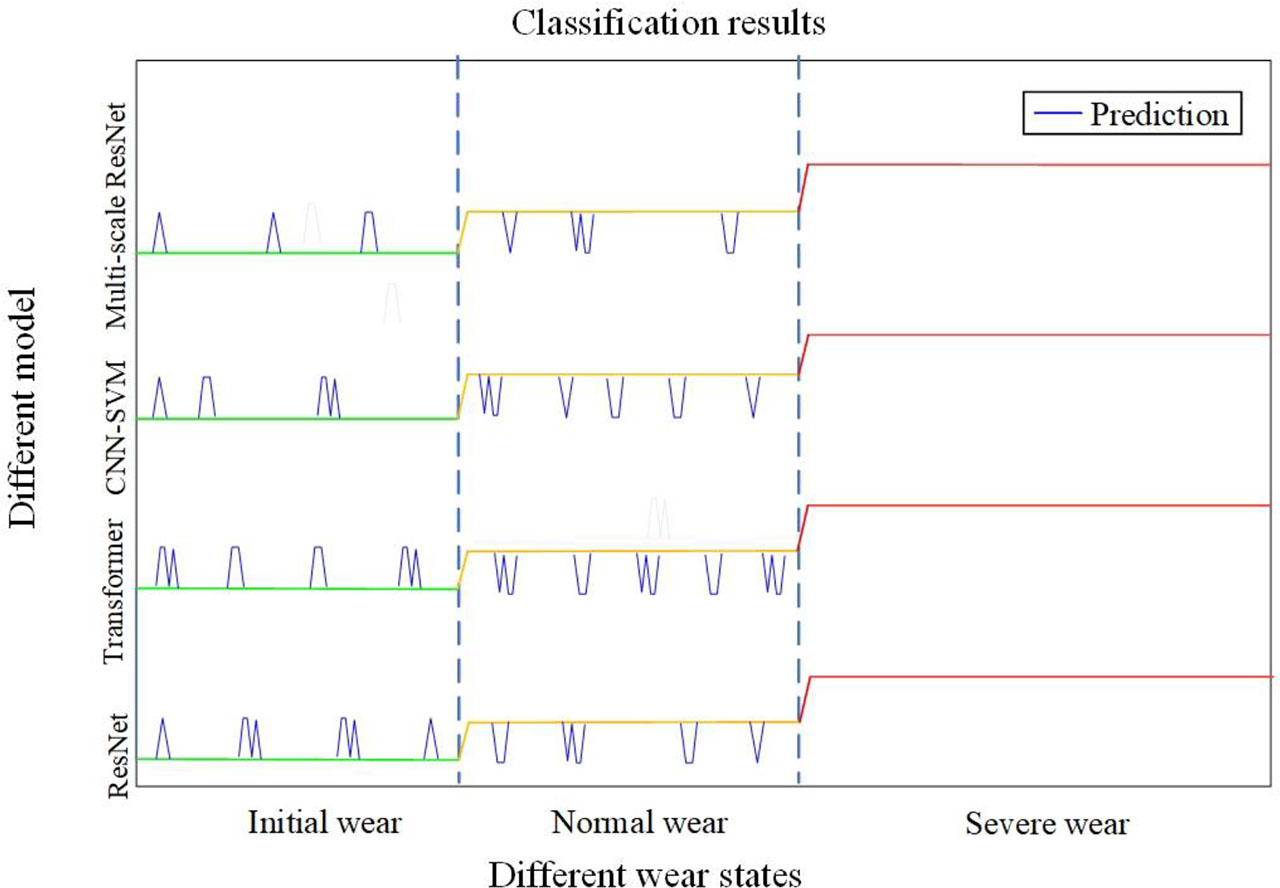
Fig. 9.
Recognition results of the four models.