Have a personal or library account? Click to login
Gradient Pre-Emphasis Calibration Cover
Open Access
|Oct 2025

Figures & Tables

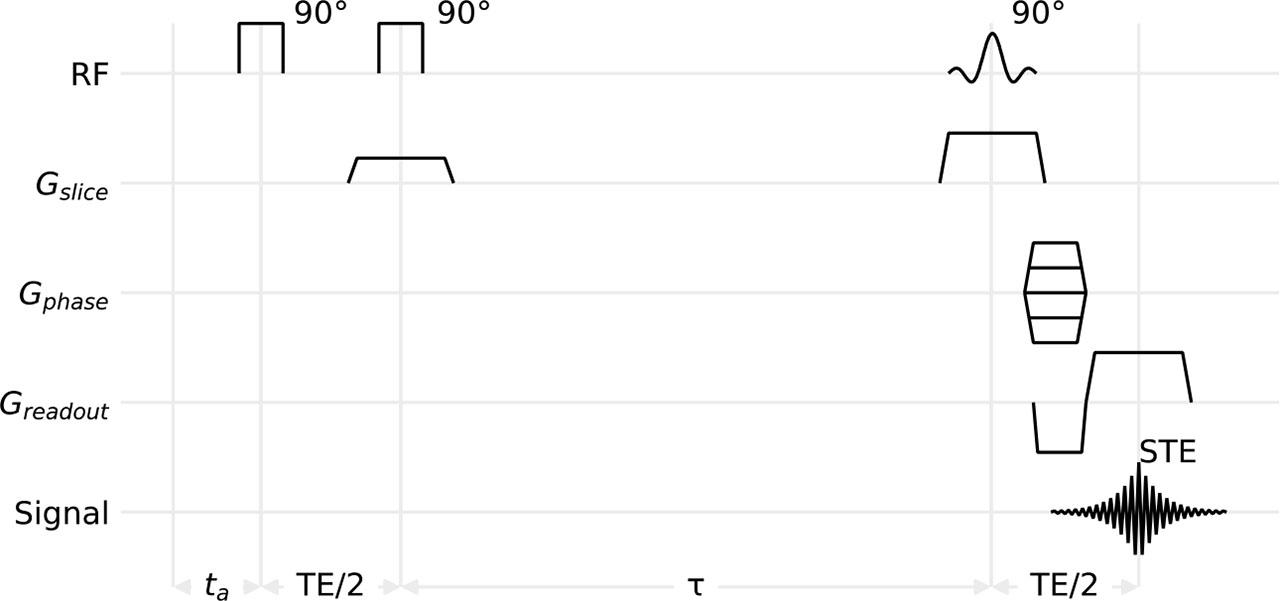
Fig. 1.

Schematic drawing of the imaging sequence for mapping time-dependent magnetic field changes induced by an arbitrary sequence of gradient pulses. Greadout – reading gradient, Gphase – phase encoding gradient, Gslice – slice selective gradient, RF – radiofrequency pulses, Signal – acquisition, τ – time interval used to minimize residual effects of eddy currents induced by the gradient during the second excitation pulse.

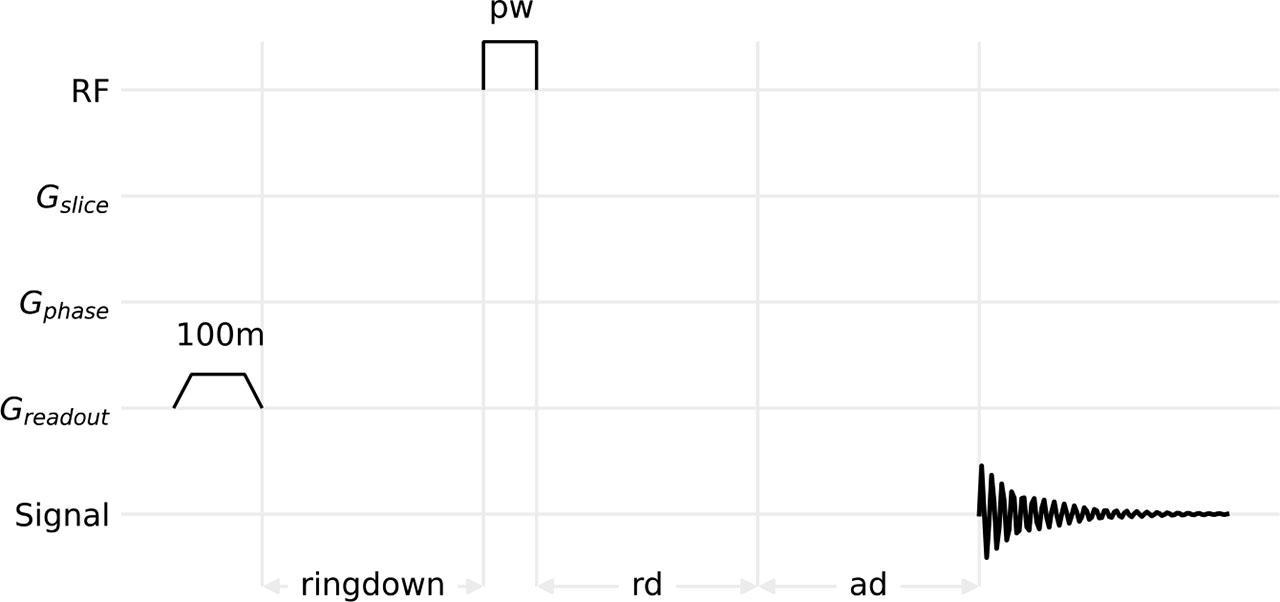
Fig. 2.

Ring-down sequence. rd – is the time interval for unblanking the receiver, and ad – is the interval from receiver unblanking to signal acquisition. In our case, both were set to 1 μs.

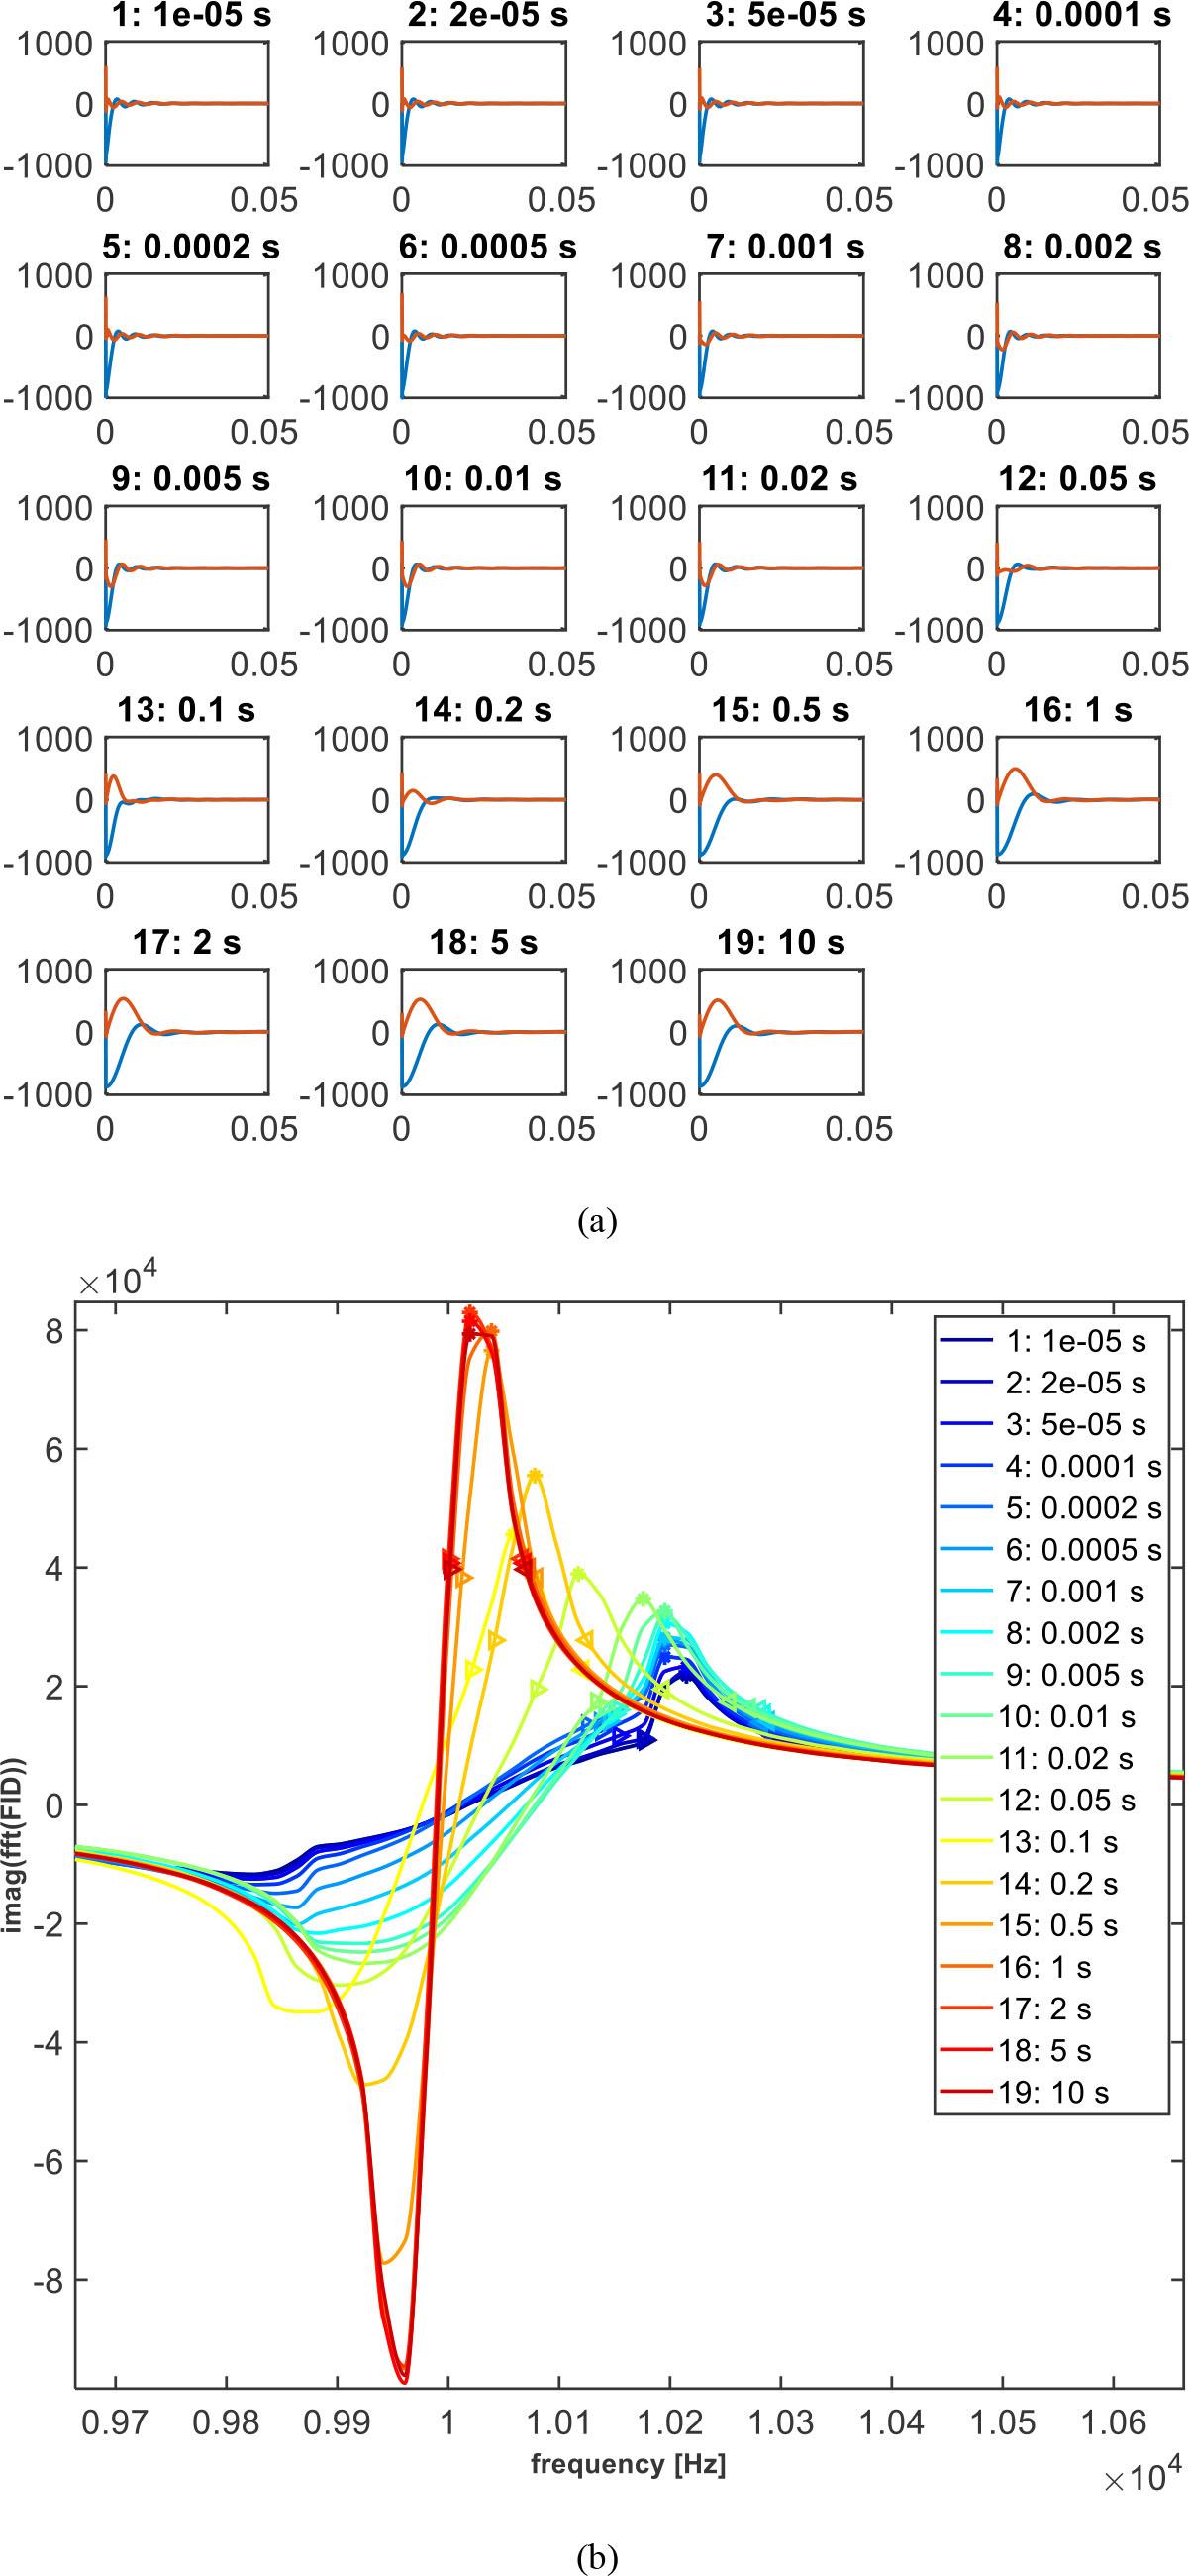
Fig. 3.

Gradient ring-down experiment for gradient in the x-direction. (a) Measured FID signal for different delays dj (shown in the title of each subplot) sorted in ascending order: (blue) real part and (red) imaginary part. The signal is shown in arbitrary units. (b) Imaginary value of the FFT of the measured FID signal for each delay dj (shown in the legend) sorted in ascending order: the maximal peak (marked with “*”), along with its half-height boundaries (marked with “<” and “>”) that define the peak width wj for each delay, is shown.

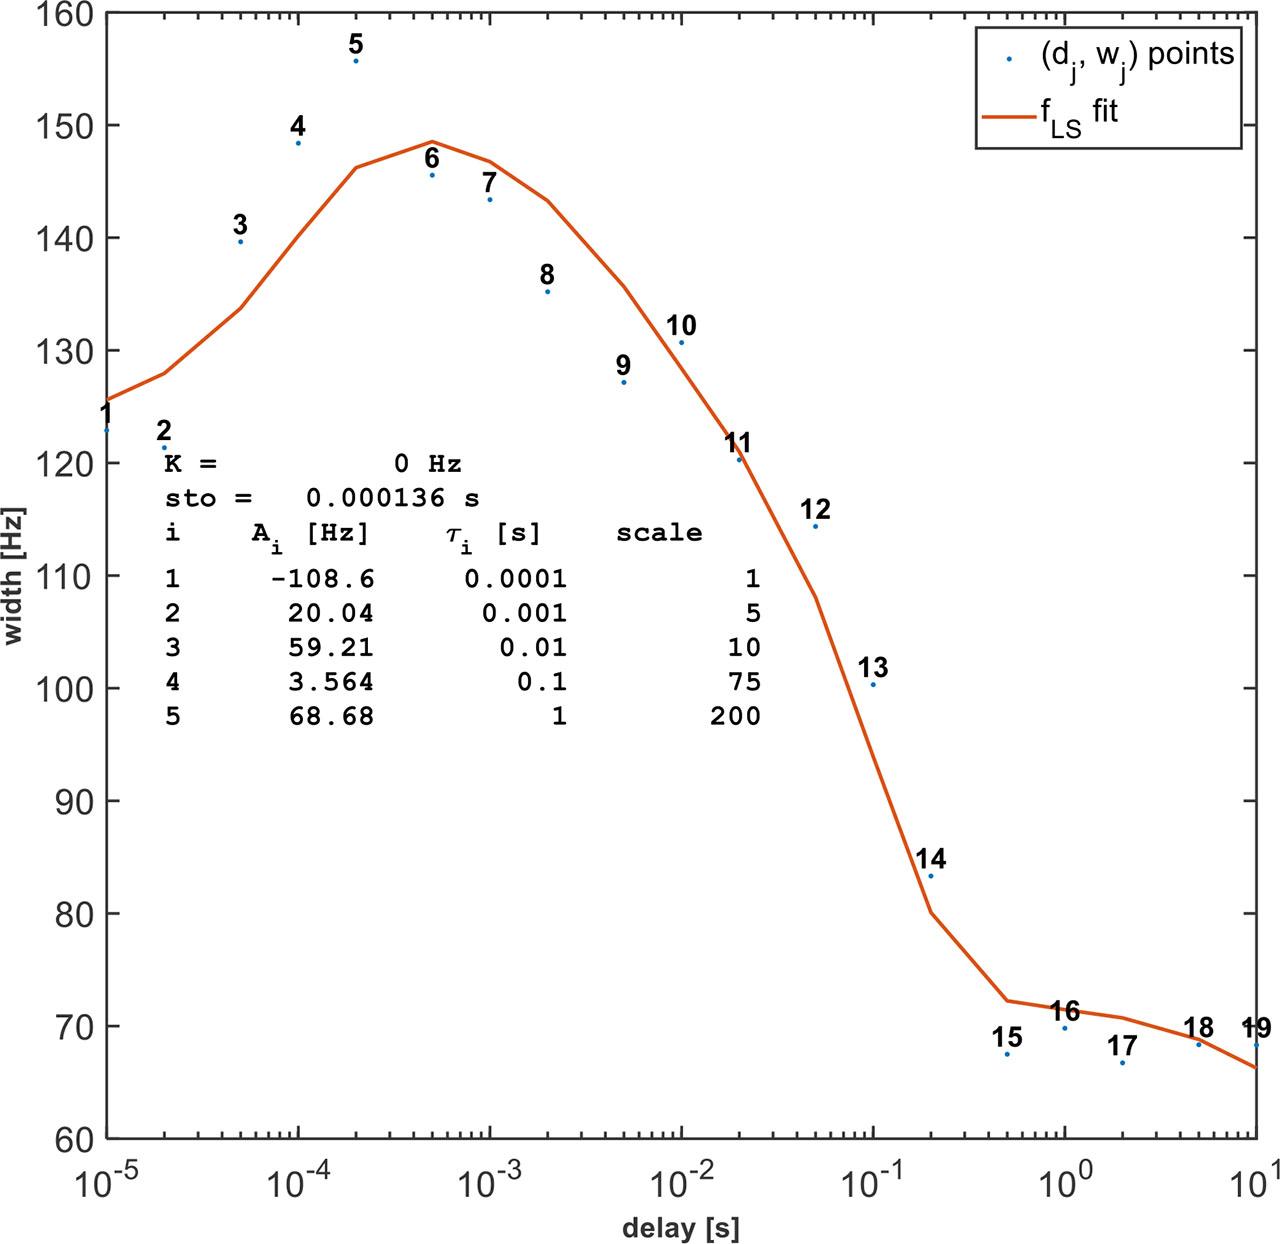
Fig. 4.

Peak width vs. delay dependence is shown as (dj,wj) points for j = 1, … , m (m = 19), fitted with function (5) using n = 5 and the least-squares method. The (dj,wj) points are obtained from the data in Fig. 3.

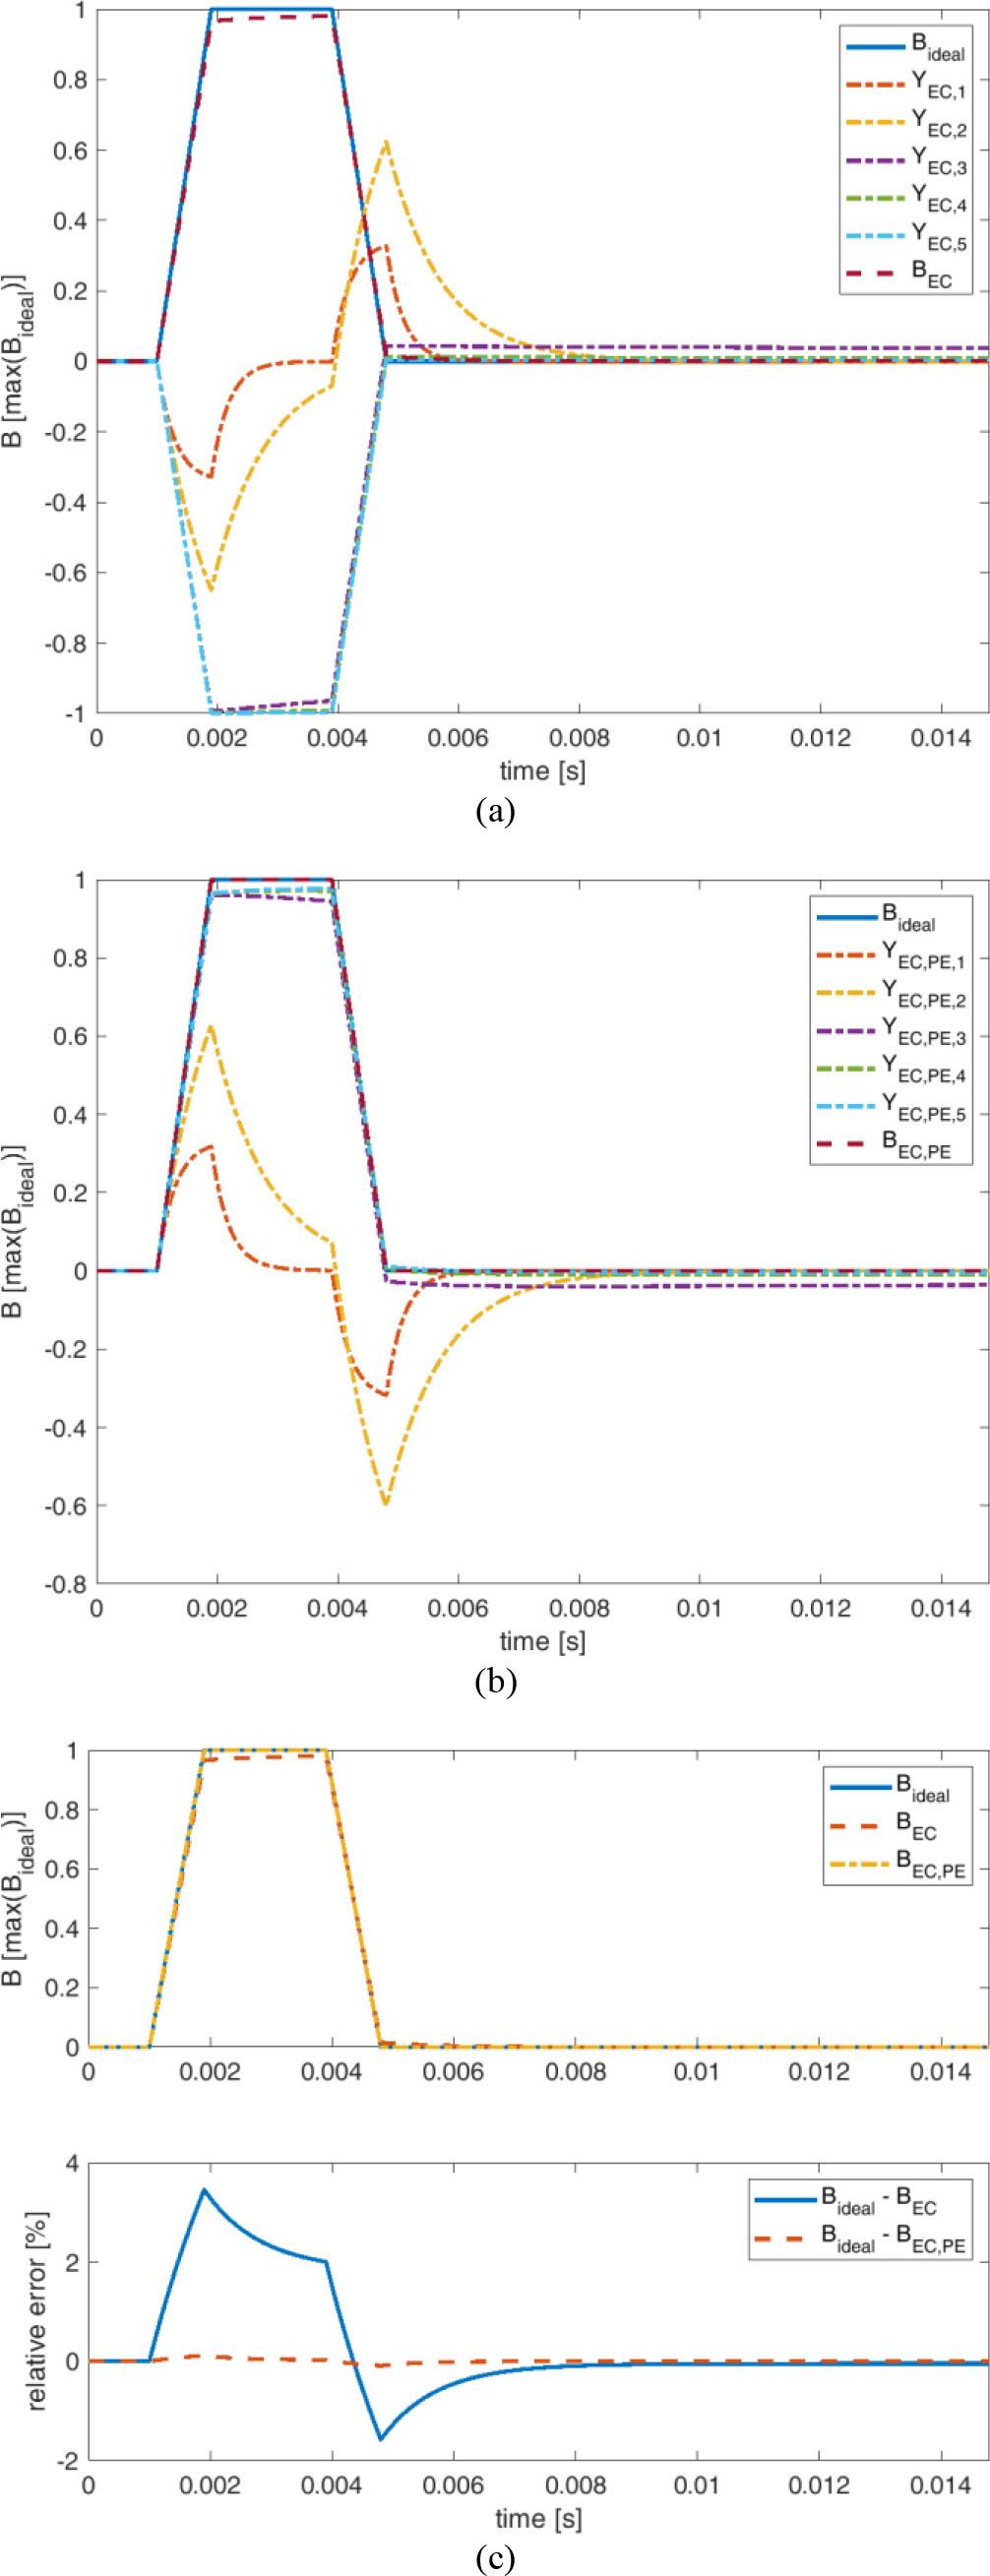
Fig. 5.

Simplified model of eddy current effects and gradient pre-emphasis compensation: (a) Eddy current model, where 


YEC,i≡−exp−tτi*ΔBidealt
{Y_{EC,i}} \equiv - \exp \left( { - {t \over {{\tau _i}}}} \right)*\Delta {B_{ideal}}\left( t \right) 


. (b) Gradient pre-emphasis compensation of the eddy current model, where 


YEC,PE,i≡exp−tτi*ΔBECt
{Y_{EC,PE,i}} \equiv \exp \left( { - {t \over {{\tau _i}}}} \right)*\Delta {B_{EC}}\left( t \right) 


. (c) Comparison of the (a) and (b) models with the magnetic flux density field over time for an ideally switching gradient, and their relative errors. Parameters used in the simulations are shown in Table 1.
Simplified model of eddy current effects and gradient pre-emphasis compensation: (a) Eddy current model, where YEC,i≡−exp−tτi*ΔBidealt {Y_{EC,i}} \equiv - \exp \left( { - {t \over {{\tau _i}}}} \right)*\Delta {B_{ideal}}\left( t \right) . (b) Gradient pre-emphasis compensation of the eddy current model, where YEC,PE,i≡exp−tτi*ΔBECt {Y_{EC,PE,i}} \equiv \exp \left( { - {t \over {{\tau _i}}}} \right)*\Delta {B_{EC}}\left( t \right) . (c) Comparison of the (a) and (b) models with the magnetic flux density field over time for an ideally switching gradient, and their relative errors. Parameters used in the simulations are shown in Table 1.

Fig. 6.

Measured eddy current effect gradient pre-emphasis compensation in the gradient ring-down experiment: the ° indicates uncompensated data, (blue) fitting function, and the * indicates gradient pre-emphasis compensated data with fitting function (yellow).

The correction values for APOLO console_

DescriptionGrxGryGrz
A0 50 50 50
A1 67.055 −2.9362 19.36
A2  4.2602  0.54167  2.6
A3  0.48708  1.6002  1.6099
A4 −0.60883  0.096324 −0.27792
A5  2.2315  1.8562  2.2057
T1 [μs]100100100
T2 [ms]  1  1  1
T3 [ms] 10 10 10
T4 [ms]100100100
T5 [s]  1  1  1

Values of parameters for simulations and experiments_

DescriptionSymbolValueUnit
Common parameters:
Time step sizet  50μs
Gradient ramp timetramp 900μs
Gradient plateau timetplato   2ms
Gradient strength in GRD experimentGrGRD  20%
Gradient strength in GS experimentGrGS   2%
Peak width in GS experimentwGS1191.1Hz
Number of EC sourcesn   51
Simplified model of ECs effects gradient PE compensation:
Gradient max magnetic flux densitymax (Bideal)   1T
Language: English
Page range: 300 - 308
Submitted on: Mar 14, 2025
Accepted on: Sep 16, 2025
Published on: Oct 28, 2025
Published by: Slovak Academy of Sciences, Institute of Measurement Science
In partnership with: Paradigm Publishing Services
Publication frequency: Volume open

© 2025 Daniel Gogola, Andrej Krafčík, Pavol Szomolányi, published by Slovak Academy of Sciences, Institute of Measurement Science
This work is licensed under the Creative Commons Attribution-NonCommercial-NoDerivatives 4.0 License.