As a result of the operation of the gradient coils, which are necessary for encoding the spatial information of the image, eddy currents (EC) are induced in the surrounding conductive parts of the scanner. The magnitude of the induced eddy currents increases as the ratio of gradient-coil to scanner-bore diameters decreases. Unshielded gradients, depending on the coil/bore diameter ratio, can induce magnetic fields with magnitudes reaching up to approximately 60 % of the nominal gradient field strength for a ratio of 0.9 of gradient-coil to scanner-bore diameter ratio, as reported in [1]. These magnetic fields, induced in the surrounding conductive parts of the scanner, consequently cause shape distortion of the gradient pulses and their deviation from the expected shape [1], [2]. This shape deviation as well as the temporal instability of the gradient fields results in artifacts during NMR imaging [3]. Among the undesired effects caused by eddy currents, artifacts such as misregistration, phase distortions, and variations in image sharpness due to resolution degradation can be observed [4], [5]. The association of eddy currents with these artifacts is discussed in more detail in [1], [2].
Several methods exist to suppress the influence of eddy currents on the magnetic field generated by the gradient coils.
For example, a temporal compensation technique can be applied in which the system’s response to the generated gradient pulse is known. The time domain of the generated gradient pulse is then modeled using an analytical formula to compensate for the system response.
This method is relatively simple and does not require any hardware modification. However, it is a one-dimensional eddy-current compensation method that does not account for the spatial distribution of the residual magnetic field distortions caused by eddy currents in the scanner’s conductive structures.
Residual eddy currents can be effectively suppressed by proper design of the active or passive shielding layers of the gradient coils, or by reducing the coil/bore diameter ratio as mentioned earlier. Both methods require sufficient space, resulting in a reduction of the maximum imaging volume.
The use of active shielding of gradient coils is one of the most effective ways to reduce eddy currents; however, this method is not 100 % effective in practice [6]. Therefore, additional compensation techniques are necessary. One such approach is gradient pre-emphasis, which proactively adjusts the gradient control waveform to counteract the effects of eddy currents. This method significantly improves performance; however, further optimization and correction of gradient coil design are still necessary.
In [1], [2], an analytical approach was used to model eddy currents, considering only the axial gradient component (Gz). The system was approximated by Maxwell loop pairs, assuming cylindrical symmetry. The resulting transfer function describes the interaction between the gradient coils and the induced eddy currents. Numerical simulations indicate that the time-compensation method improves the bandwidth reduction factor by more than 2.5 times, enhancing the system’s response to gradient switching.
In study [7], a method for correcting eddy current effects by measuring the actual k-space trajectories in MRI was proposed. This postprocessing method is difficult to use for correcting images obtained by conventional imaging protocols such as SE and FSE [6]. It should be noted that a key advantage of postprocessing methods is that they do not require additional hardware, making them more accessible in terms of implementation. Their disadvantage is the need for more computational power and the associated time consumption.
Once the gradient pre-emphasis (PE) has been properly adjusted using the time compensation method, the undesired influence of eddy currents can be further reduced by modifying the measurement sequences themselves through the implementation of eddy-current compensation pulses [8]. These pulses are intended to balance the transient gradient integral and mitigate effects caused by switching gradient fields, such as residual magnetization and eddy currents. As mentioned in [8], the imaging sequence shown in Fig. 1 can be used to map the spatial distribution of magnetic fields induced by eddy currents. The sequence is based on the stimulated echo and consists of three 90° excitation pulses, with the first two pulses being “hard pulses” (broadband). The third, selective “sinc” pulse defines the slice. During the application of the second radiofrequency pulse, a gradient is present, which, together with the RF pulse, defines the excitation selectivity. The negative lobe of the readout gradient during the phase gradient pulse duration also contributes to the rephasing process. By placing an arbitrary sequence of gradient pulses at the beginning of the above mentioned imaging sequence, separated from the actual mapping sequence by a time period ta – defined as the duration from the end of the tested gradient pulse sequence to the start of the mapping – the distribution and time evolution of the fields induced by the eddy currents can be observed. To eliminate the influence of the imaging sequence itself on the eddy currents, it is necessary to run the imaging sequence twice: once with and once without the tested sequence of gradient pulses. The resulting image, obtained as the difference between the phase images with and without the test gradient sequence, contains information about the magnetic field variation caused by gradient switching in the test sequence. By changing the time ta between the end of the test gradient sequence and the first radiofrequency pulse of the imaging sequence, information about the temporal evolution of these field variations can be extracted. To reduce the influence of the switching of the gradient pulses in the second period of TE/2 on most of the eddy currents, the time interval τ between the second and third radiofrequency pulses should be as long as possible [8]. In study [8], it was shown that compensation of eddy currents by means of pre-emphasis has its limits. While pre-emphasis is designed to correct gradient shape distortions, residual higher-order components may still persist. These components refer to temporally evolving distortions that are not fully corrected by the applied pre-emphasis scheme. In practice, these components are difficult to compensate, confirming that it is preferable to reduce the effects of these eddy currents rather than compensating for their effects through opposing currents in the shielding coils.
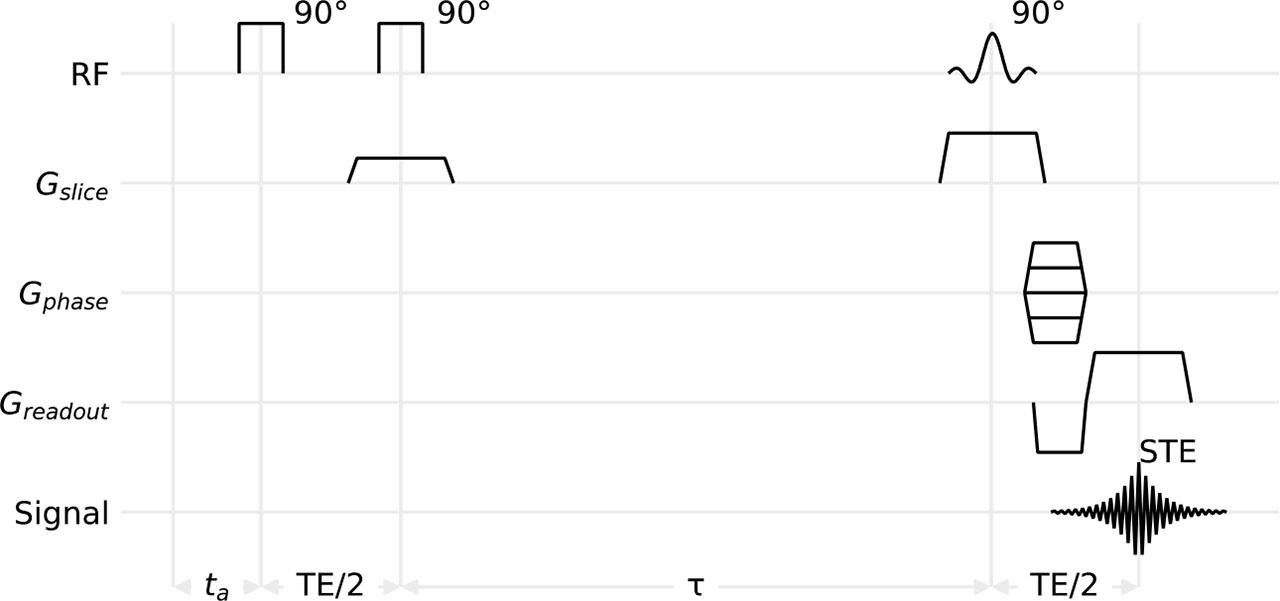
Schematic drawing of the imaging sequence for mapping time-dependent magnetic field changes induced by an arbitrary sequence of gradient pulses. Greadout – reading gradient, Gphase – phase encoding gradient, Gslice – slice selective gradient, RF – radiofrequency pulses, Signal – acquisition, τ – time interval used to minimize residual effects of eddy currents induced by the gradient during the second excitation pulse.
In electrically conducting materials exposed to time-dependent magnetic fields, eddy currents can be induced if conditions allow sufficient electromagnetic interaction. The magnitude of such currents strongly depends on the time change of the external magnetic field. In MRI devices, the FID signal is influenced by the time-ramp functions of gradient magnetic flux density at the beginning and end of their switching. The induced eddy currents over time can be modeled as a superposition of several exponentially decaying functions with different time scales, Ai exp(−t/τi) for i = 1, ⋯ , n, where n is the fixed number of exponentially decaying functions used in the model. Each can be described by an amplitude constant Ai and a time constant τi. In general, the separation of each exponentially decaying time-dependent function can be achieved by a simple gradient ring-down (GRD) experiment executing a specific MRI measurement sequence (see Fig. 2).
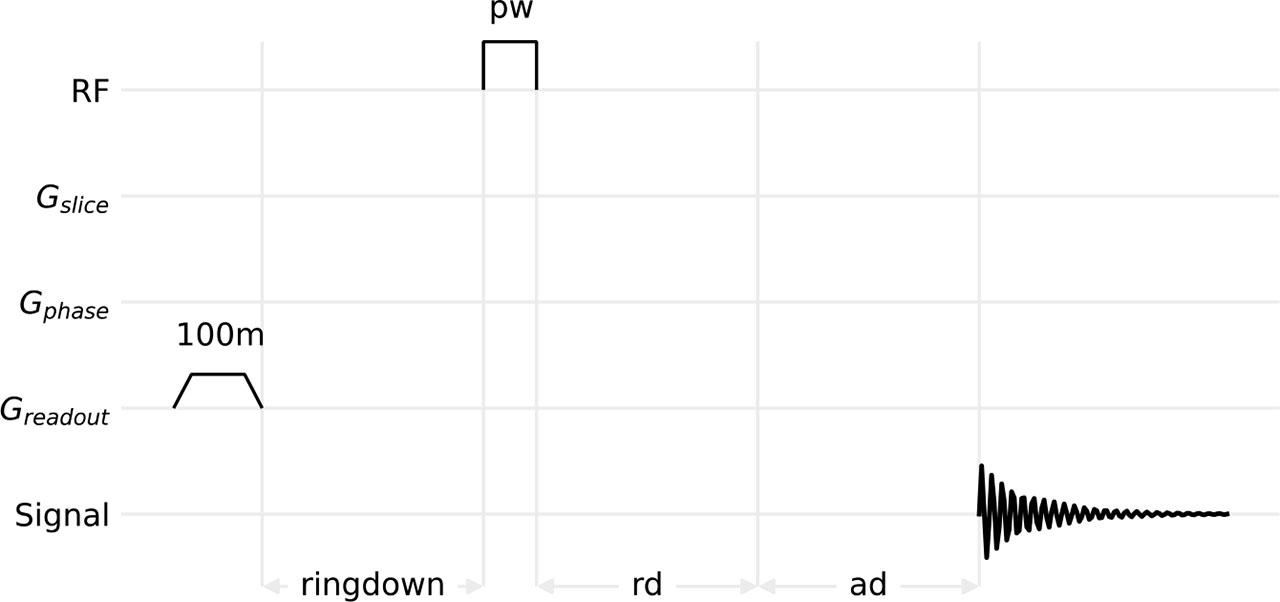
Ring-down sequence. rd – is the time interval for unblanking the receiver, and ad – is the interval from receiver unblanking to signal acquisition. In our case, both were set to 1 μs.
In this experiment, the gradient was switched on and then switched off after a defined plateau. Next, a defined ringdown delay dj was applied, after which a hard pulse was executed, and finally, the FID signal was measured. The effect of eddy currents on the measured FID increases as the delay dj decreases, reaching a maximum at the shortest delay. This is manifested not only by the decay of the FID signal but also by an accelerated decay rate, as illustrated in Fig. 3(a). Therefore, if we determine the dependence of the induced eddy current effect (characterized by amplitude Ai and time constant τi) on delay dj, we can compensate for eddy current effects in the measured FID signal by modifying the gradient rise time and gradient fall time of the magnetic flux density field. Compensation is achieved through convolution with a superposition of exponentially decaying functions, using the same amplitude Ai and time constant τi:
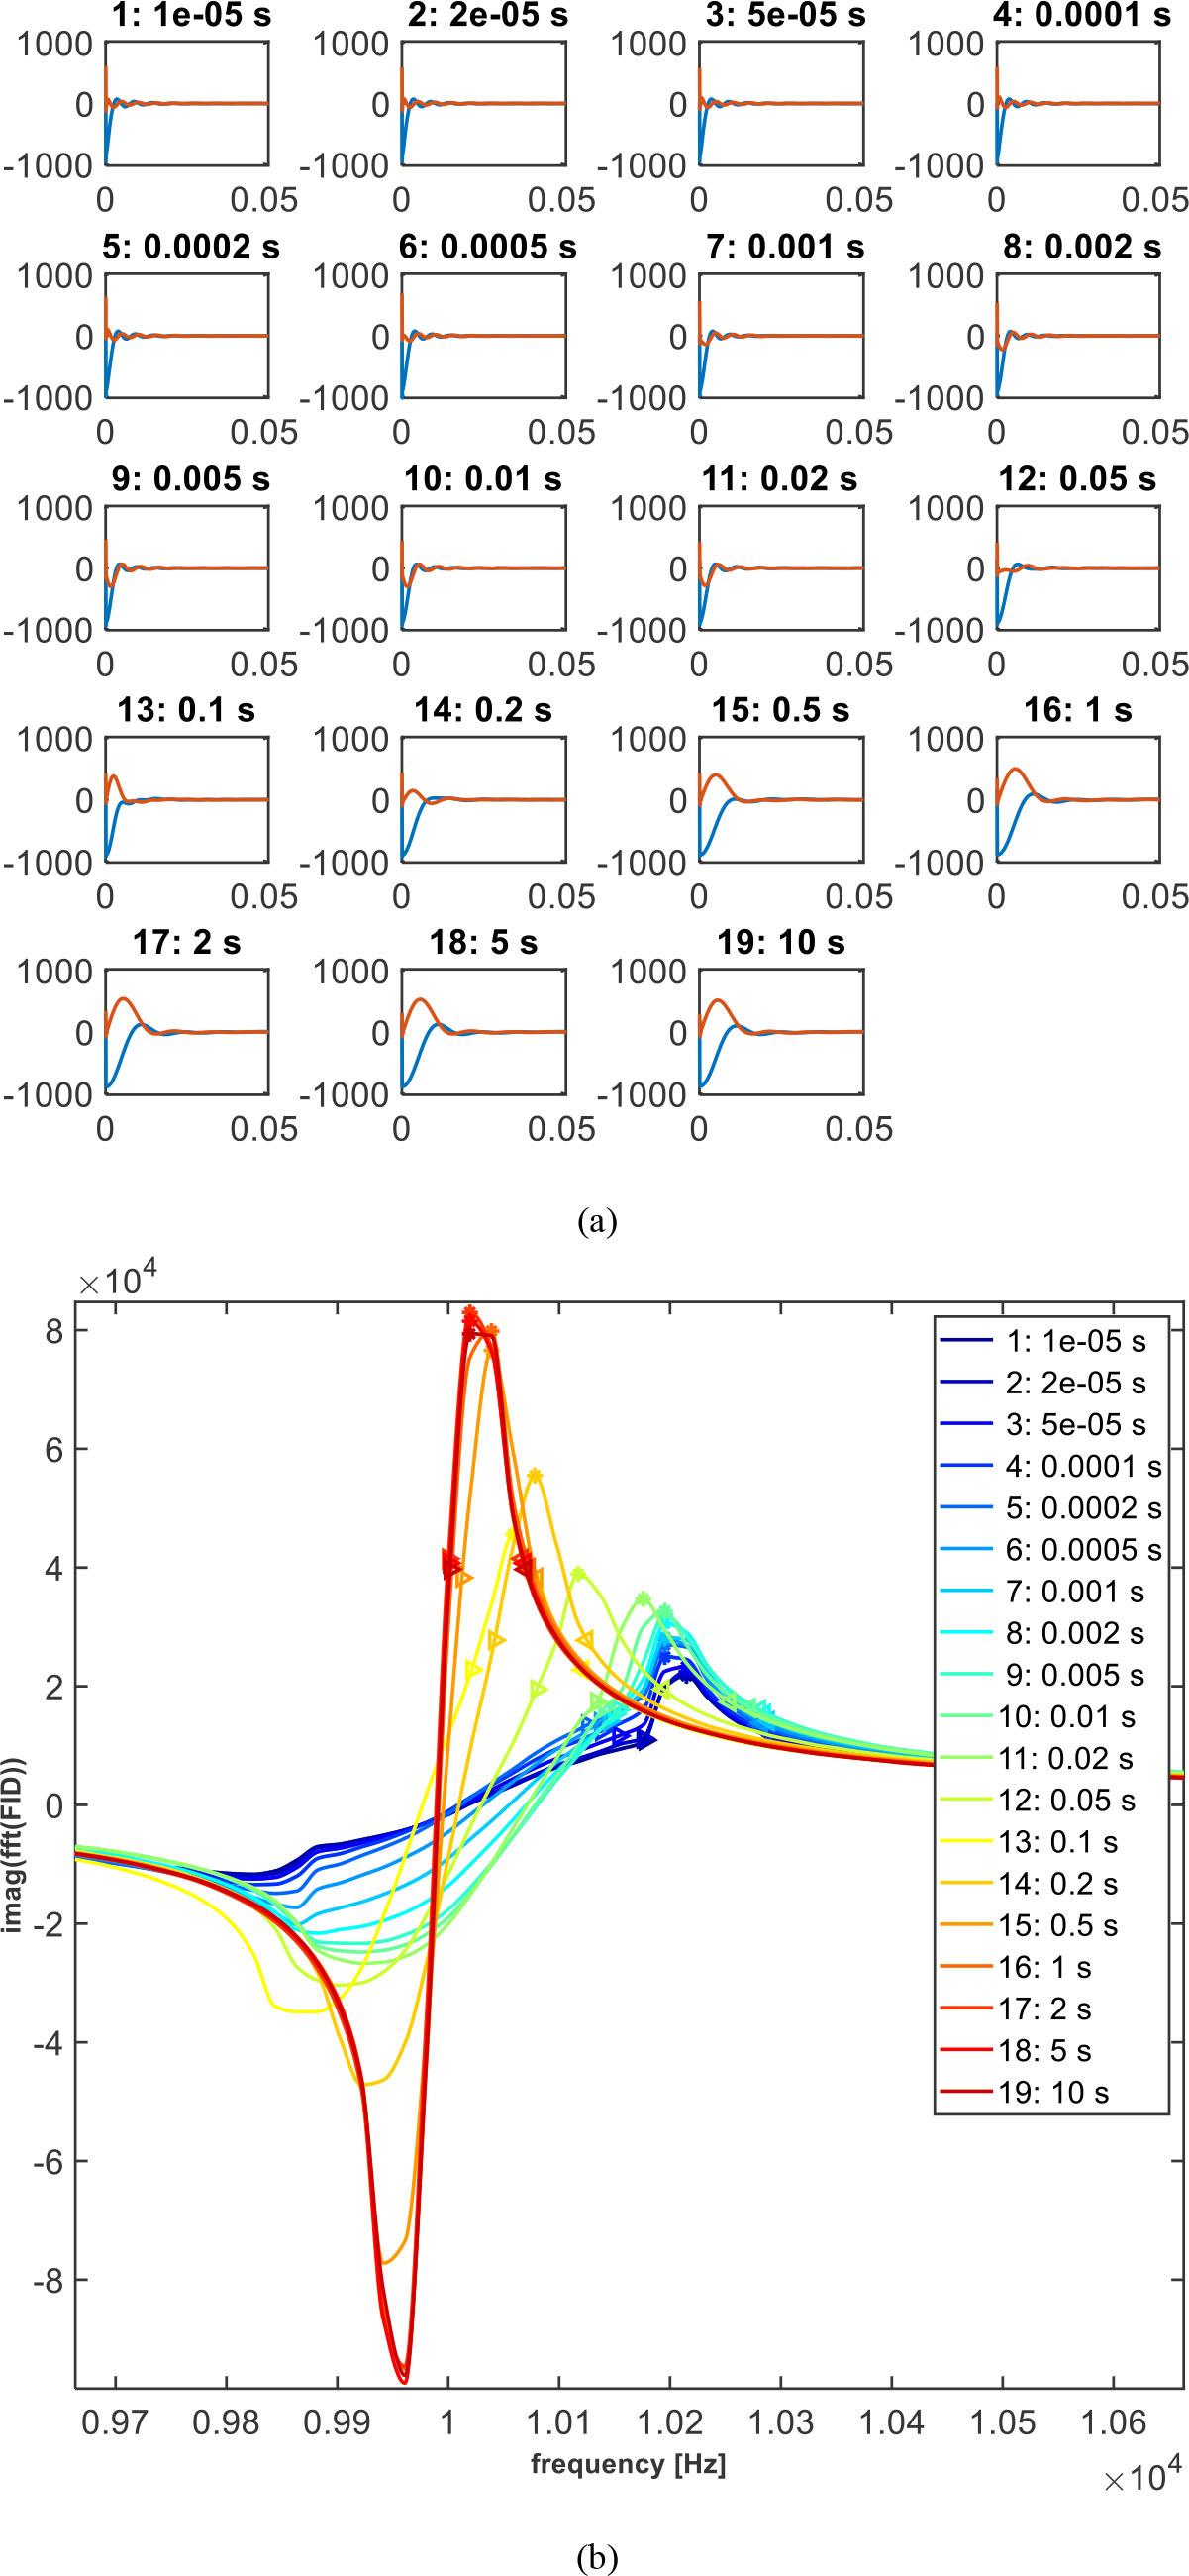
Gradient ring-down experiment for gradient in the x-direction. (a) Measured FID signal for different delays dj (shown in the title of each subplot) sorted in ascending order: (blue) real part and (red) imaginary part. The signal is shown in arbitrary units. (b) Imaginary value of the FFT of the measured FID signal for each delay dj (shown in the legend) sorted in ascending order: the maximal peak (marked with “*”), along with its half-height boundaries (marked with “<” and “>”) that define the peak width wj for each delay, is shown.
Such compensation is referred to as gradient pre-emphasis modulation. Since the model operates in the time domain and is not spatially resolved,
The measure of induced eddy current effect compensation was calculated as follows: Calculate the fast Fourier transform (FFT) of the FID signal, evaluate its absolute, real, or imaginary value (based on your preference), and find the maximal peak and its width for each used delay dj. As the effect of eddy currents increases (with decreasing delay dj), the obtained peak decreases, while its width increases. Therefore, the peak width wj can serve as a measure of the eddy current effect. As a convention, we define wj as the peak width at half of the peak height for each delay dj (see Fig. 3(b) for an illustrative representation, where FFTs of the FID signal for increasing delays dj are shown in the legend).
We can now visualize the dependence of peak width wj on the applied delays dj (see Fig. 4). Delays are distributed homogeneously on a logarithmic scale, which improves the ability to capture eddy current effects across different dj. Finally, we fit the points (dj, wj) (for j = 1, … , m, where m = 19 is the number of considered delays for which the gradient ring-down experiment was performed) as shown in Fig. 4, using a fitting function defined as the superposition of n exponentially decaying functions specified by amplitude Ai and time constant τi, with the least-squares method. In general, the fitting function is slightly modified by two variables, namely rd and ad,
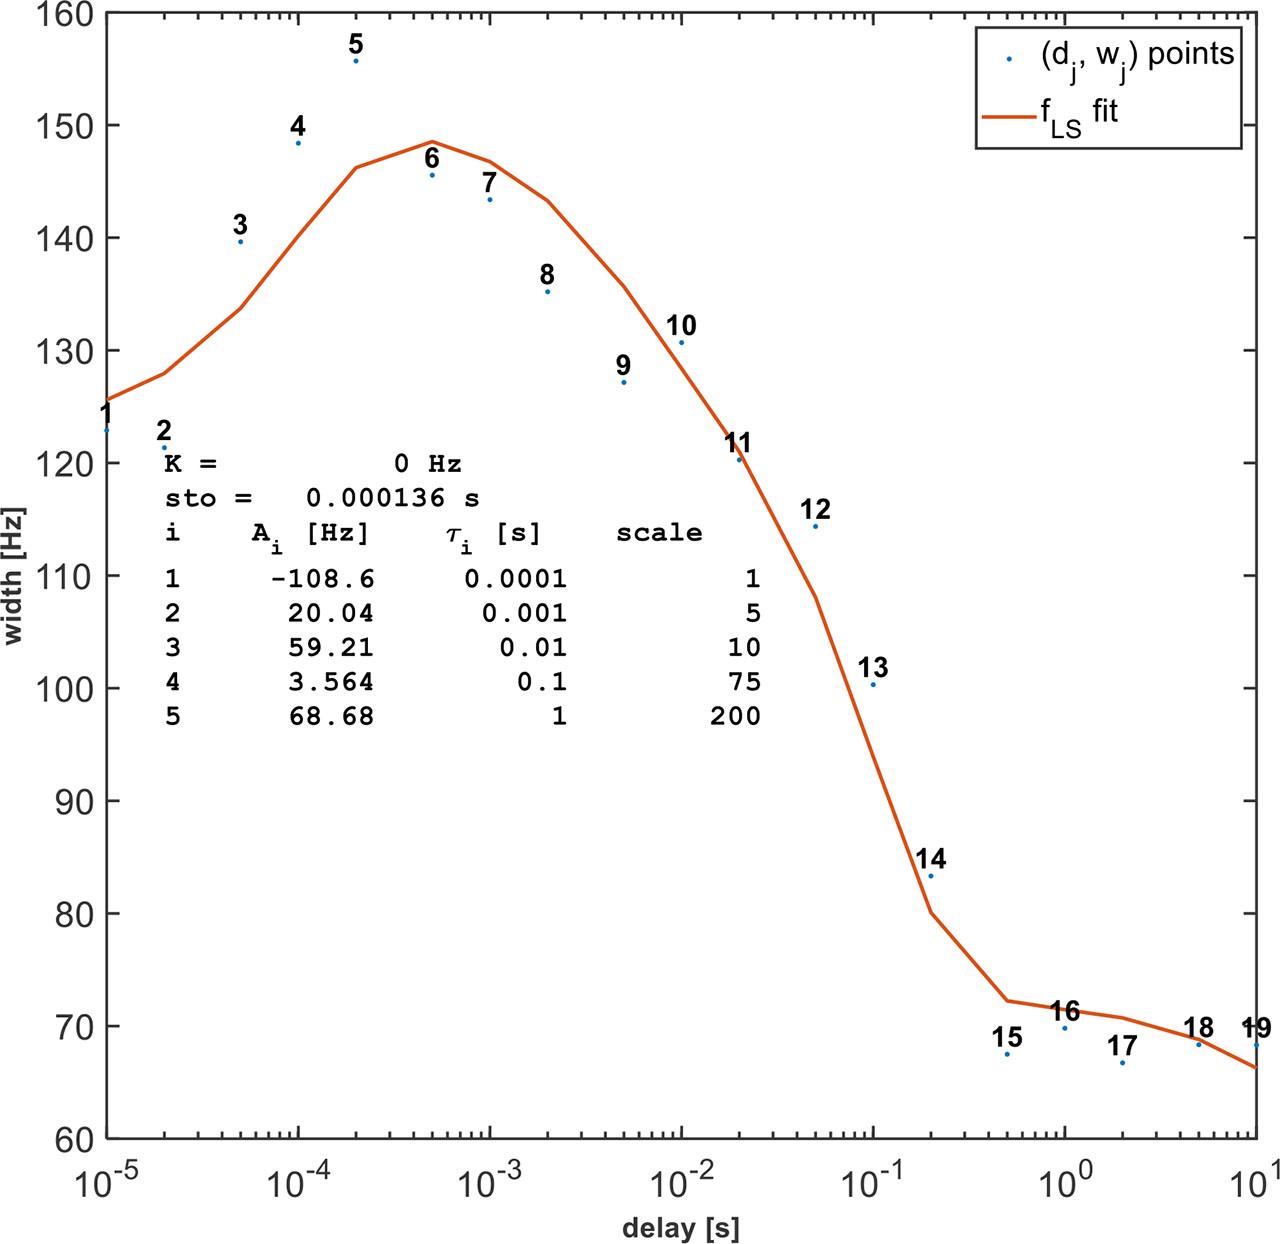
As a result of the fitting algorithm, n pairs of numbers are obtained, namely Ai and τi, i.e., raw amplitude constants (in Hz) and time constants (in s), respectively, for i = 1, … , n. It should be emphasized that the obtained Ai values represent raw amplitudes corresponding to the currently set relative gradient strength (GS) in the gradient ring-down experiment (in our case, Gr = GrGRD ≡ 20) and should therefore be scaled. For this purpose, we conduct a gradient strength experiment: Using a spherical phantom in the MR device, we ensure that the signal is in resonance at the observing frequency and that the pulse width is correctly set for a 90° pulse. First, we verify that the signal is in resonance for zero relative gradient strength (Gr = 0). Then, we set Gr = GrGS ≡ 2 and measure the FID signal. Next, we process the FID signal using FFT and determine the peak width (wGS) at half of the peak height from its absolute value. Finally, scaled amplitude constants are evaluated from the expression:
These values should be used in (5) instead of Ai to compensate for eddy current effects. Also, for the real system in general,
The obtained expression represents the full gradient pre-emphasis modulation in the direction defined in the gradient ring-down experiment. The same algorithm should be executed for the other directions specified in the gradient ring-down experiment.
The simplified model of eddy currents affects gradient pre-emphasis compensation.
Eddy current effects induced during rapid switching of gradient fields should, in the zero-th order, be modeled as exponentially decaying functions, one for each eddy current source (on different time scales), which modulate the input signal. Therefore, if we consider the magnetic flux density field of an ideally switching gradient evolving in time
Simplified model of eddy current effects and gradient pre-emphasis compensation: (a) Eddy current model, where
Values of parameters for simulations and experiments.
| Description | Symbol | Value | Unit |
|---|---|---|---|
| Common parameters: | |||
| Time step size | ∆t | 50 | μs |
| Gradient ramp time | tramp | 900 | μs |
| Gradient plateau time | tplato | 2 | ms |
| Gradient strength in GRD experiment | GrGRD | 20 | % |
| Gradient strength in GS experiment | GrGS | 2 | % |
| Peak width in GS experiment | wGS | 1191.1 | Hz |
| Number of EC sources | n | 5 | 1 |
| Simplified model of ECs effects gradient PE compensation: | |||
| Gradient max magnetic flux density | max (Bideal) | 1 | T |
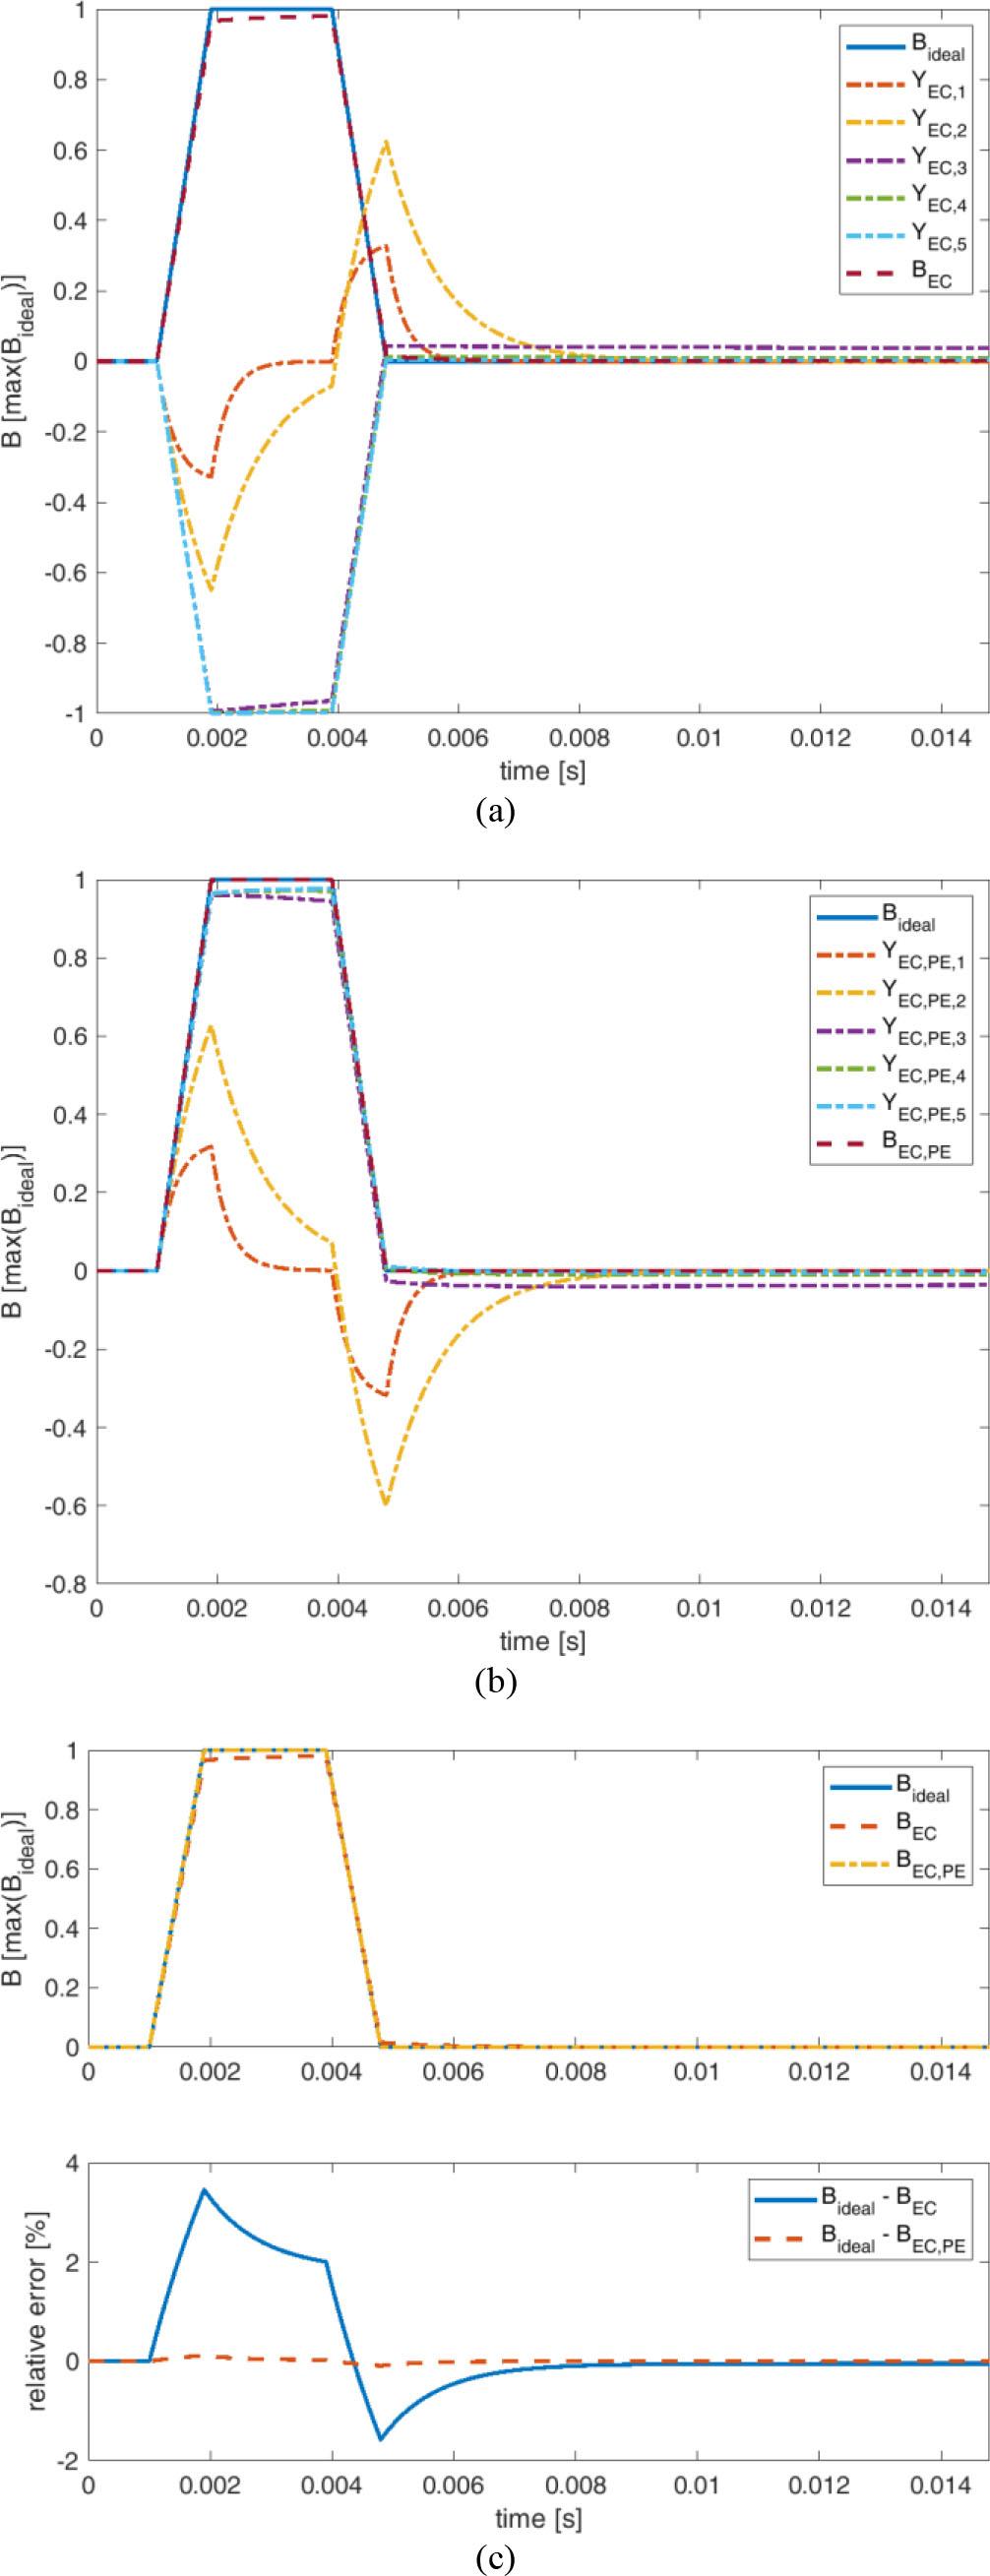
As described in the Subjects and Methods section, we performed gradient pre-emphasis compensation of eddy currents involved in
Finally, we compared both models with ideal gradient switching and computed relative errors, whose time evolution is shown in Fig. 5(c) for the parameter values specified in Table 1. The eddy current effects generate errors up to 3.5 %, and after switching off the gradient, an exponentially decaying relative error of about 2 % persists. After gradient pre-emphasis compensation, the maximal relative error is below 0.12 %.
The plots in Fig. 6 show the difference between the corrected and uncorrected pre-emphases for each gradient. The correction values for the APOLO console, manufactured by Tecmag Inc., 3656 Westchase Dr, Houston, TX77042, USA, calculated from measurements of the individual gradients, are shown in Table 2. Time constants from T1 to T5 are scaled by the scale values 1, 5, 10, 75, and 200. As seen from the plots of the pre-emphases measured before and after correction, the method used significantly contributed to compensating for the influence of eddy currents.

Measured eddy current effect gradient pre-emphasis compensation in the gradient ring-down experiment: the ° indicates uncompensated data, (blue) fitting function, and the * indicates gradient pre-emphasis compensated data with fitting function (yellow).
The correction values for APOLO console.
| Description | Grx | Gry | Grz |
|---|---|---|---|
| A0 | 50 | 50 | 50 |
| A1 | 67.055 | −2.9362 | 19.36 |
| A2 | 4.2602 | 0.54167 | 2.6 |
| A3 | 0.48708 | 1.6002 | 1.6099 |
| A4 | −0.60883 | 0.096324 | −0.27792 |
| A5 | 2.2315 | 1.8562 | 2.2057 |
| T1 [μs] | 100 | 100 | 100 |
| T2 [ms] | 1 | 1 | 1 |
| T3 [ms] | 10 | 10 | 10 |
| T4 [ms] | 100 | 100 | 100 |
| T5 [s] | 1 | 1 | 1 |
Note: Grx, Gry, and Grz gradient amplitudes for A0 to A5 are in arbitrary units.
In the study, the influence of eddy currents on the resulting shape of gradient pulses was analyzed. By subsequently measuring the gradient pulses in the x, y, and z directions, the effect of eddy currents on the gradient pulses in a real NMR system was analyzed. Based on these measurements, correction values were calculated to shape gradient pulses so that the desired shape of the gradient pulses is achieved after the response of the set of edge currents. Although this method is effective in addressing the influence of eddy currents on gradient pulses, proper gradient design and their shielding are also necessary to achieve the desired gradient pulse properties.