Fig. 1.
![NURBS curve related to the airfoil profile [75] NACA2415 (Axes show the toolpath coordinates in the XY plane: X-axis (mm) and Y-axis (mm).](https://sciendo-parsed.s3.eu-central-1.amazonaws.com/68c7cb8881e1b93419683563/j_msr-2025-0031_fig_001.jpg?X-Amz-Algorithm=AWS4-HMAC-SHA256&X-Amz-Content-Sha256=UNSIGNED-PAYLOAD&X-Amz-Credential=AKIA6AP2G7AKOUXAVR44%2F20251127%2Feu-central-1%2Fs3%2Faws4_request&X-Amz-Date=20251127T204159Z&X-Amz-Expires=3600&X-Amz-Signature=482e00c48a9c0dc446c3ab488b147b636c5ba93719b73a2db10de9baf7f344b7&X-Amz-SignedHeaders=host&x-amz-checksum-mode=ENABLED&x-id=GetObject)
Fig. 2.
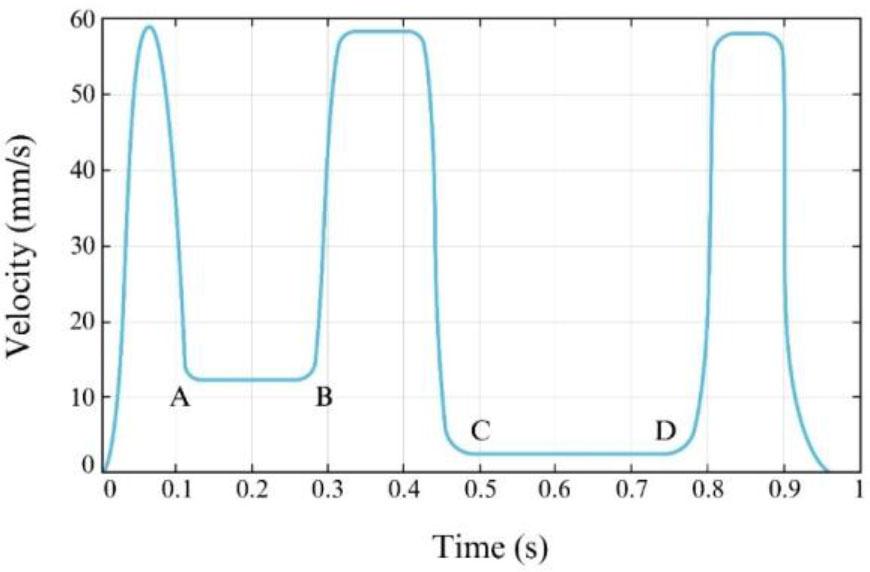
Fig. 3.
![Servo control system block diagram [16].](https://sciendo-parsed.s3.eu-central-1.amazonaws.com/68c7cb8881e1b93419683563/j_msr-2025-0031_fig_003.jpg?X-Amz-Algorithm=AWS4-HMAC-SHA256&X-Amz-Content-Sha256=UNSIGNED-PAYLOAD&X-Amz-Credential=AKIA6AP2G7AKOUXAVR44%2F20251127%2Feu-central-1%2Fs3%2Faws4_request&X-Amz-Date=20251127T204159Z&X-Amz-Expires=3600&X-Amz-Signature=78fcd26776c7367bb2954eaf2a93537a92bbfae237a68516b560d38d5dd1cbbb&X-Amz-SignedHeaders=host&x-amz-checksum-mode=ENABLED&x-id=GetObject)
Fig. 4.
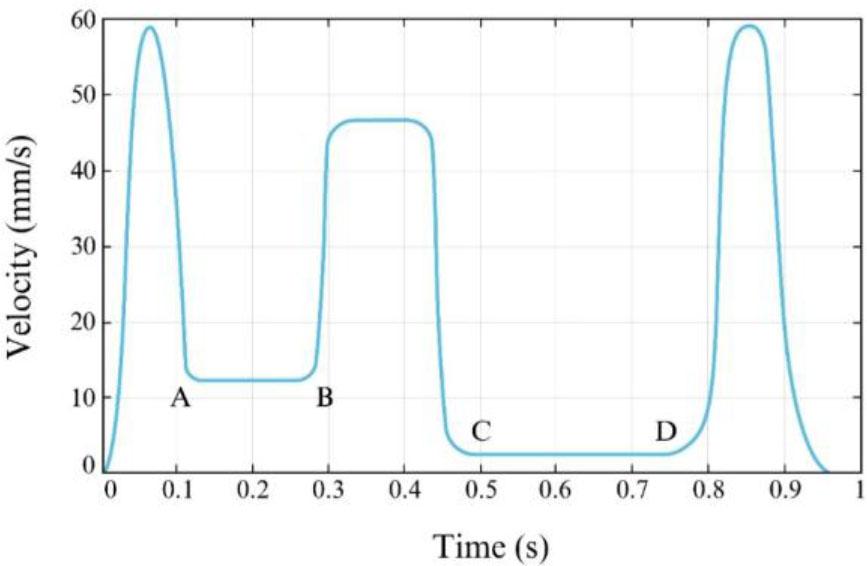
Fig. 5.
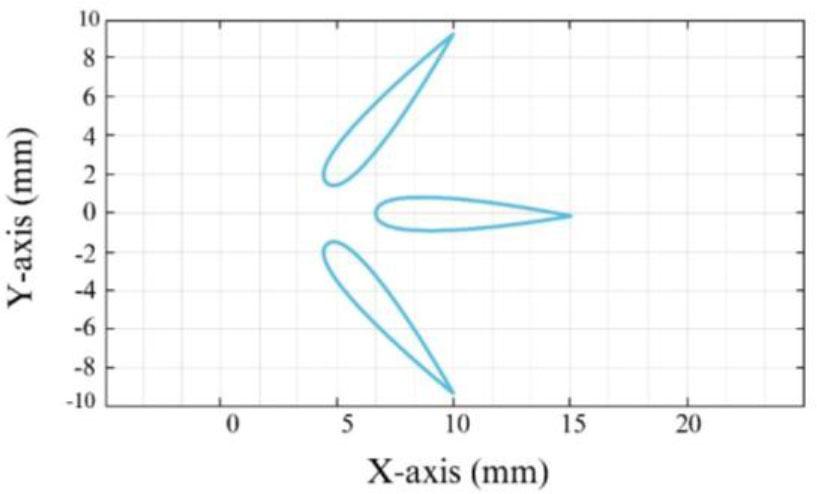
Fig. 6.
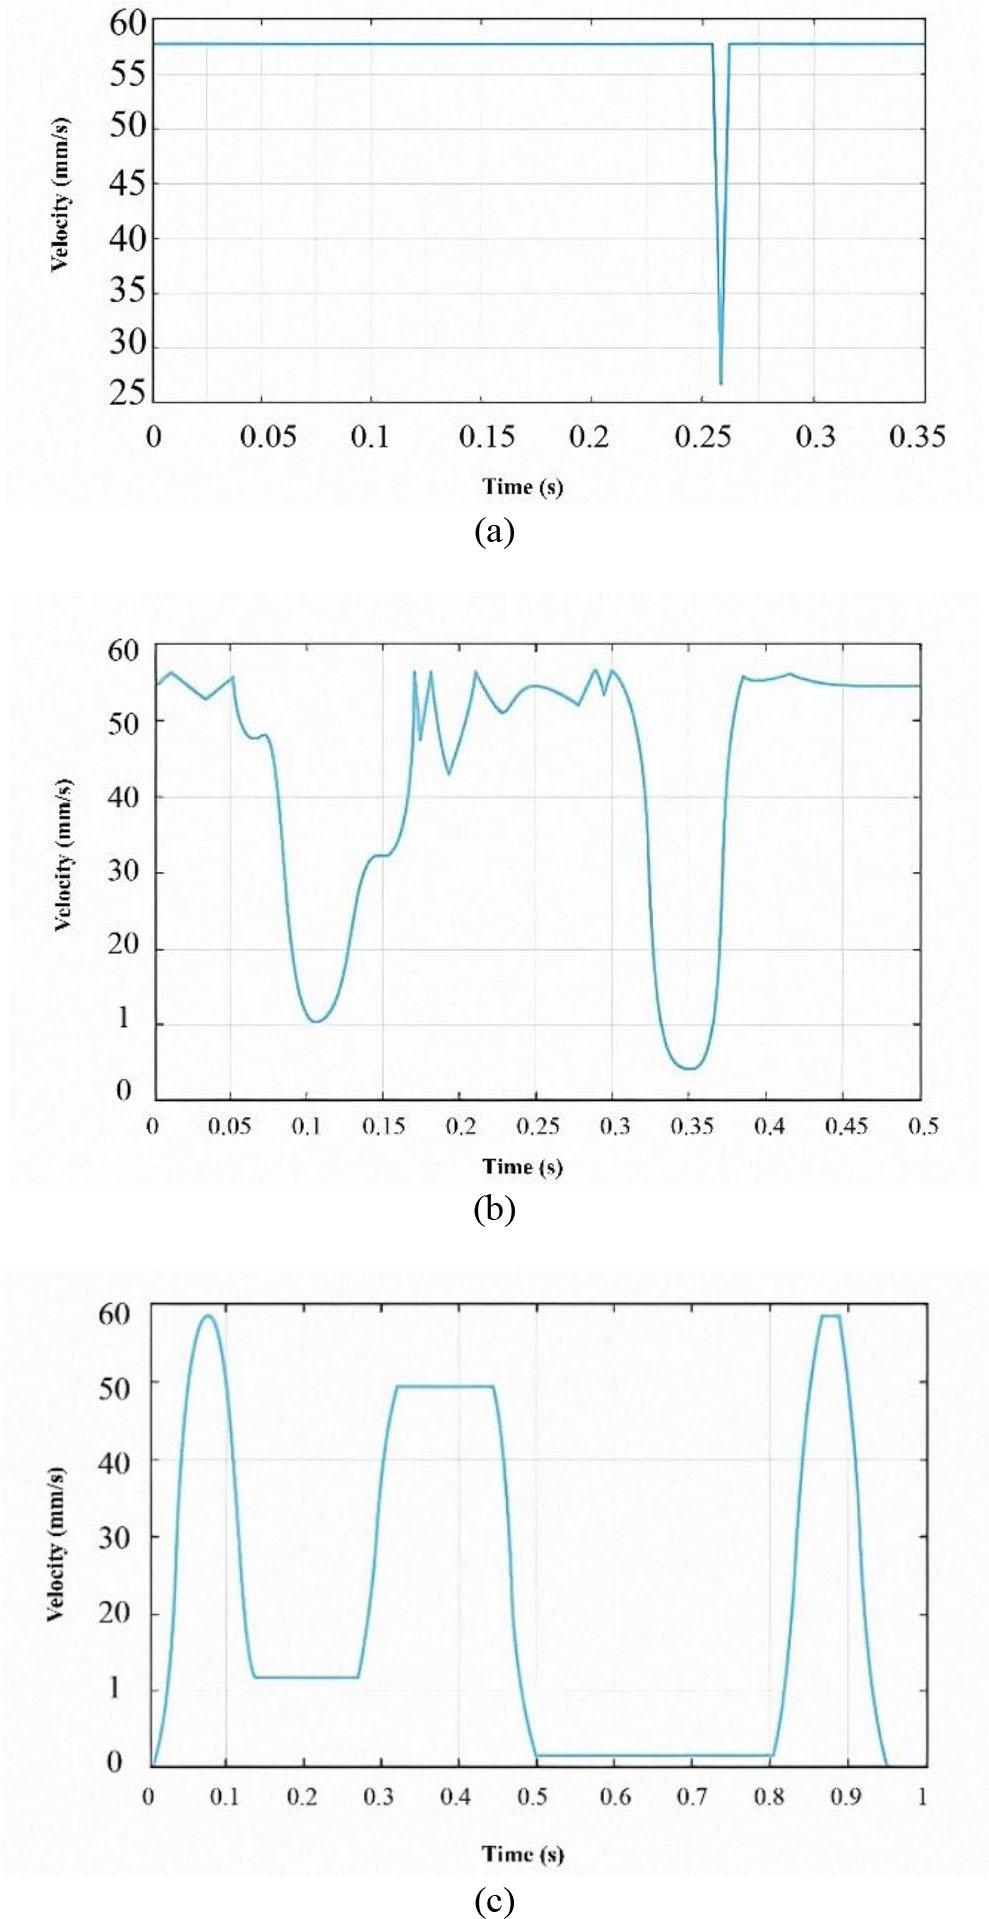
Fig. 7.
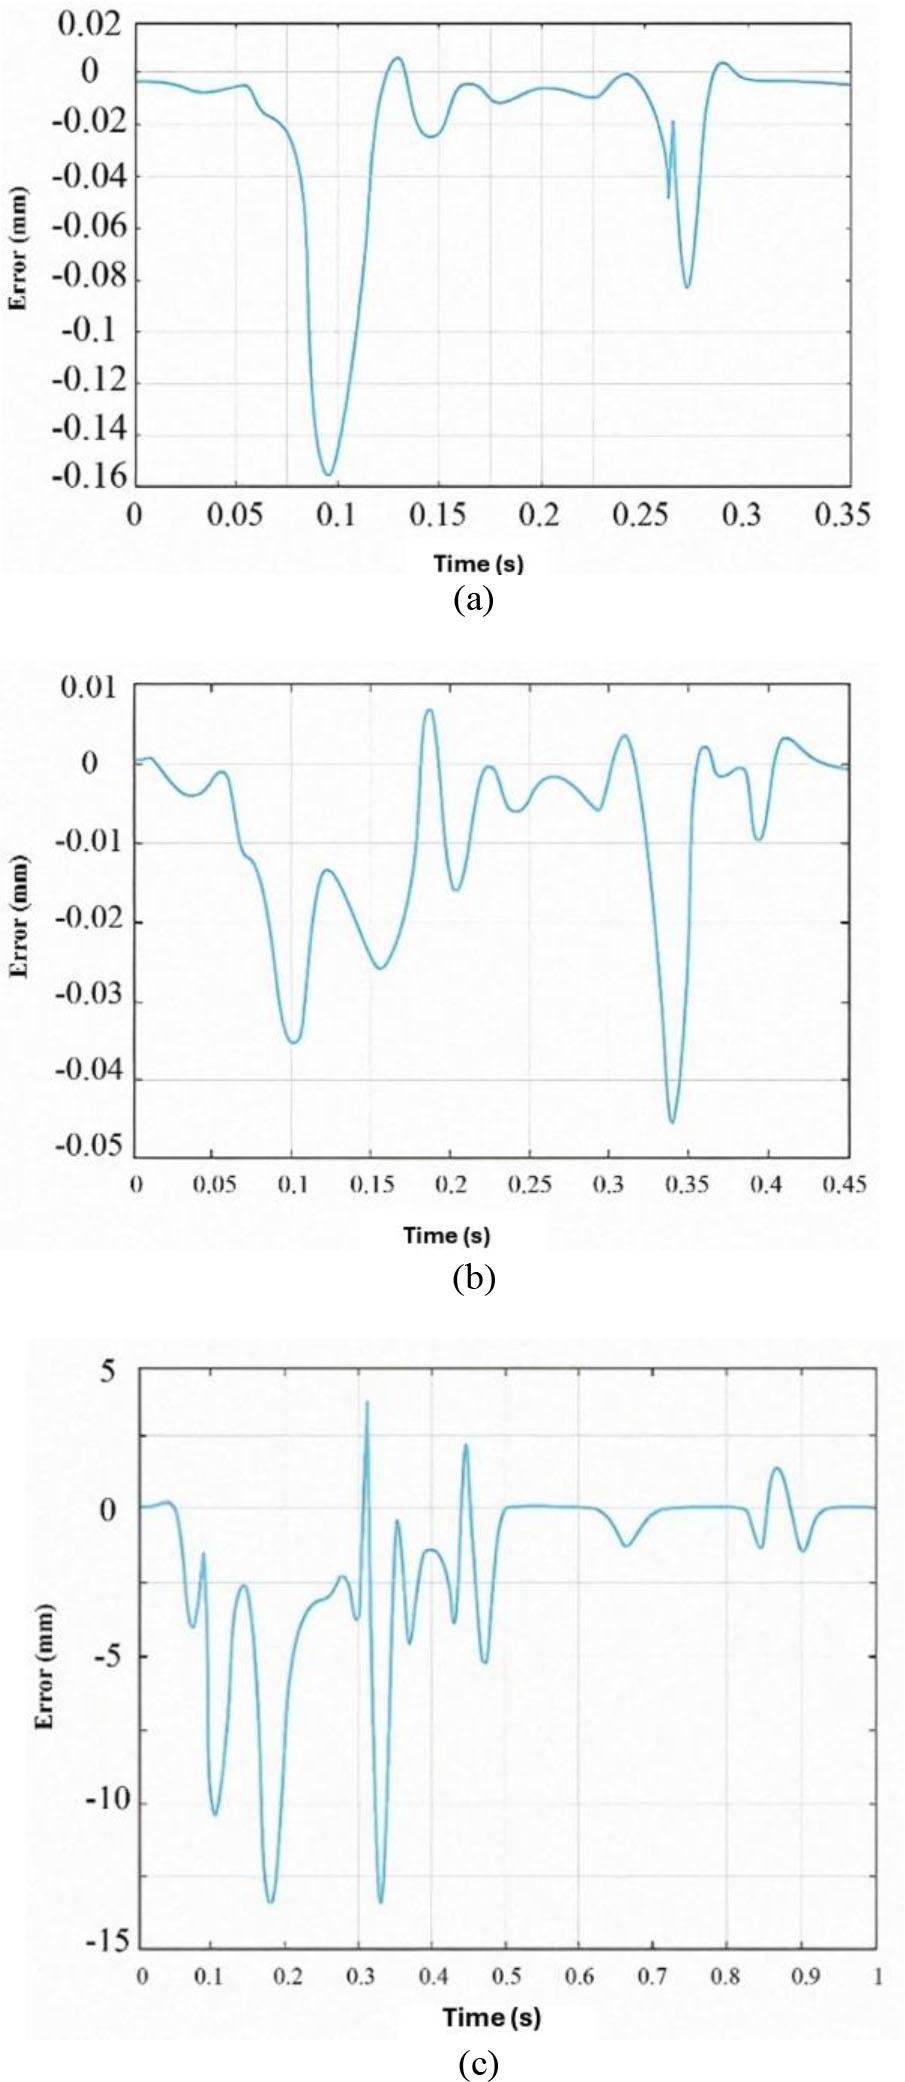
Fig. 8.
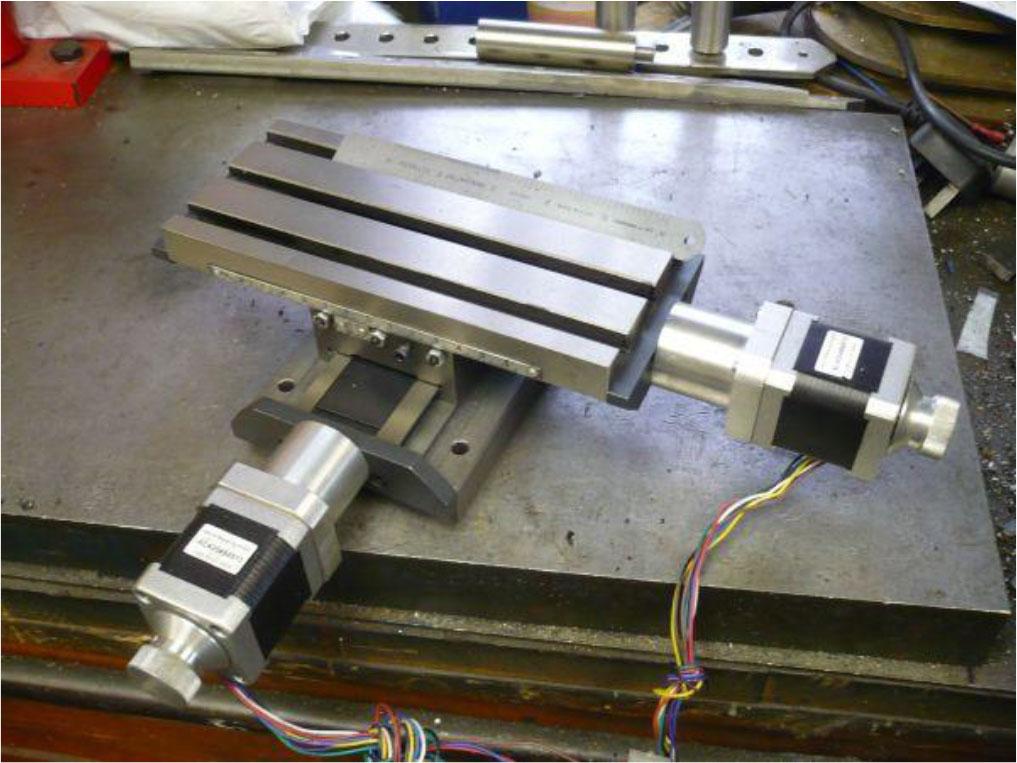
Fig. 9.
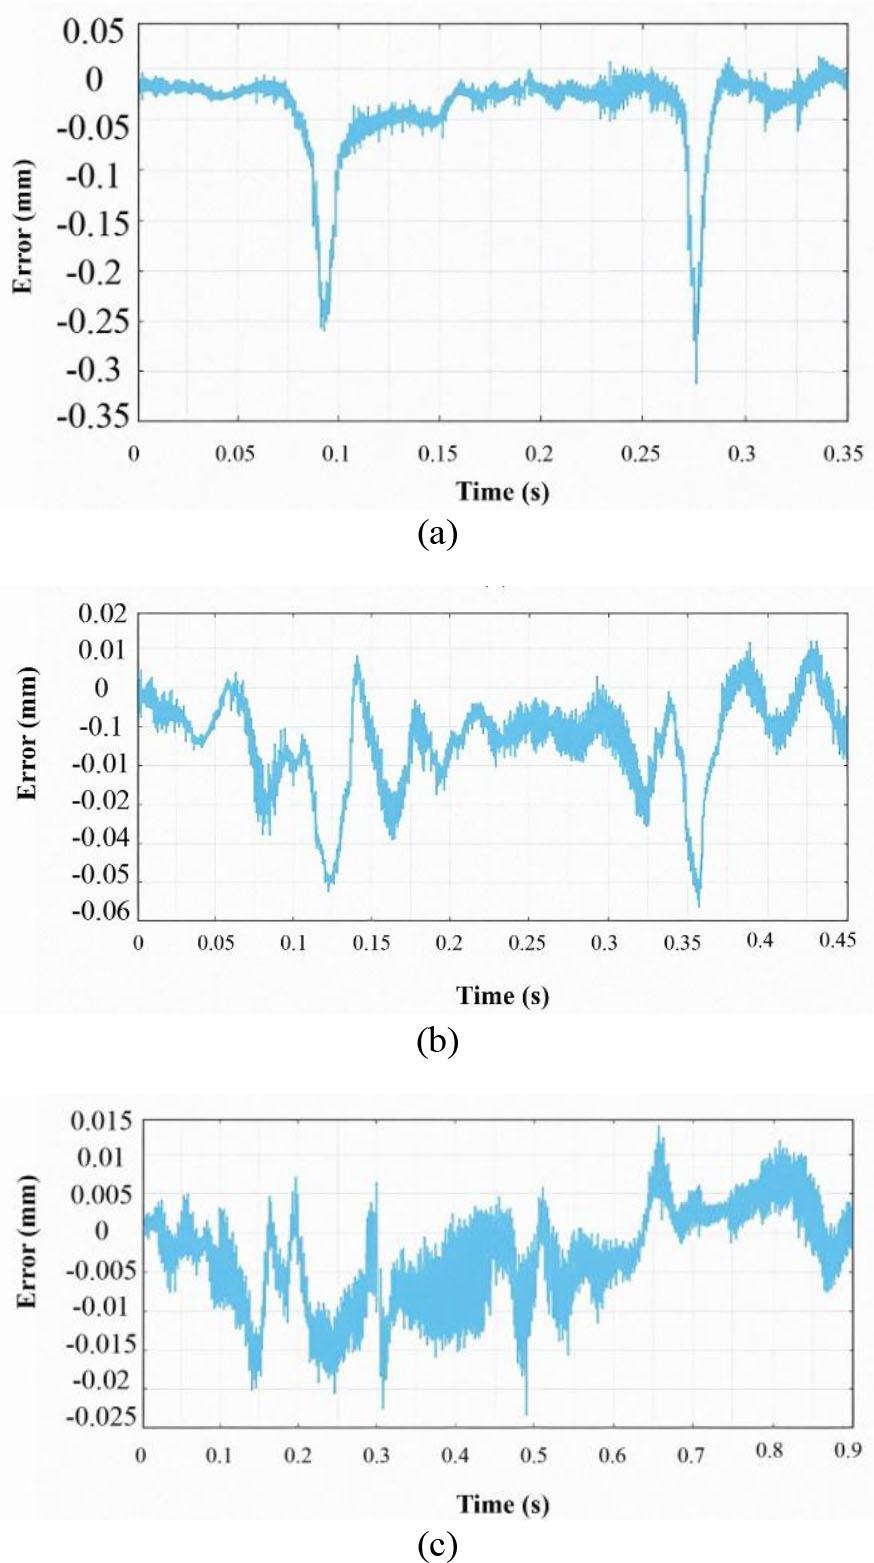
Servo control system transformation function parameters [16]_
| Parameter | X axis | Y axis |
|---|---|---|
| a0 | 1.938 × 10⁹ | 1.904 × 10⁹ |
| a1 | 3.538 × 10⁷ | 3.496 × 10⁷ |
| a2 | 2.135 × 10⁵ | 2.120 × 10⁵ |
| a3 | 6.984 × 10² | 6.948 × 10² |
| a4 | 1.00 | 1.00 |
| b0 | 1.938 × 10⁹ | 1.904 × 10⁹ |
| b1 | 3.476 × 10⁷ | 3.435 × 10⁷ |
| b2 | 1.471 × 10⁵ | 1.466 × 10⁵ |
Performance comparison of interpolation algorithms_
| Interpolation algorithm | Chord error-limited [47] | Curvature-based feed rate [48] | PH-based predictive interpolator | ||
|---|---|---|---|---|---|
| Error on each axis [µm] | X axis | MAX | 357.68 | 194.77 | 56.96 |
| Root mean square | 75.65 | 41.53 | 20.30 | ||
| Y axis | MAX | 132.55 | 22.64 | 13.97 | |
| Root mean square | 26.32 | 8.41 | 3.54 | ||
| Routing error [µm] | MAX | 14.11 | 47.12 | 142.79 | |
| Root mean square | 35.14 | 12.98 | 3.84 | ||
| MIN | 16.780 | 8.51 | 2.32 | ||
| Time [s] | 0.3431 | 0.4526 | 0.3440 | ||
Comparative analysis of the feed rate interpolation algorithms in literature_
| Study | Interpolation method | Max path error [µm] | RMS error [µm] | Feed rate adaptivity | Predictive control | Industrial suitability |
|---|---|---|---|---|---|---|
| [47] | Chord error-limited | 357.68 (X) / 132.55 (Y) | 75.65 / 26.32 | ✗ | ✗ | Limited |
| [48] | Curvature-based | 194.77 (X) / 22.64 (Y) | 41.53 / 8.41 | ✓ | ✗ | Moderate |
| [78], [79] | Jerk-limited cubic spline | 65 – 120 (AVG) | 22 – 30 | ✓ | ✗ | Moderate |
| [11], [14] | Real-time PH interpolation | ∼60 – 100 | N/A | ✓ | Partial | High |
| This study | PH-based predictive | 57.85 (X) / 43.62 (Y) | 20.25 / 14.85 | ✓ | ✓ | High |
Profile airfoil PH curve error comparison_
| Error [µm] | ||||
| Curve area | No area division | Division by area | ||
| Base mean square | Max | Base mean square | Max | |
| AB | 4.9193 | 13.43 | 0.5025 | 1.43 |
| CD | 4.3792 | 9.78 | 0.5462 | 1.45 |
Hardware specifications used in the experiment_
| Item | Description | Application in industry | Reason for selection |
|---|---|---|---|
| Servo drive | AC servo drive TECO TSTA-20C | Commonly used in CNC machine tools for high-speed, closed-loop motor control | Provides stable torque-speed characteristics and is compatible with standard motion controllers |
| Servo motors | TECO TST0640 / TSB0845 AC servo motors | Widely implemented in industrial X–Y stages and CNC milling systems | High positioning accuracy, low latency response, and encoder feedback support |
| Motion controller | PCI-1240 motion control card | Used in precision motion control applications including real-time CNC path tracking | Offers deterministic motion planning and is compatible with bit-pattern interpolation |
| Digital linear scales | CARMAR high-resolution linear scales (1 µm resolution) | Commonly used in coordinate measuring machines (CMMs) and precision CNC tables | Provides reliable high-resolution feedback for path-following error evaluation |
Simulation and experimental input parameters for evaluating the feed rate-adaptive predictive PH interpolation algorithm_
| Symbol | Description | Value | Unit |
|---|---|---|---|
| Vmax | Maximum feed rate | 3500 | mm/min |
| Amax | Maximum acceleration | 2450 | mm/s2 |
| Jmax | Maximum jerk | 5 × 10⁴ | mm/s3 |
| δ | Lateral error limit | 1.0 | µm |
|
| Reference curve | 1.0 | mm−1 |
| εmax | Path following error limit | 15.0 | µm |
| e | Approximate curve error limit | 1.0 | µm |
Summary of key mathematical parameters and control variables used in the predictive interpolation algorithm, including their physical meaning and relevance to CNC machining operations_
| Symbol | Description | Unit | Relevance in CNC operation |
|---|---|---|---|
| Ts | Sampling period | s | Defines time resolution for interpolator output |
| Vk | Feed rate at step k | mm/s | Instantaneous tool motion speed |
| Ak | Acceleration at step k | mm/s2 | Dynamic response of tool motion |
| δ | Chord error tolerance | mm | Maximum deviation from ideal path for profile generation |
| κ(u) | Scalar curvature | mm−1 | Describes path sharpness, used for adaptive feed rate |
| kth | Curvature threshold | mm−1 | Defines boundary to detect sharp corners |
| Amax | Maximum allowable acceleration | mm/s2 | Mechanical limit of CNC axis acceleration |
| Vmax | Maximum allowable feed rate | mm/s | Cap of commanded feed velocity |
| Δs | Arc-length step per interpolation | mm | Tool travel distance per cycle |
| L | Lookahead arc window | mm | Used for predicting upcoming curvature transitions |
| ɛe | Path-following error | mm | Actual deviation from commanded path |
| ϕ | Tangent angle of toolpath | rad | Used for transforming Cartesian error into tangential form |
Experimental machining accuracy using PH-based predictive interpolation_
| Metric | X axis [µm] | Y axis [µm] | Combined error [µm] |
|---|---|---|---|
| Maximum path-following error | 57.85 | 43.62 | 14.10 |
| RMS path-following error | 20.25 | 14.85 | 3.84 |
| Minimum error observed | 2.31 | 2.31 | 2.31 |
| Average deviation from reference trajectory | 18.21 | 13.74 | — |
| Machining tolerance achieved (from ruler data) | ±15 | ±15 | Within allowed range |
Airfoil curve numerical simulation at three angles_
| Interpolation algorithm | 0° | –45° | 45° | ||
|---|---|---|---|---|---|
| Error on each axis [µm] | X axis | MAX | 57.97 | 43.51 | 38.71 |
| Root mean square | 20.30 | 14.93 | 14.19 | ||
| Y axis | MAX | 13.98 | 38.85 | 43.66 | |
| Root mean square | 3.56 | 14.24 | 14.99 | ||
| Routing error [µm] | MAX | 14.11 | 14.11 | 14.12 | |
| Root mean square | 35.14 | 3.84 | 3.84 | ||
| MIN | 16.780 | 2.31 | 2.31 | ||
Predictive interpolation parameter definitions_
| Parameter | Description | Value / range | Unit |
|---|---|---|---|
| amax | Maximum allowable tangential acceleration | 2 | m/s2 |
| Vmax | Maximum allowable feed rate | 1 | m/s |
| ɛ | Small positive constant to prevent division by zero in curvature-based calculations | 10−6 | |
| Δs | Arc-length step per interpolation cycle | 0.05 – 0.2 | mm |
| L | Lookahead arc length used for predictive curvature filtering | 5 – 10 | mm |