
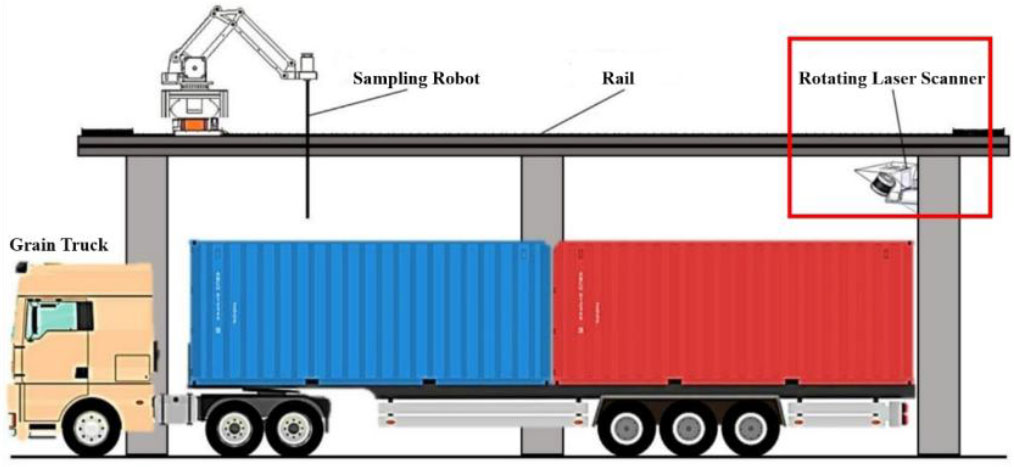
Fig. 1.
Automatic sampling system.
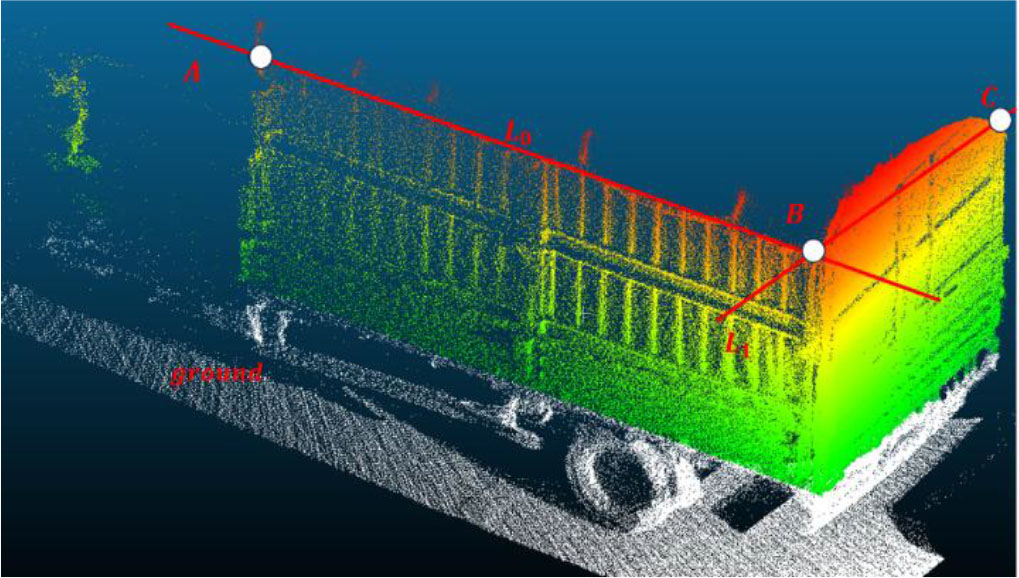
Fig. 2.
Principle of measurement.
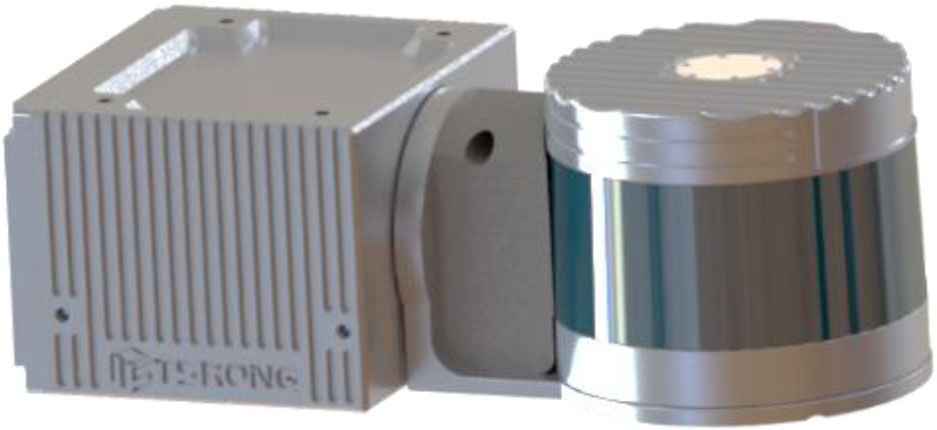
Fig. 3.
Rotating laser scanner.
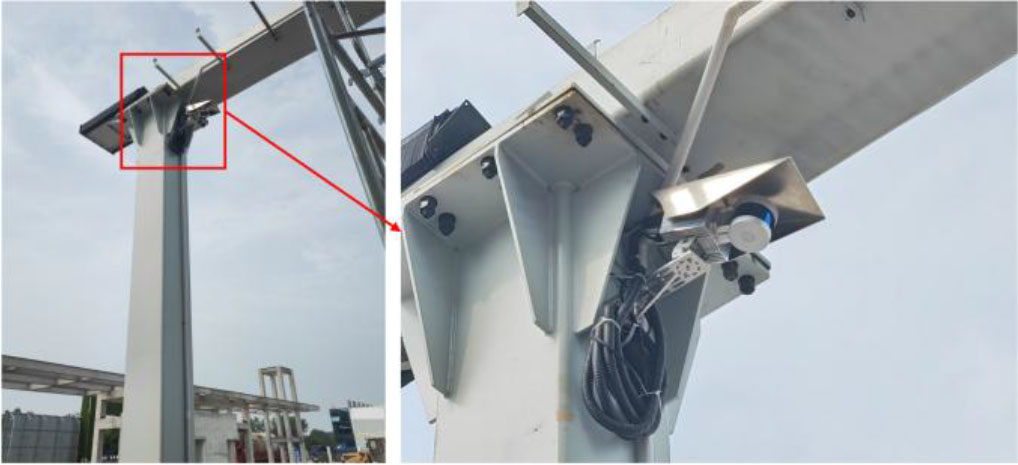
Fig. 4.
Installation diagram of the rotating laser scanner.
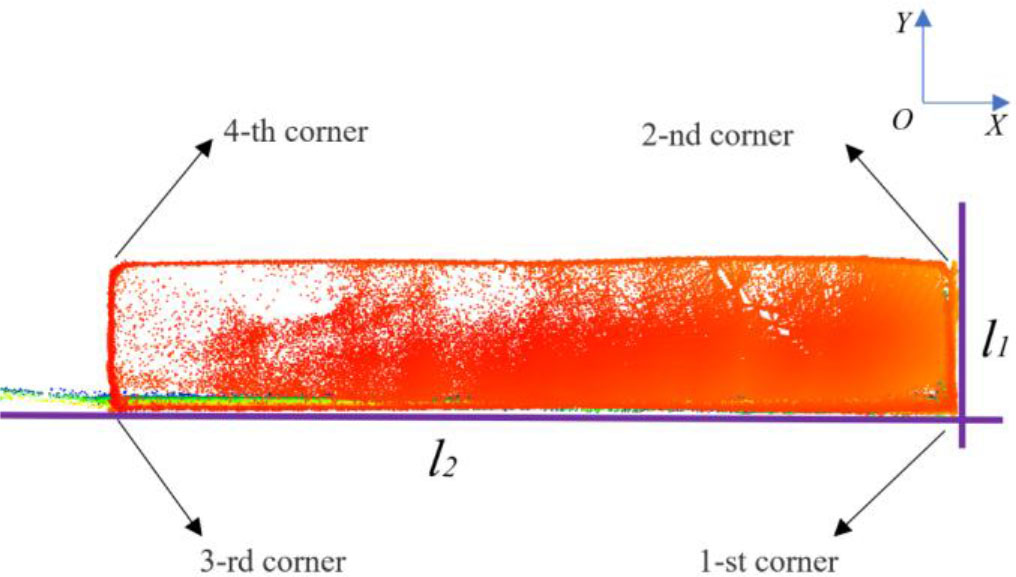
Fig. 5.
Scanned truck carriage point cloud.
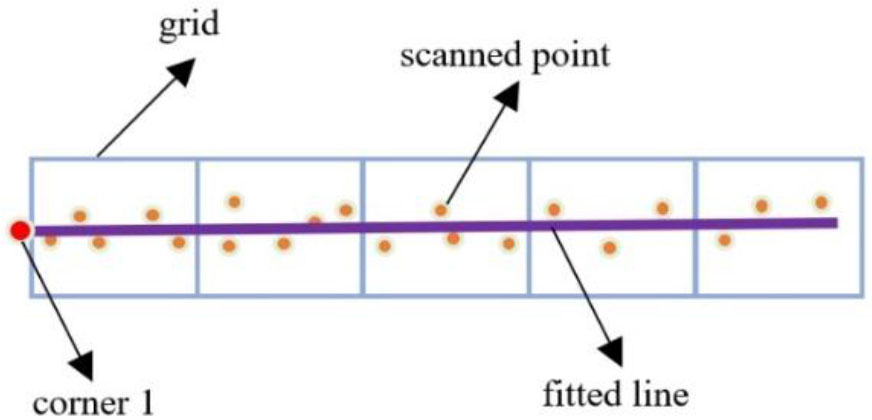
Fig. 6.
Grid division.
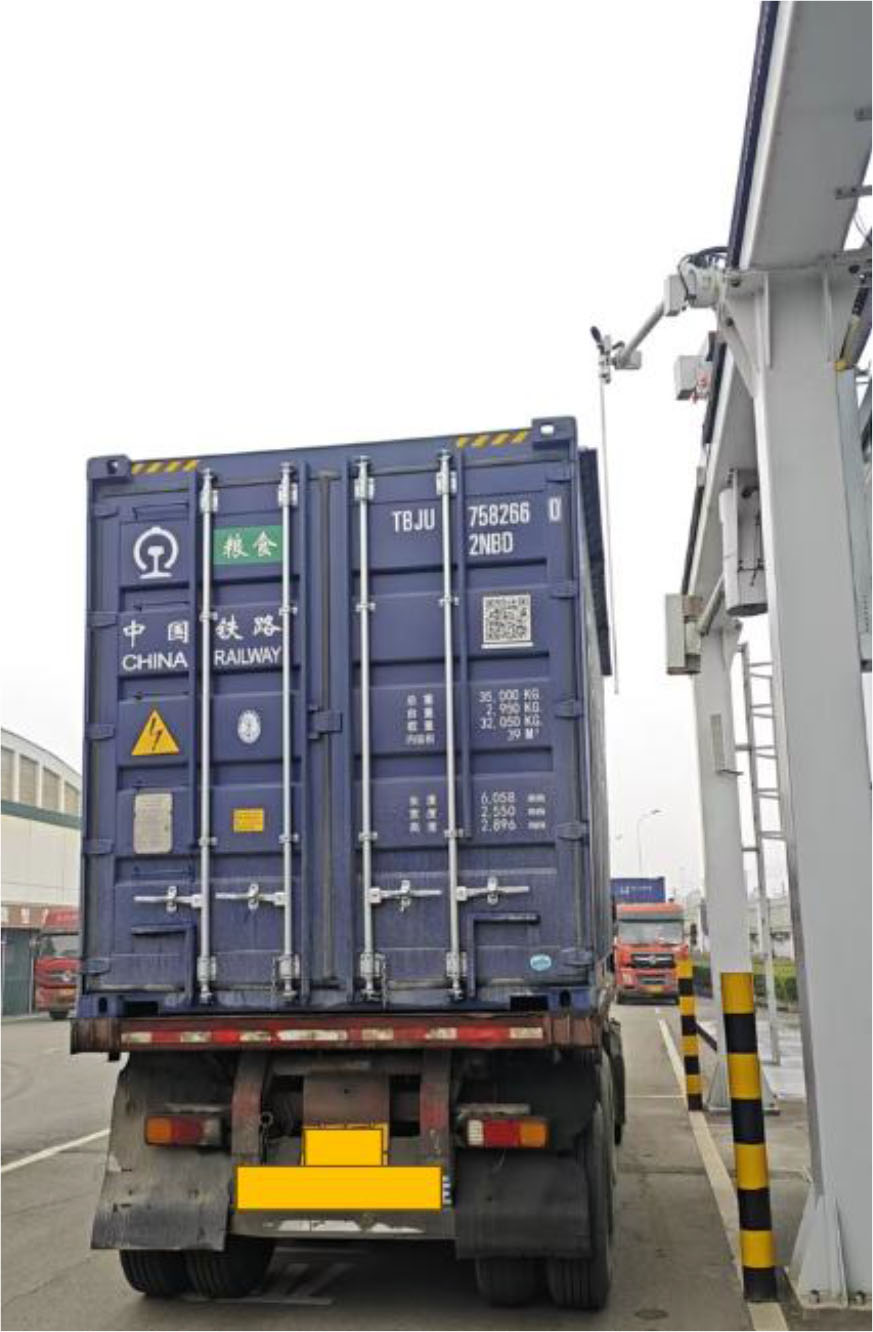
Fig. 7.
Application of the measurement system.
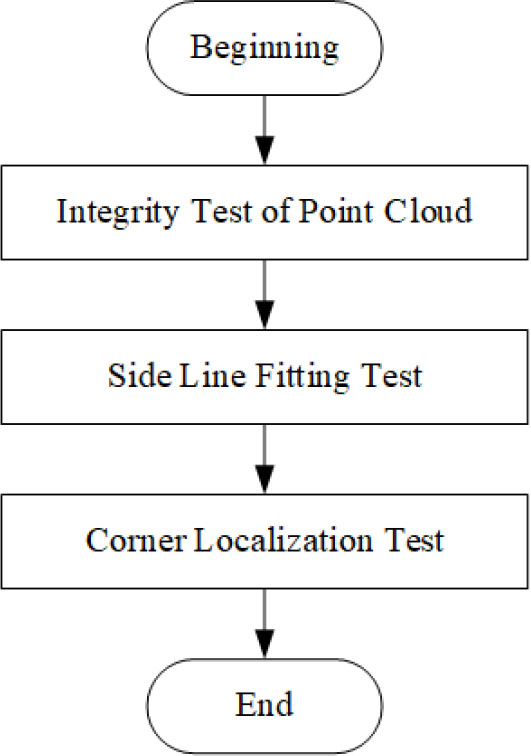
Fig. 8.
Traceability measurement.
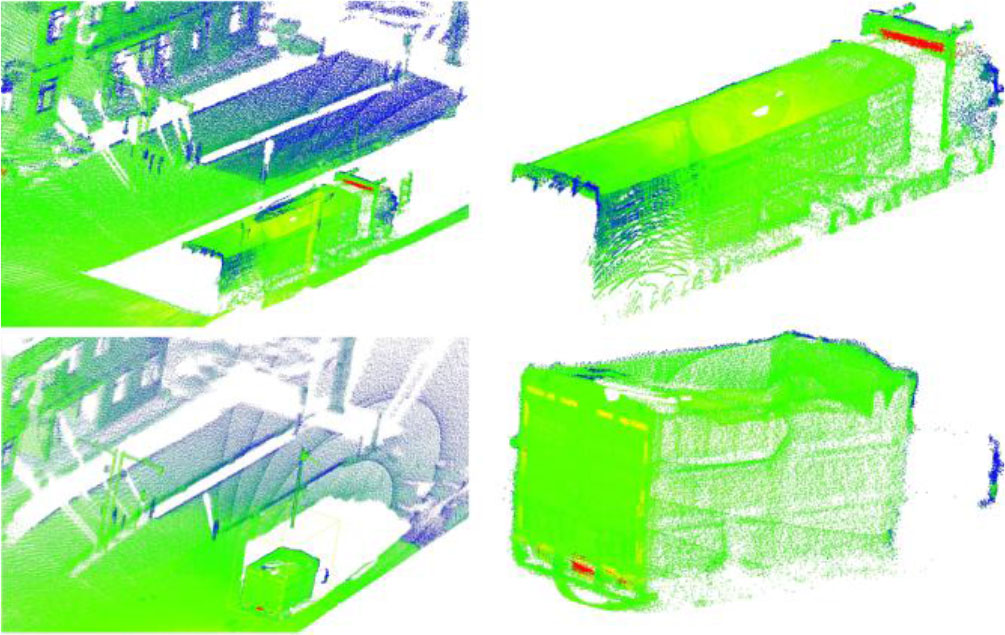
Fig. 9.
Original (left) and segmented (right) truck point cloud.
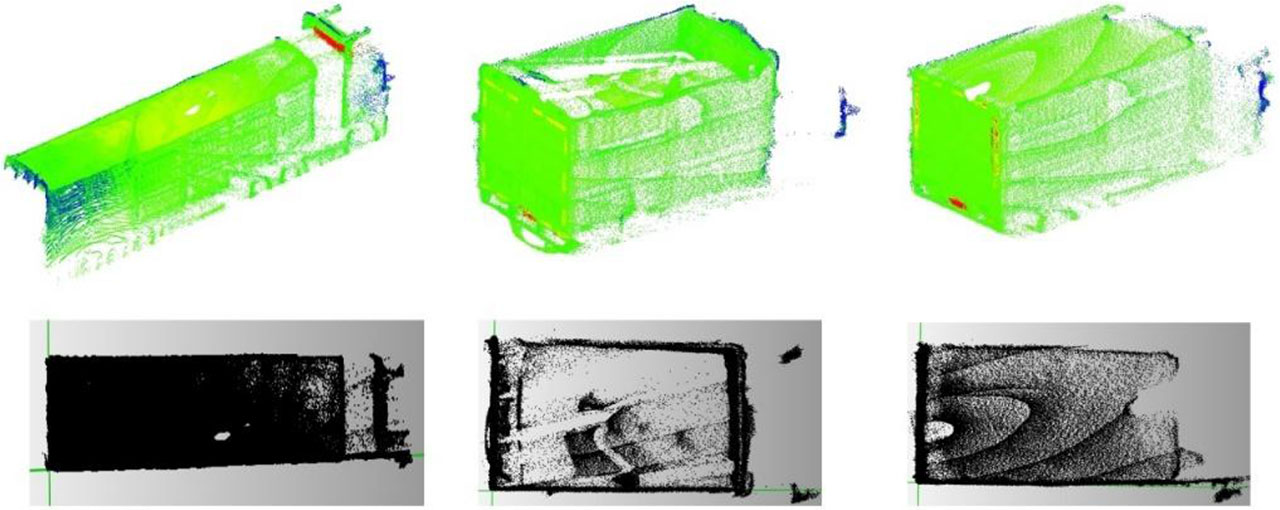
Fig. 10.
Original points of the grain truck (top) and corresponding projected points (bottom).
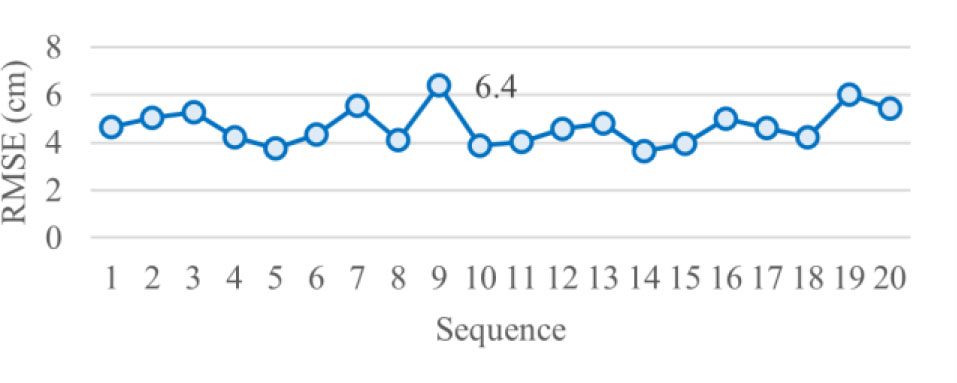
Fig. 11.
Side line fitting error distribution.
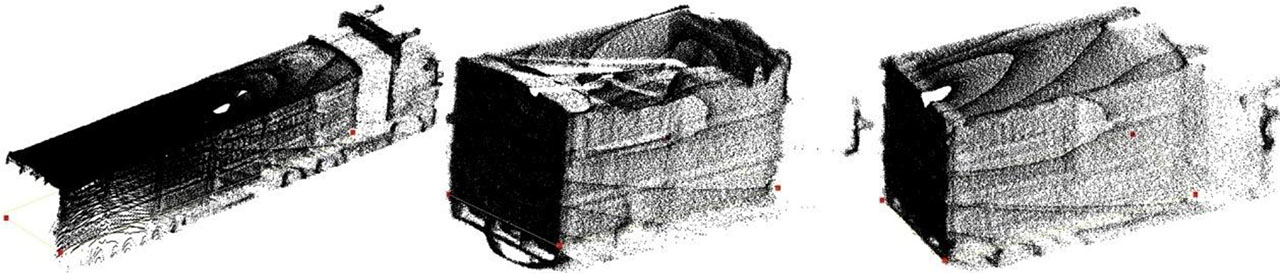
Fig. 12.
Corner localization.
Table 1.
Dimensions of trucks.
| Truck ID | 1 | 2 | 3 | 4 | 5 | 6 | 7 | 8 | 9 | 10 |
|---|---|---|---|---|---|---|---|---|---|---|
| Width [cm] | 254.4 | 257.3 | 255.2 | 257.1 | 255.5 | 255.1 | 258.3 | 212.5 | 213.1 | 213.7 |
| Length [cm] | 1295.8 | 1301.9 | 1297.0 | 1298.6 | 1298.2 | 1295.3 | 1301.5 | 392.6 | 393.0 | 393.3 |
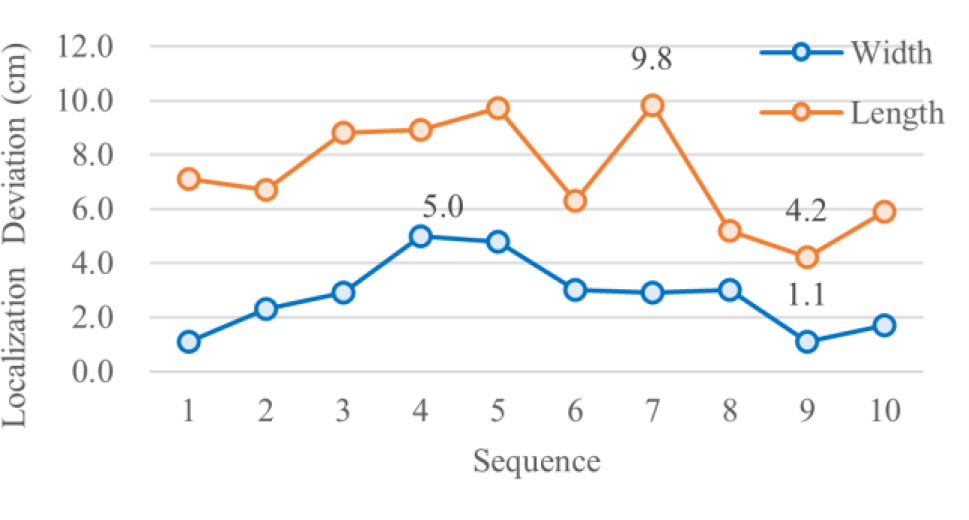
Fig. 13.
Localization deviation.
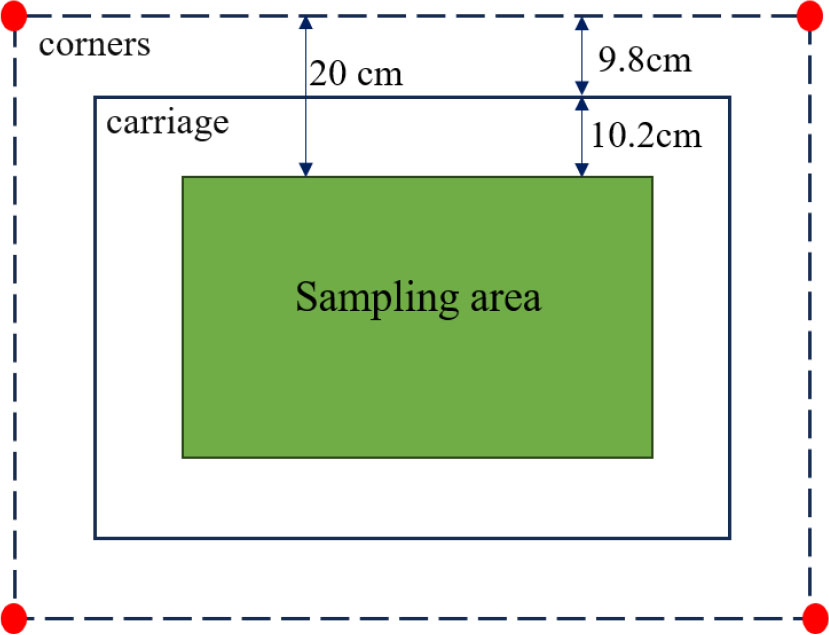
Fig. 14.
Sample points are inside the carriage.