

Fig. 1.
Conversion of analog to digital signal.
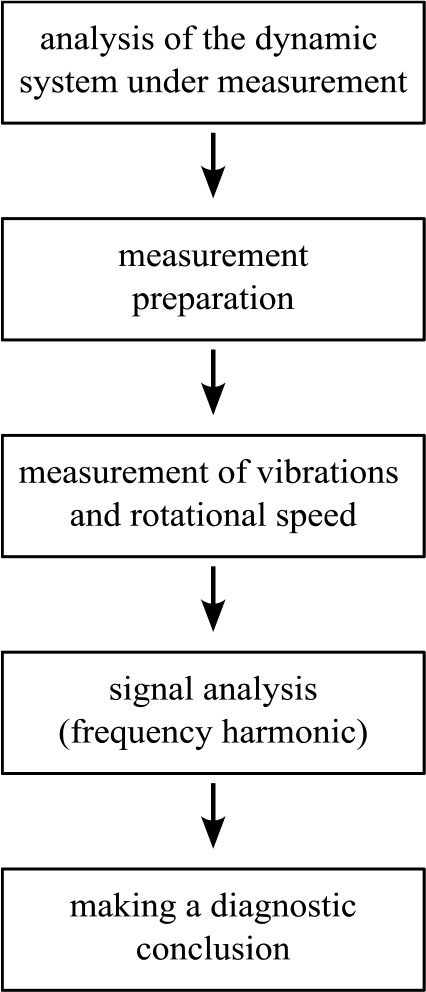
Fig. 2.
Block diagram of the vibration diagnostic method.
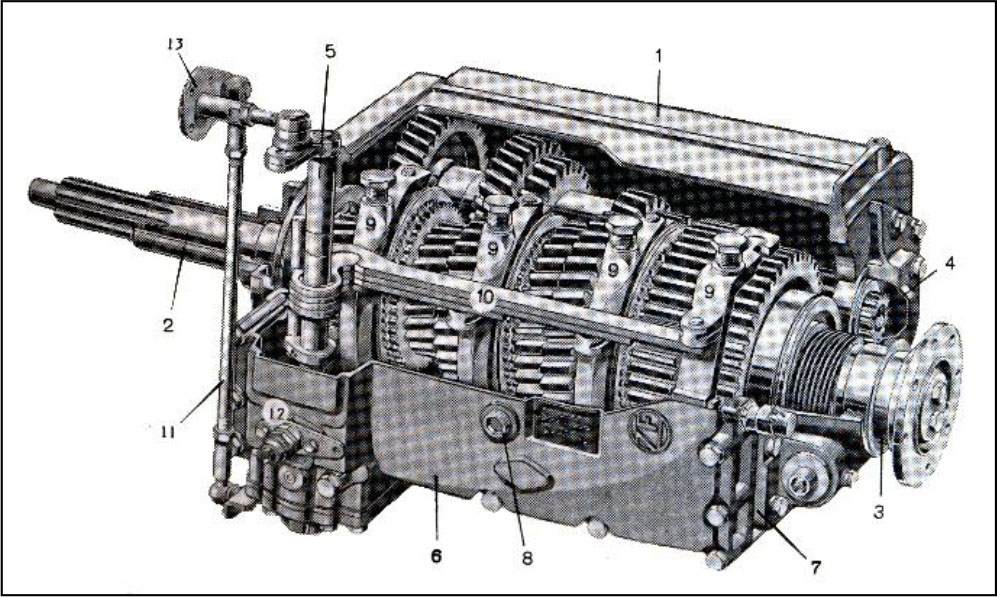
Fig. 3.
Gearbox type 6MS 80: 1 – gearbox housing, 2 – input shaft, 3 – exit shaft, 4 – intermediate shaft, 5 – shaft for gear engagement, 6 – side cover, 7 – back cover, 8 – oil filler cap, 9 – forks, 10 – longitudinal fork support, 11 – pusher, 12 – carrier, 13 – flange.
Table 1.
6MS 80.P28 gearbox main characteristics.
| Gear | I | II | III | IV | V | VI |
|---|---|---|---|---|---|---|
| Couple | 50/12 | 36/15 | 32/22 | 26/27 | 24/36 | 19/41 |
| Gear ratio | 9 | 5.18 | 3.14 | 2.08 | 1.44 | 1 |
| ωout [rpm] | 222 | 386 | 637 | 962 | 1389 | 2000 |
| fout [Hz] | 3.7 | 6.4 | 10.6 | 16 | 23.15 | 33.3 |
| Gm [rpm/Hz] | 11100/185 | 13896/230 | 20381/340 | 25000/417 | 33336/556 | 38000/634 |
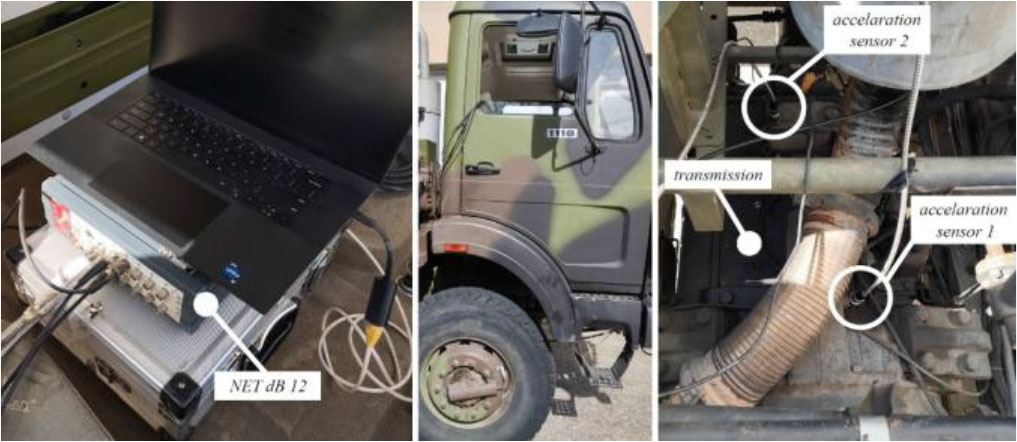
Fig. 4.
Measurement device and vehicle FAP 1118, 4×4.
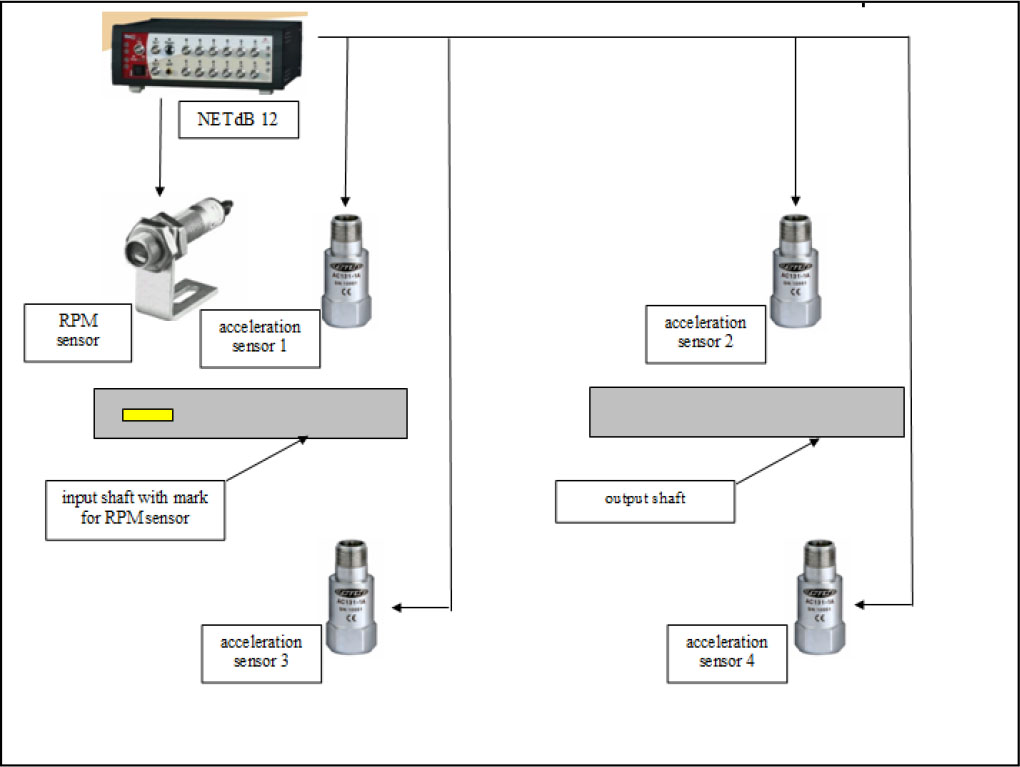
Fig. 5.
Measurement chain diagram for vibration measurement on a vehicle gearbox.
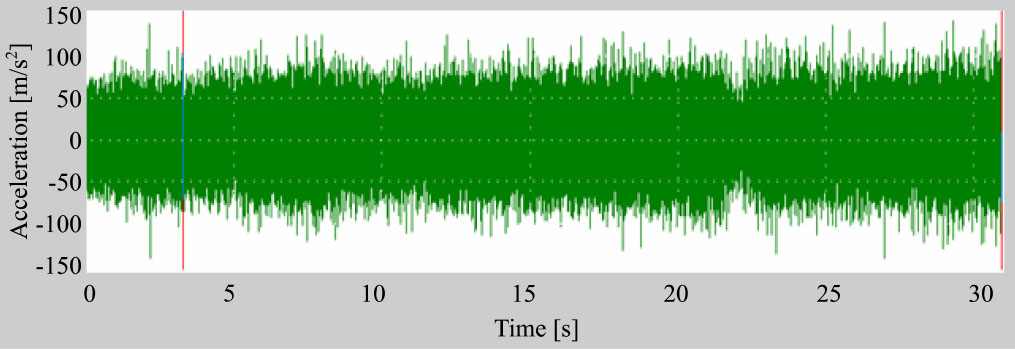
Fig. 6.
The acceleration signal over time, for third gear ratio, accelerometer 1.
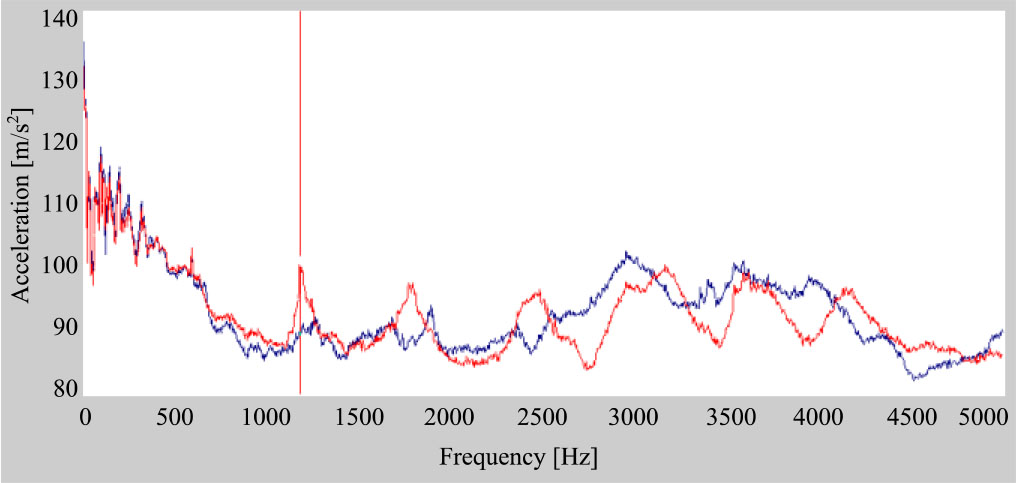
Fig. 7.
Frequency spectrum, sensors 1 and 4.
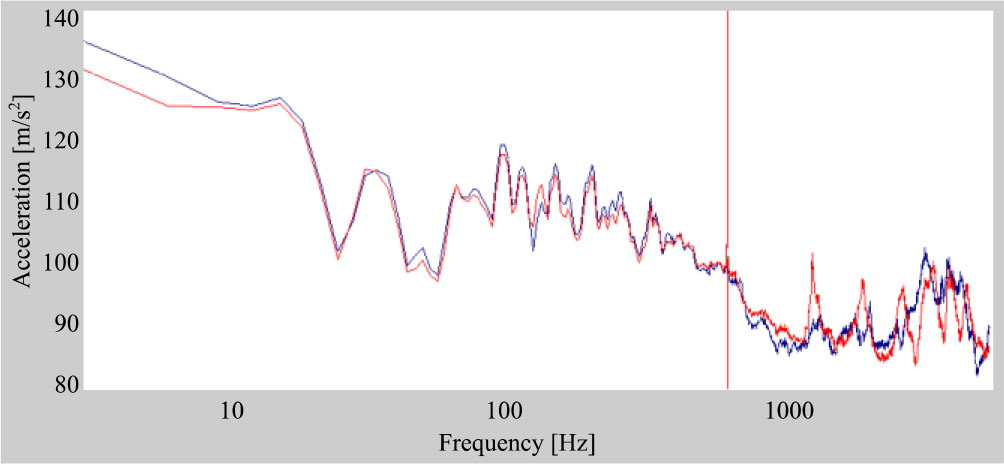
Fig. 8.
Logarithm of frequency spectrum, sensors 1 and 4.
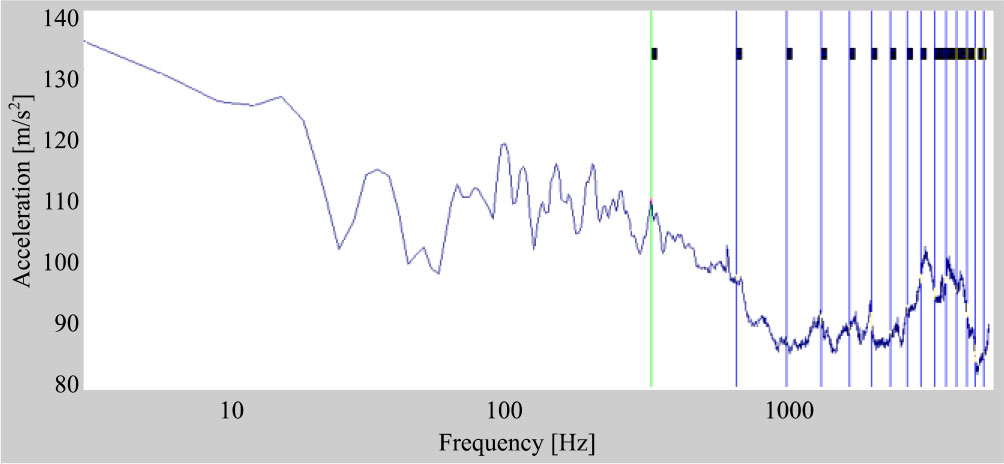
Fig. 9.
Logarithm of the harmonics from gear mesh frequencies.
Table 2.
Third gear harmonics of conjunction frequency values.
| Harmonic | Frequency [Hz] | Level [m/s2] |
|---|---|---|
| 1 | 318.8 | 110.1 |
| 2 | 637.5 | 96.9 |
| 3 | 956.3 | 87.0 |
| 4 | 1275.0 | 90.5 |
| 5 | 1593.8 | 88.6 |
| 6 | 1912.5 | 90.2 |
| 7 | 2231.3 | 88.0 |
| 8 | 2550.0 | 93.0 |
| 9 | 2868.8 | 97.9 |
| 10 | 3187.5 | 95.1 |
| 11 | 3506.3 | 97.0 |
| 12 | 3825.0 | 95.5 |
| 13 | 4143.8 | 93.1 |
| 14 | 4462.5 | 85.3 |
| 15 | 4781.3 | 85.2 |
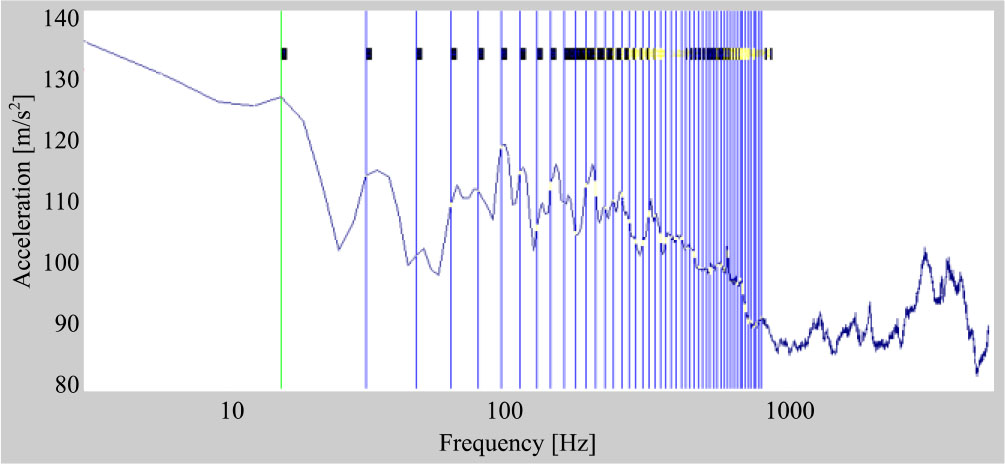
Fig. 10.
Intermediate shaft speed harmonics.
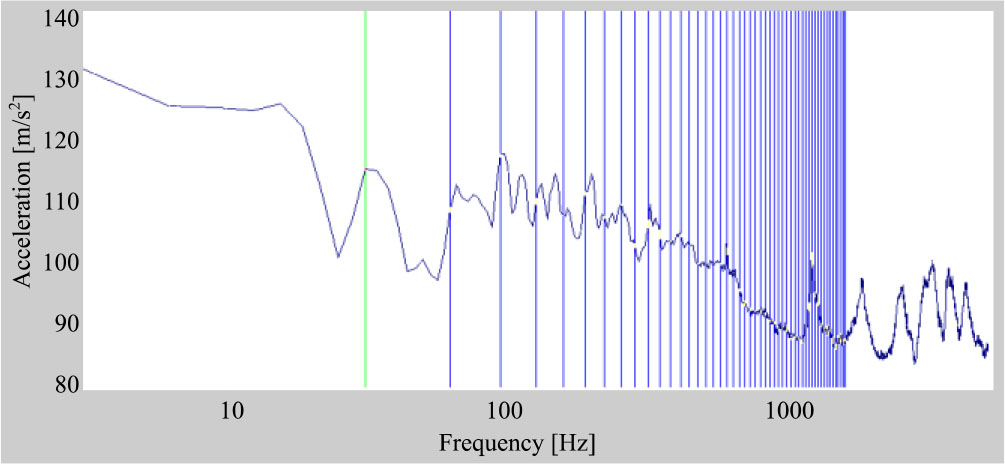
Fig. 11.
Input shaft speed harmonics.
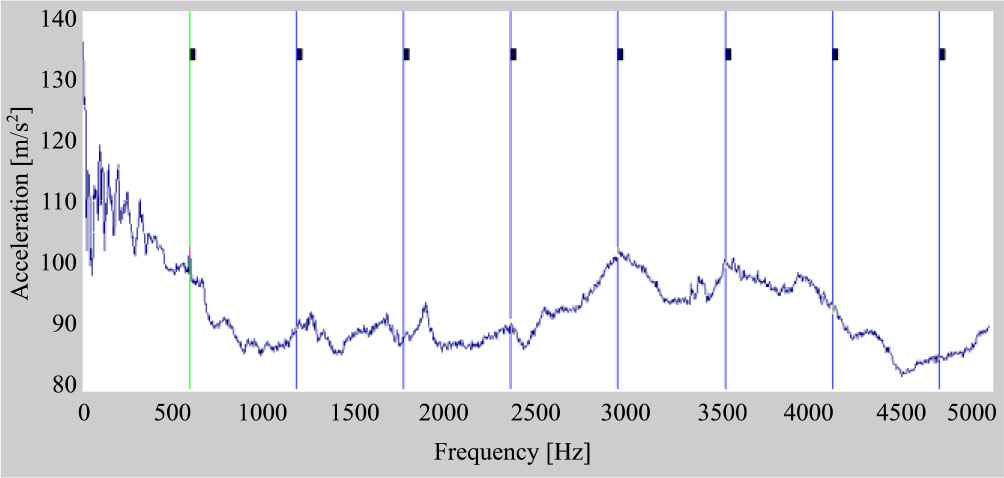
Fig. 12.
Harmonics of the gear mesh frequency of permanent gears.
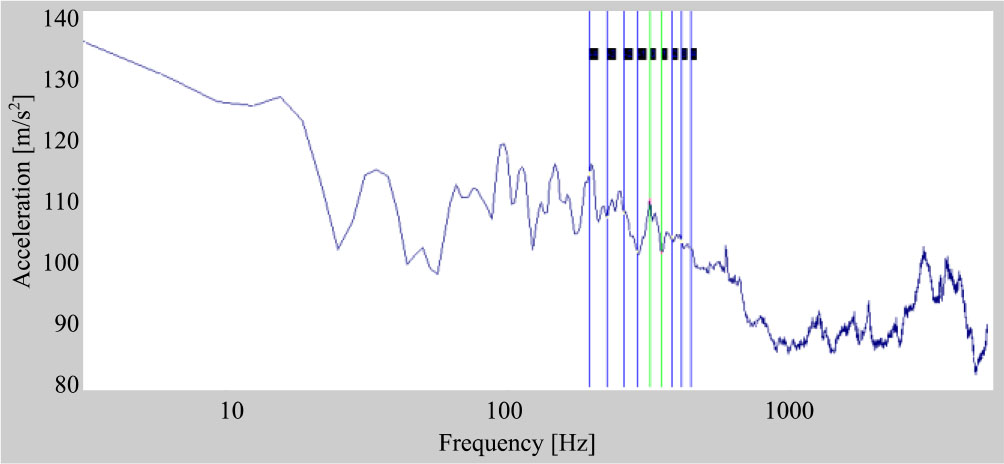
Fig. 13.
Sidebands around the third gear mesh frequency.
Table 3.
Sideband level around the gear mesh frequency of the third gear ratio.
| Harmonic | Frequency [Hz] | Level [m/s2] |
|---|---|---|
| −4 | 318.8 | 110.1 |
| −3 | 637.5 | 96.9 |
| −2 | 956.3 | 87.0 |
| −1 | 1275.0 | 90.5 |
| 0 | 1593.8 | 88.6 |
| 1 | 1912.5 | 90.2 |
| 2 | 2231.3 | 88.0 |
| 3 | 2550.0 | 93.0 |
| 4 | 2868.8 | 97.9 |
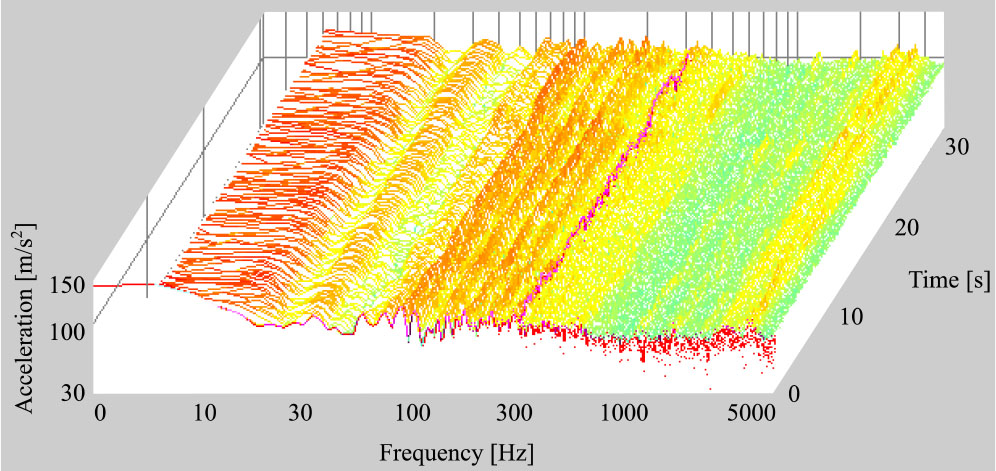
Fig. 14.
Waterfall diagram of the signal from sensor 4.
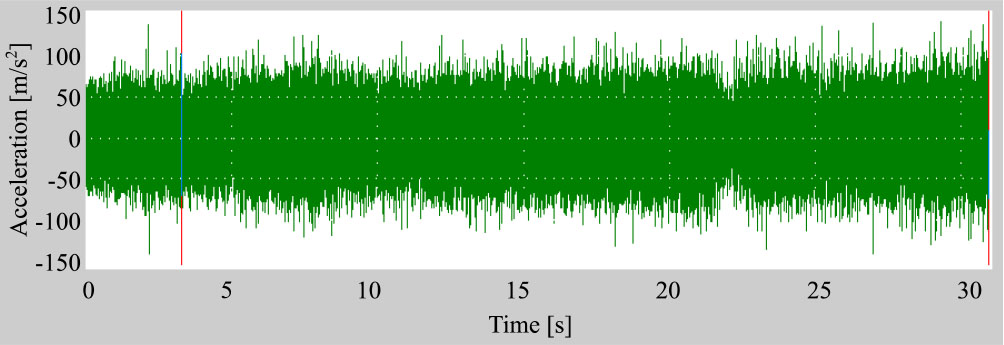
Fig. 15.
The acceleration signal over time, third gear ratio, sensor 1, test 1.
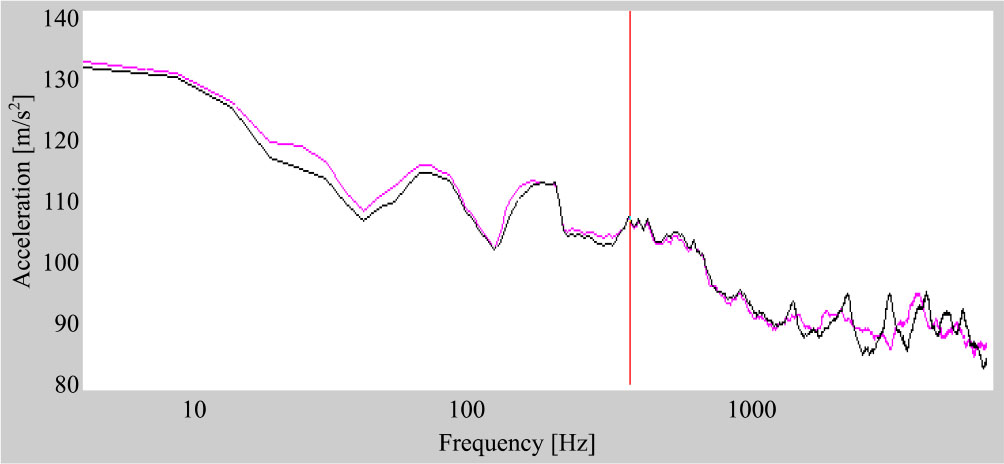
Fig. 16.
Comparative logarithmic representation of the frequency spectrum, sensors 1 and 4.
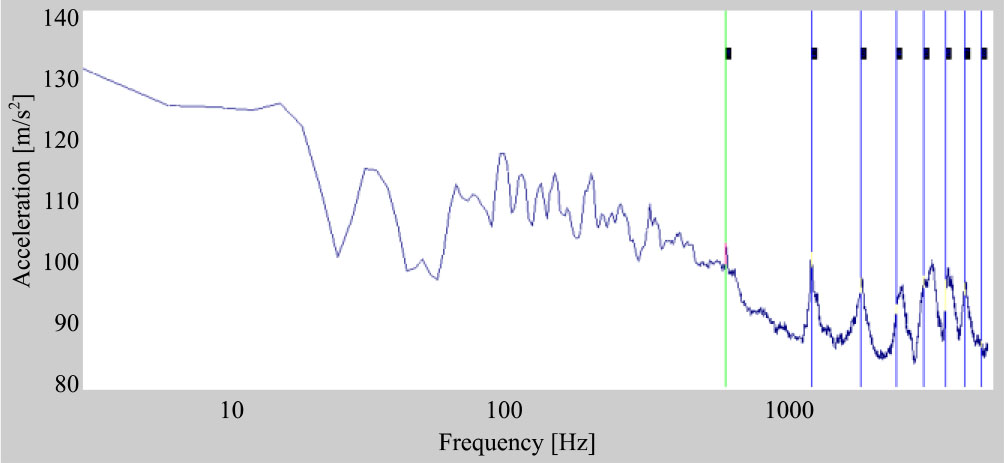
Fig. 17.
Gear coupling frequency harmonics in constant coupling on the intermediate shaft.
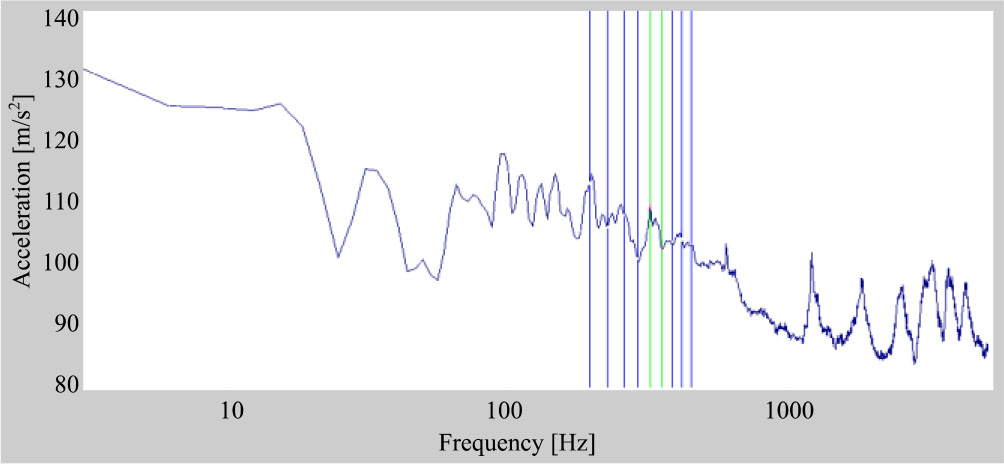
Fig. 18.
Sidebands around the gear mesh frequency.
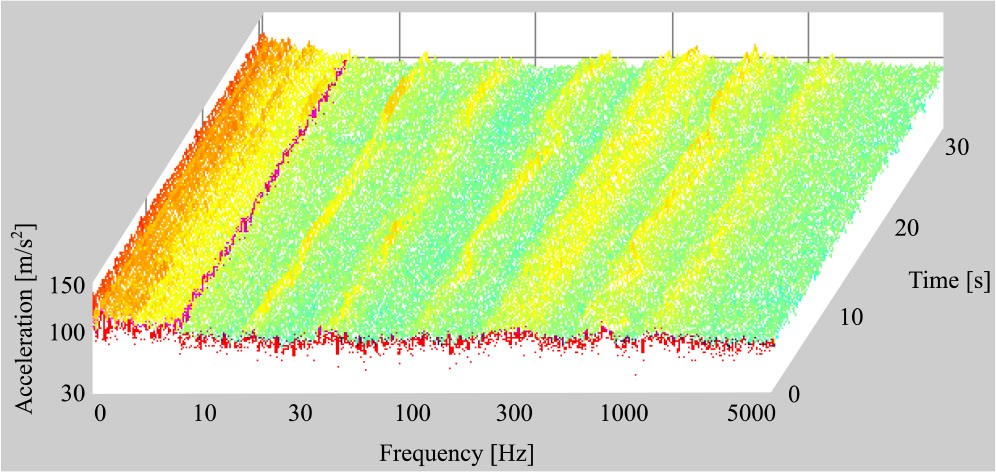
Fig. 19.
Waterfall diagram, sensor 1, test 1.
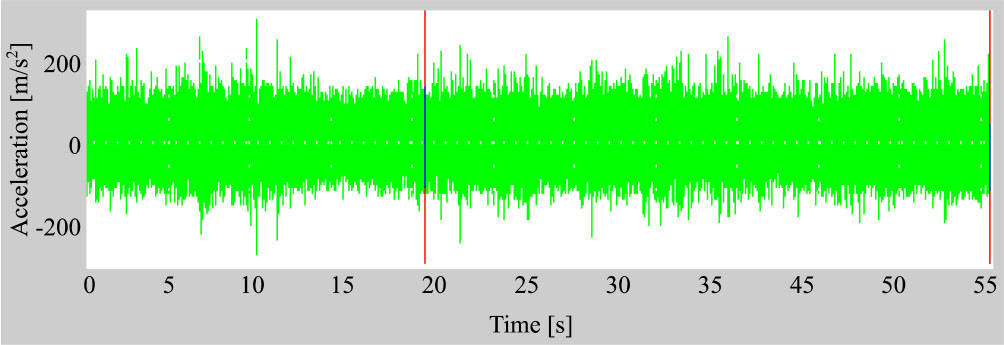
Fig. 20.
Acceleration signal in time, sensors 1.
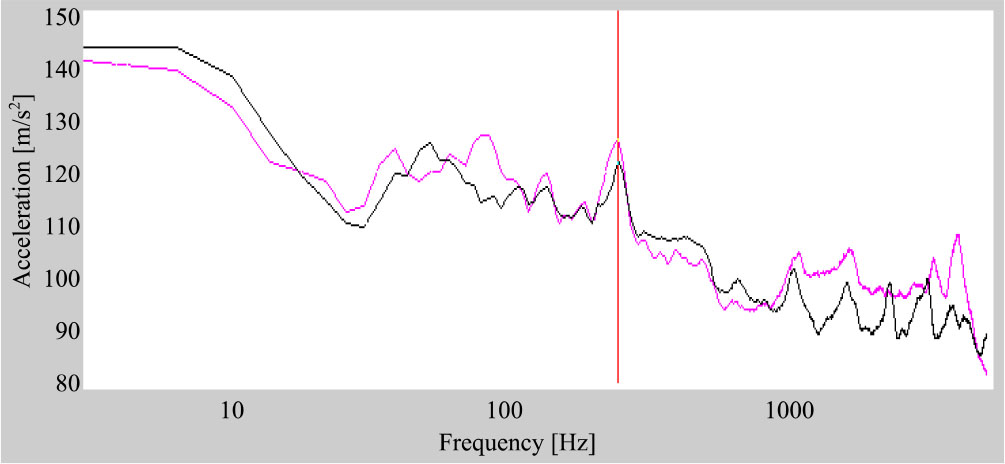
Fig. 21.
The logarithm of the frequency spectrum, sensors 1 and 4, test 2.
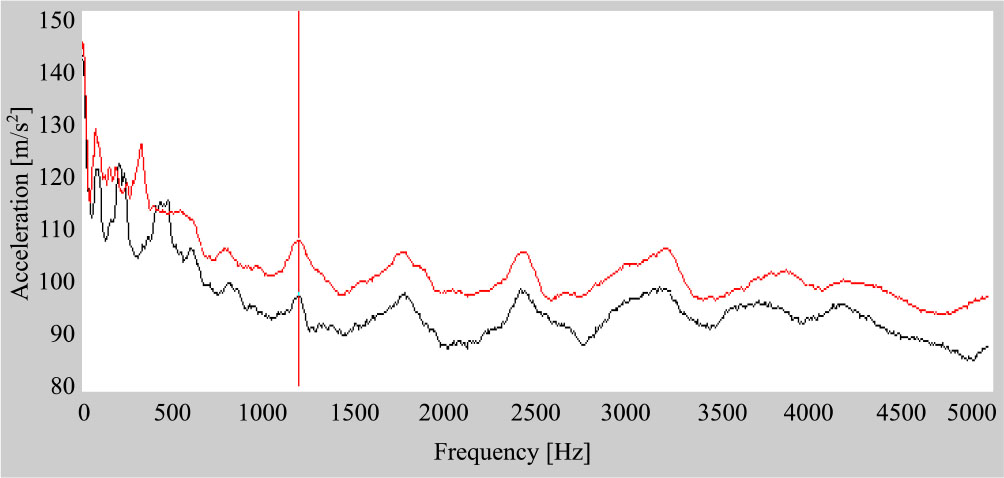
Fig. 22.
Comparative frequency spectrum, test 1 and test 2, sensor 4.
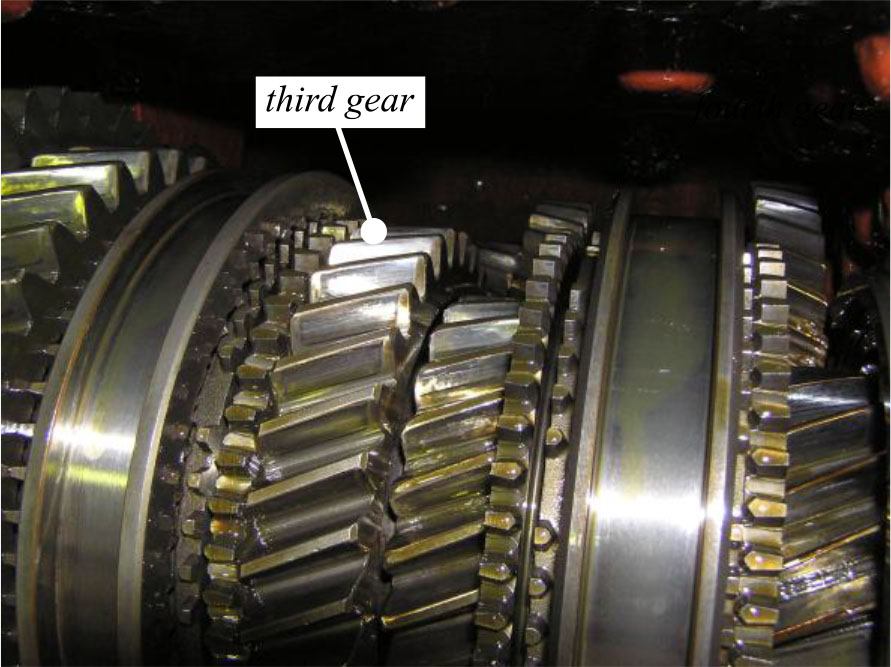
Fig. 23.
The gear in third gear ratio of the gearbox on the output shaft.
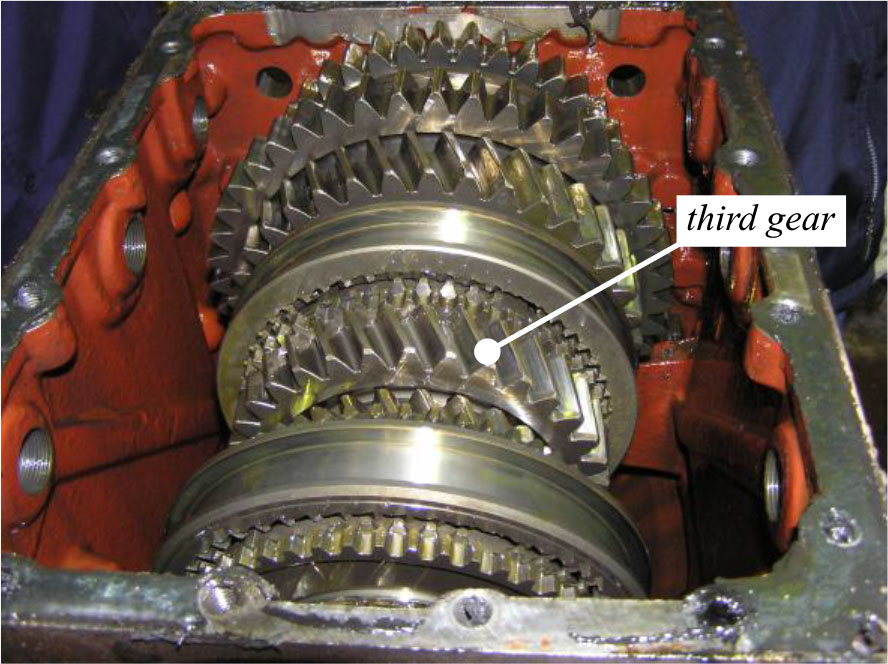
Fig. 24.
The gear in third gear ratio of the gearbox after tests.