
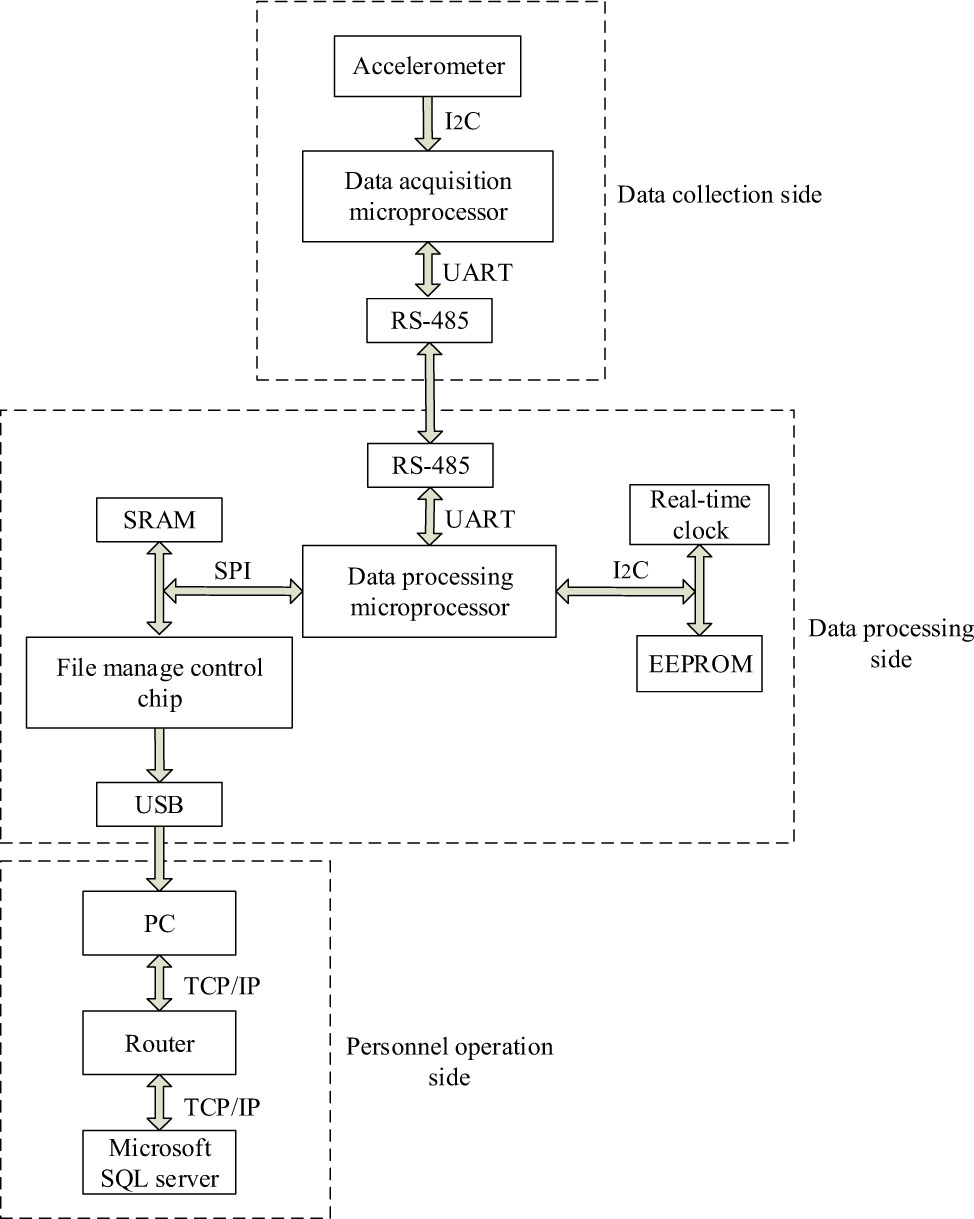
Fig. 1.
System structure.
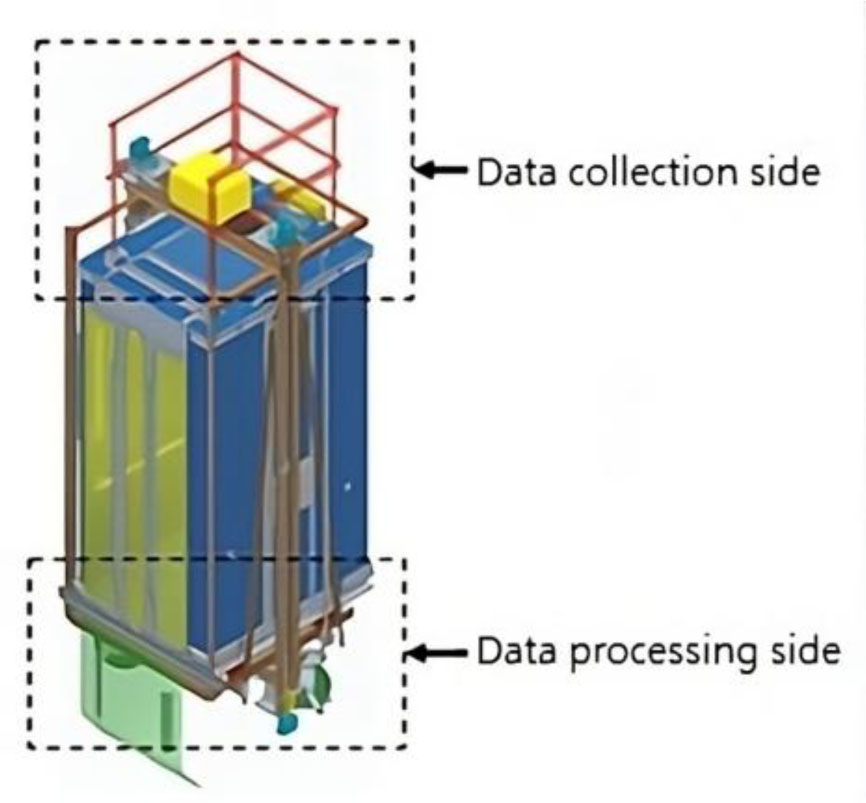
Fig. 2.
System hardware installation.

Fig. 3.
Model processing.
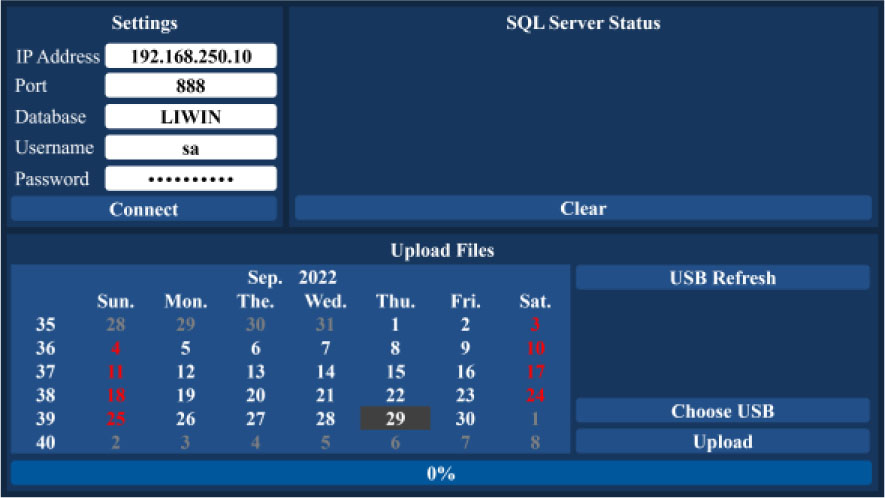
Fig. 4.
Main front panel of data transmission.
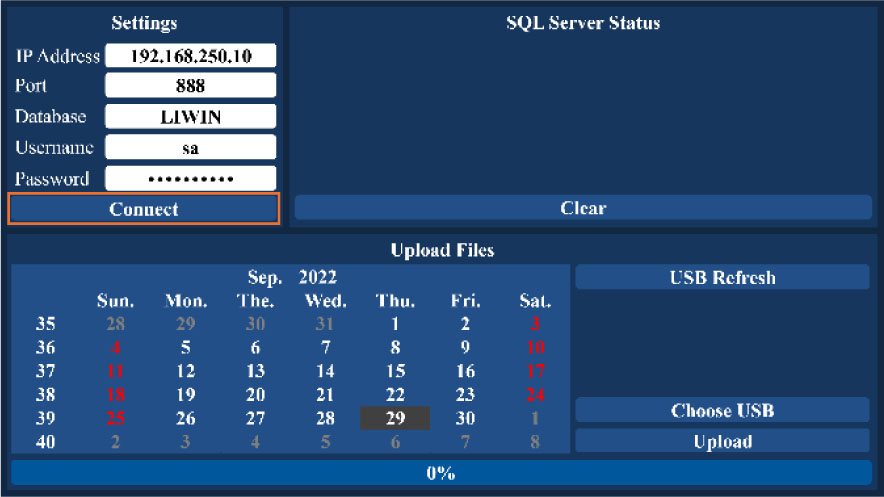
Fig. 5.
Connection with server.
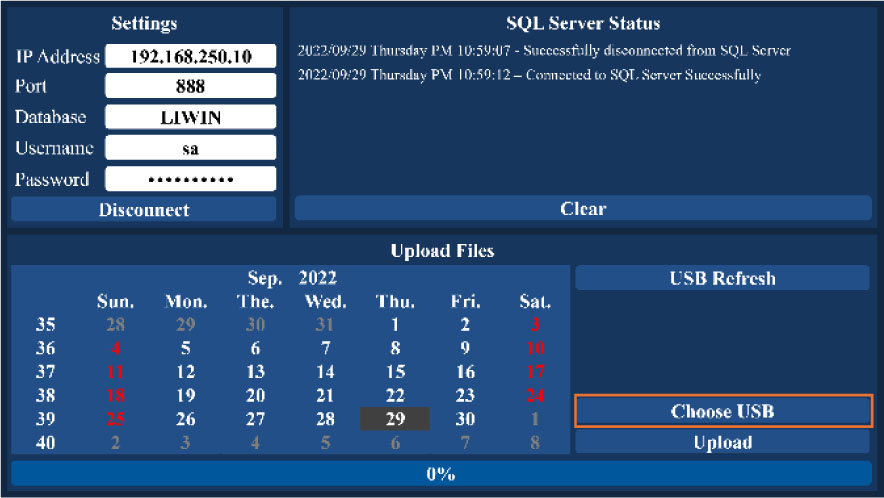
Fig. 6.
Selection of USB.
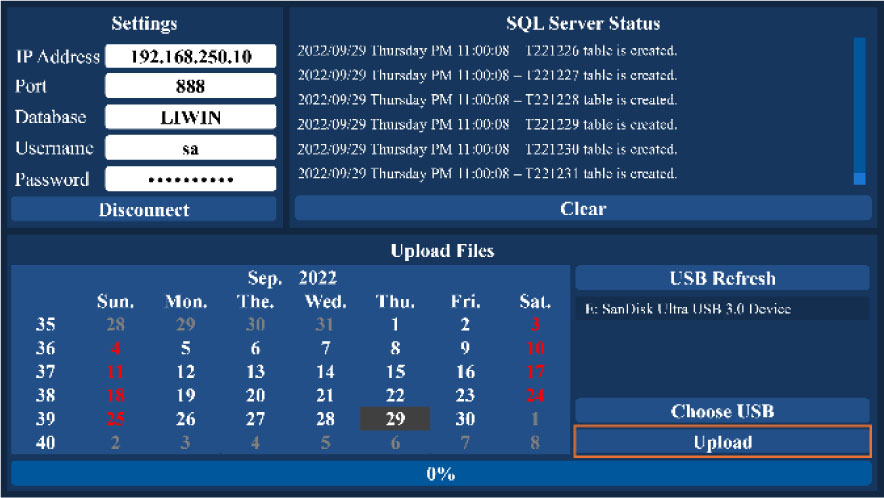
Fig. 7.
File upload.
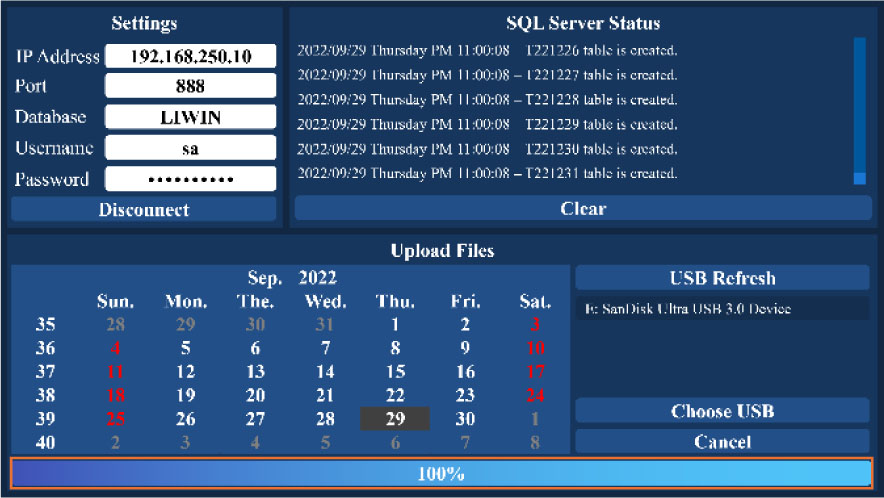
Fig. 8.
File uploading progress.
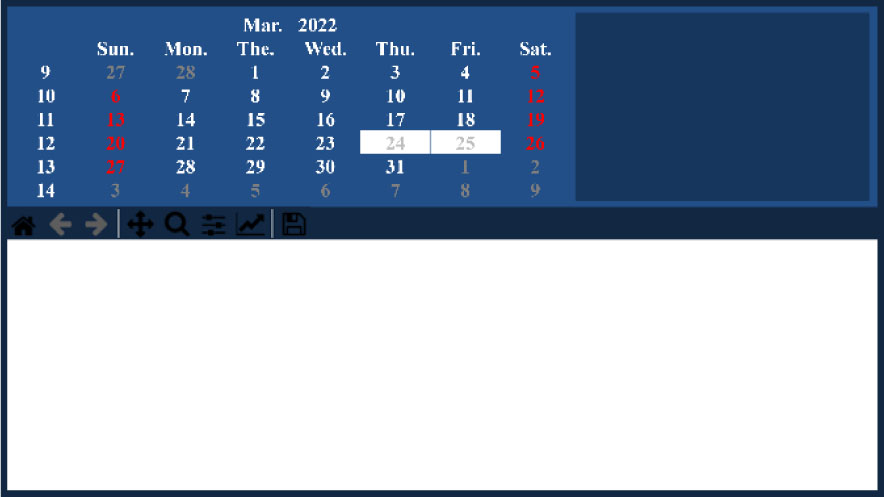
Fig. 9.
Server front panel.
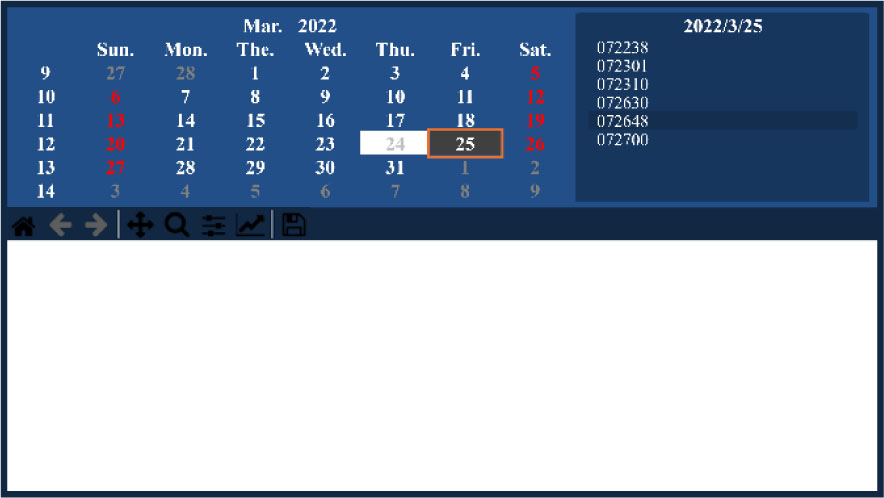
Fig. 10.
Selection of desired date.
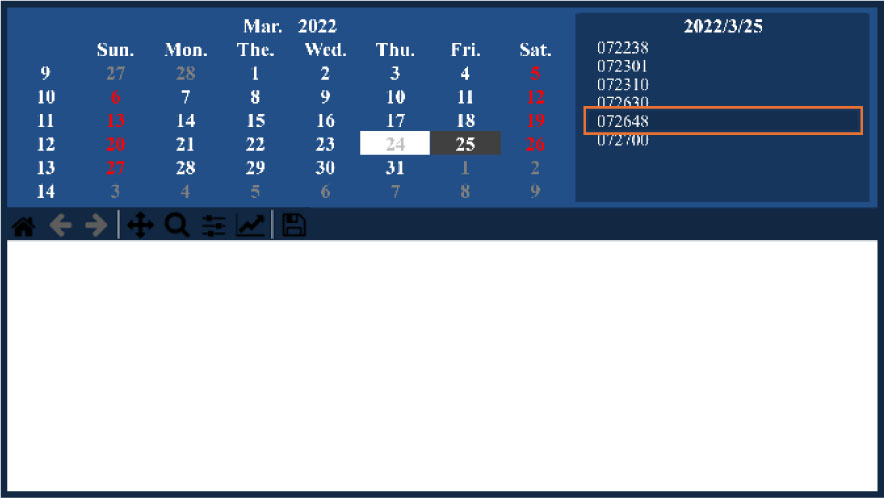
Fig. 11.
Selection of desired file.
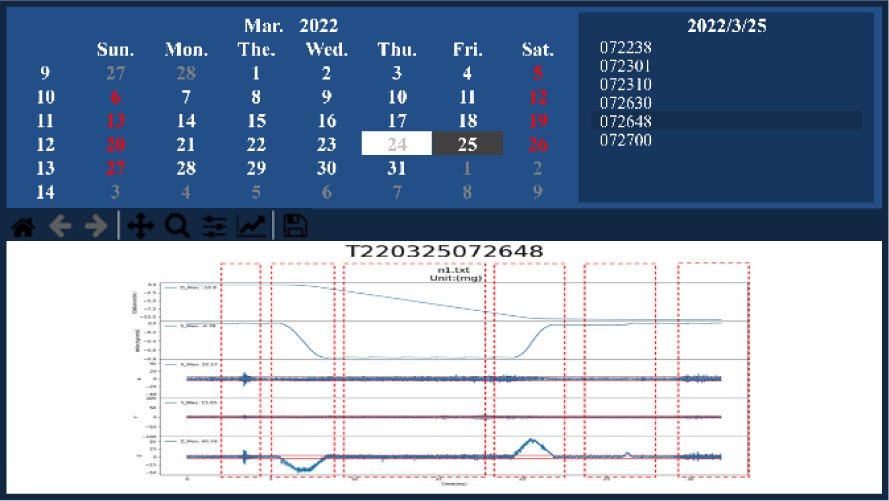
Fig. 12.
Display of vibration data.
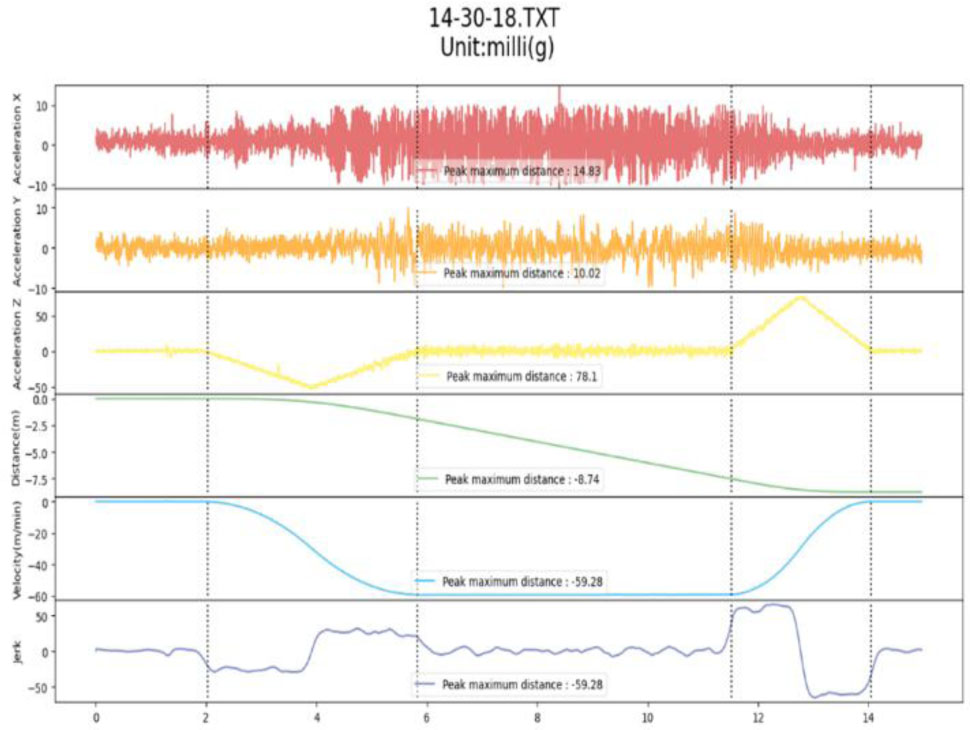
Fig. 13.
Normal elevator operation within three floors.
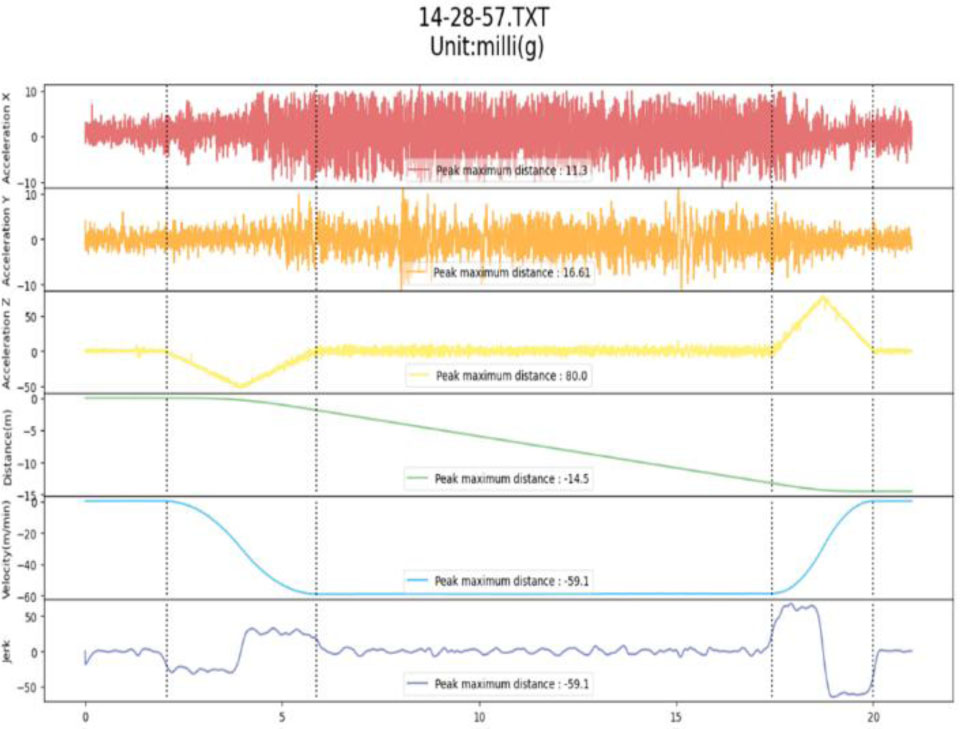
Fig. 14.
Normal elevator operation within four floors.
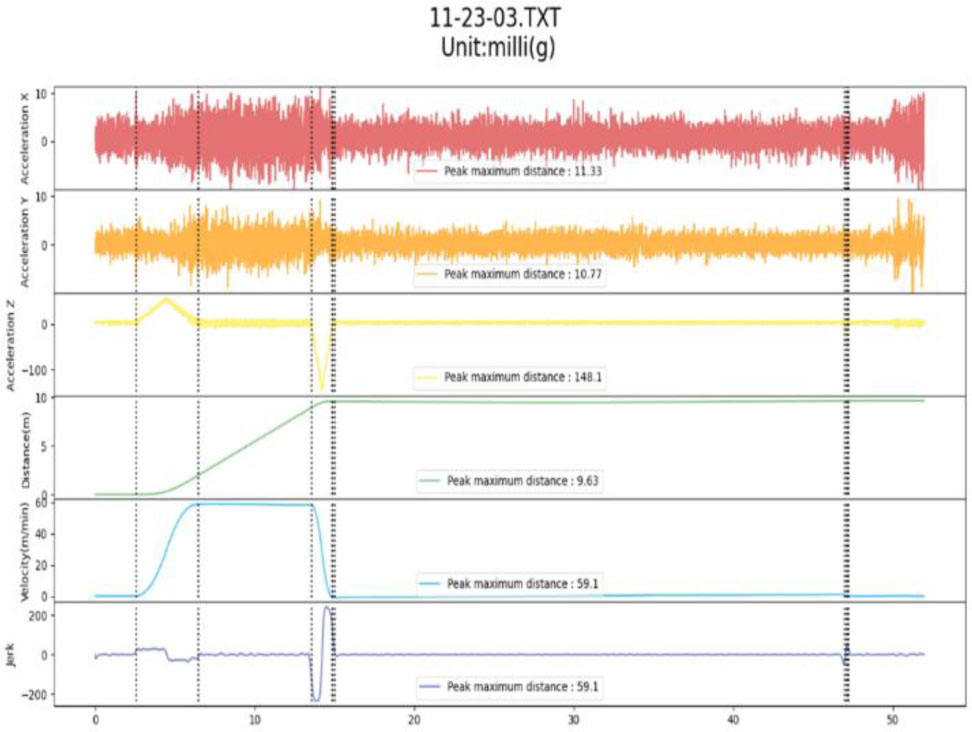
Fig. 15.
Abnormal elevator operation with six segments.
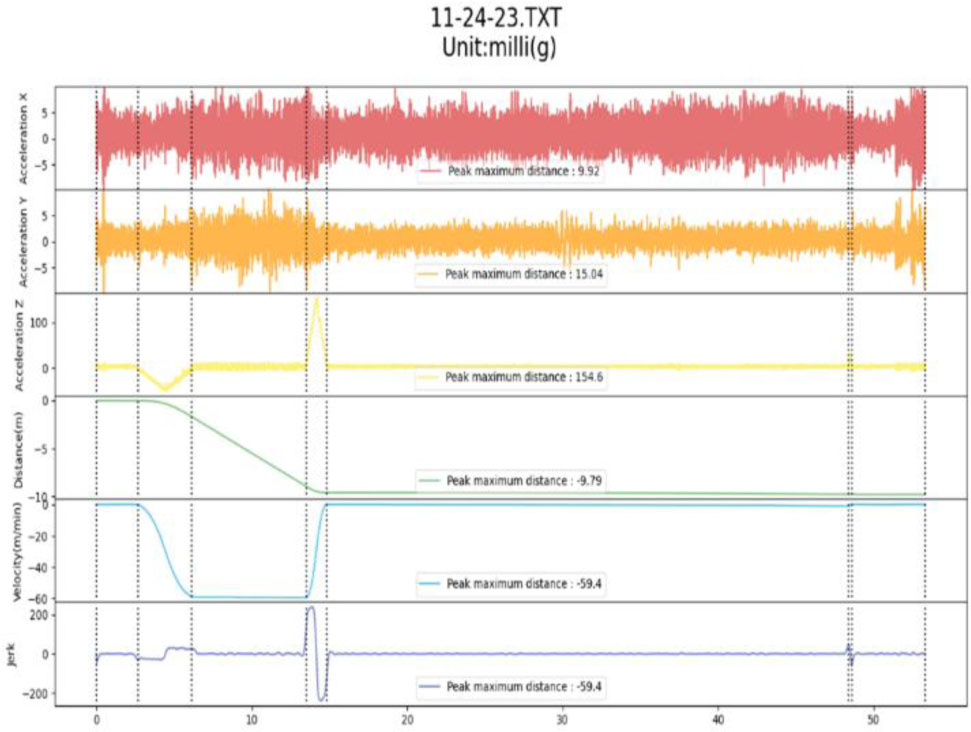
Fig. 16.
Abnormal elevator operation with nine segments.
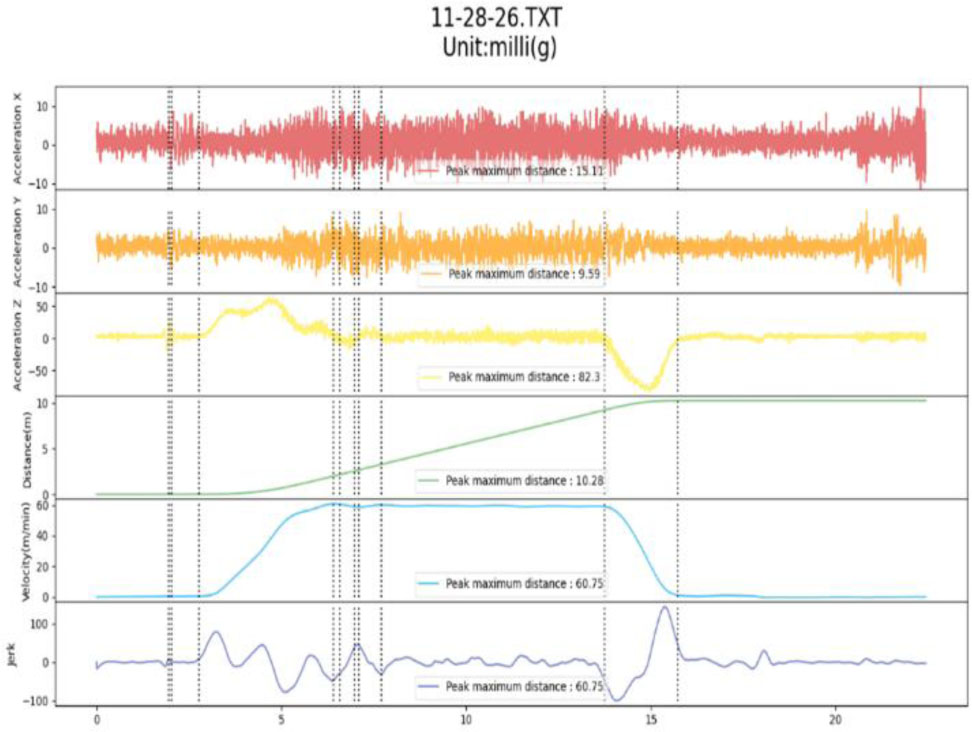
Fig. 17.
Abnormal elevator operation with eleven segments.
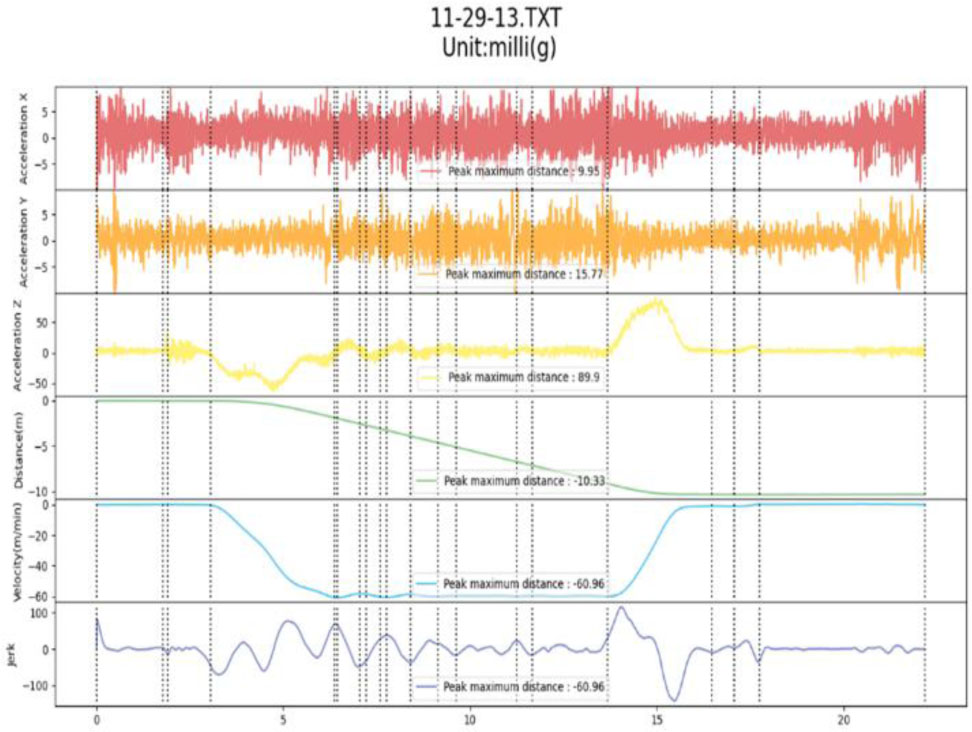
Fig. 18.
Abnormal elevator operation with twenty-one segments.
Table 2.
Comparison between EVA625 and the proposed system.
| Item | EVA-625 | The proposed system |
|---|---|---|
| Samples per second (sps) | 256 | 1000 |
| Resolution | 0.6 mg | 0.061 mg |
| Storage speed | Slow (15 s) | Fast (10 s) |
| Operation mode | Manual | Automatic |
| Long term record | No | Available |
| Analysis software | Available | Available |
| Installation method | Standalone | Complex |