
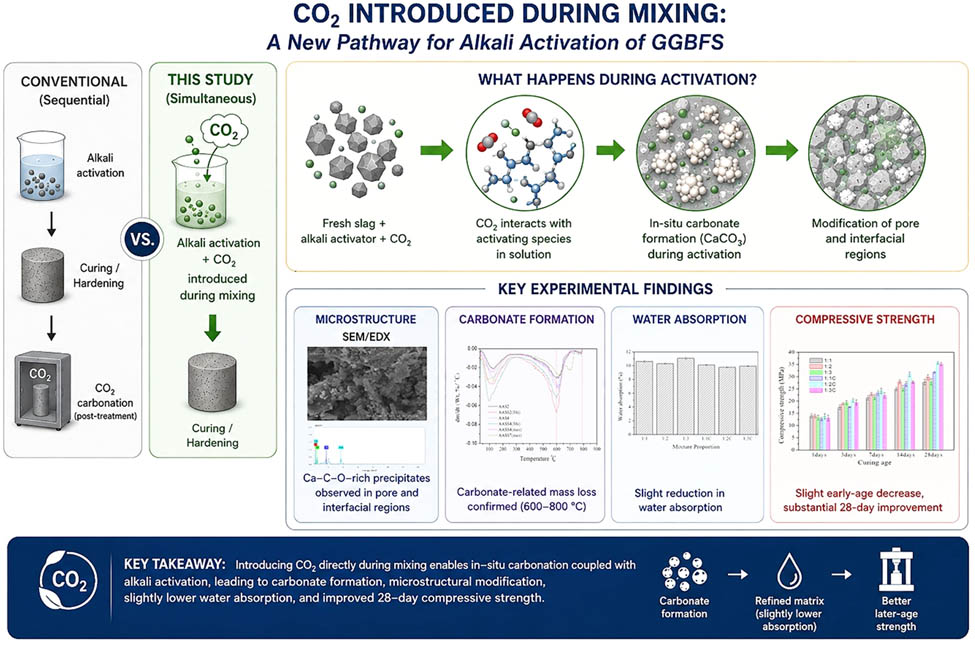
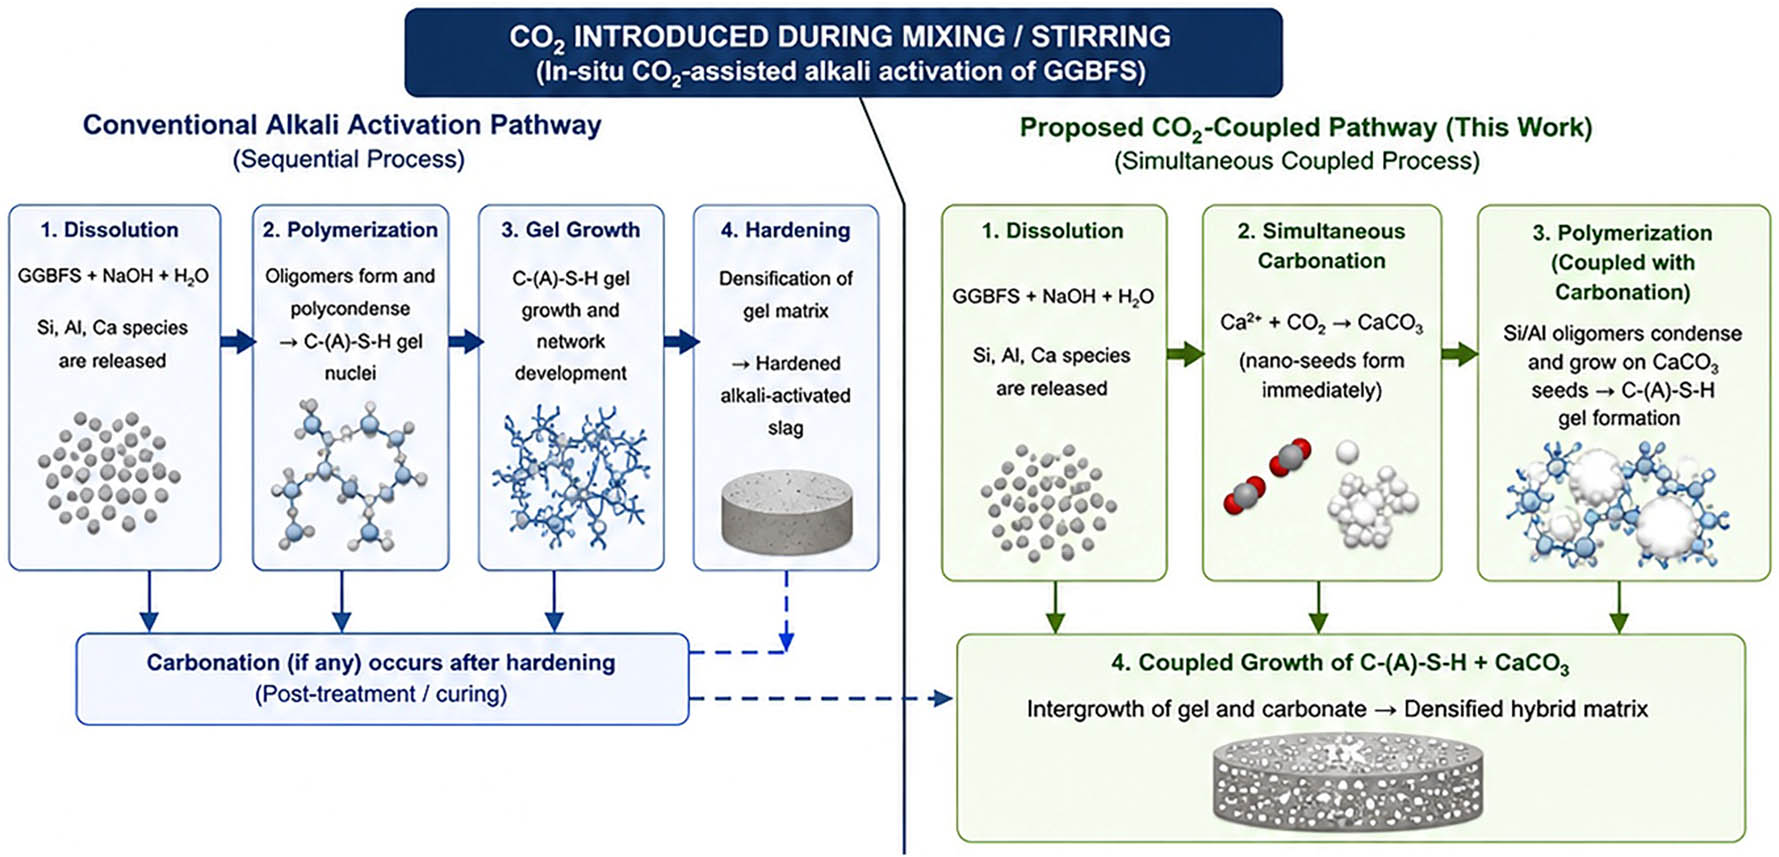
Figure 1
The CCGP method.
Table 1
Chemical composition and physical analysis of precursor materials.
| Chemical composition | Data | Physical analysis | Data | |
|---|---|---|---|---|
| SiO2% | 34.58 | Specific gravity (g/cm3) | 2.90 | |
| Al2O3% | 14.28 | Specific surface area (m2/kg) | 564 | |
| FeO% | 0.50 | Air content of mortar (volume)% | 6.0 | |
| CaO% | 42.75 | Activity index (%) | 7 days | 95 |
| MgO% | 5.92 | 28 days | 139 | |
| SO3% | 0.06 | |||
| Na2O% | 0.253 | |||
| K2O% | 0.432 | |||
| Other% | 1.23 | |||
| Loss on ignition (LOI)% | 0.28 | |||
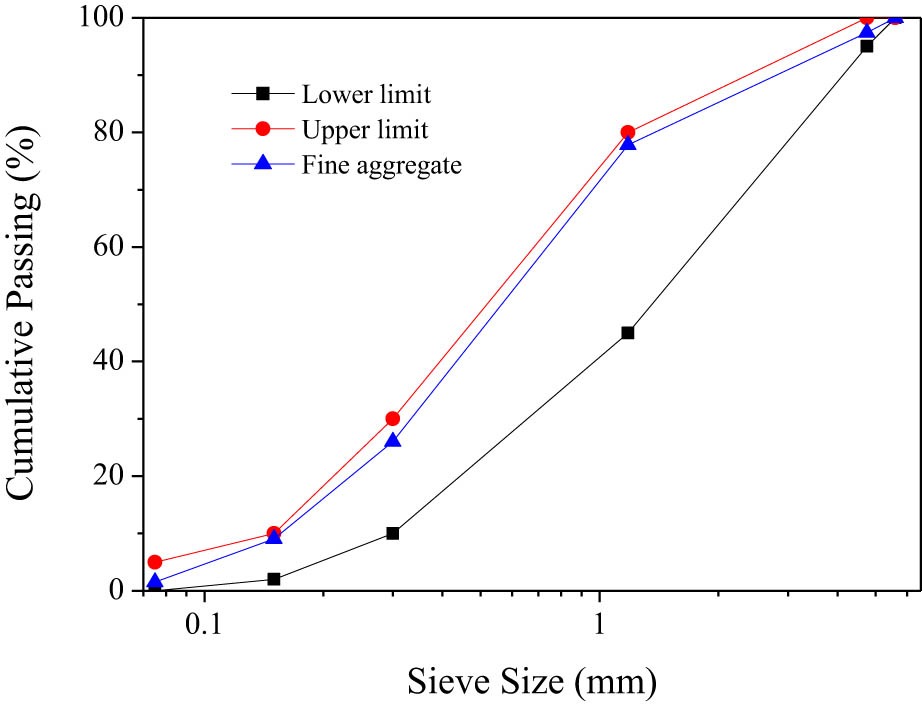
Figure 2
Particle size distribution curve of fine aggregate.
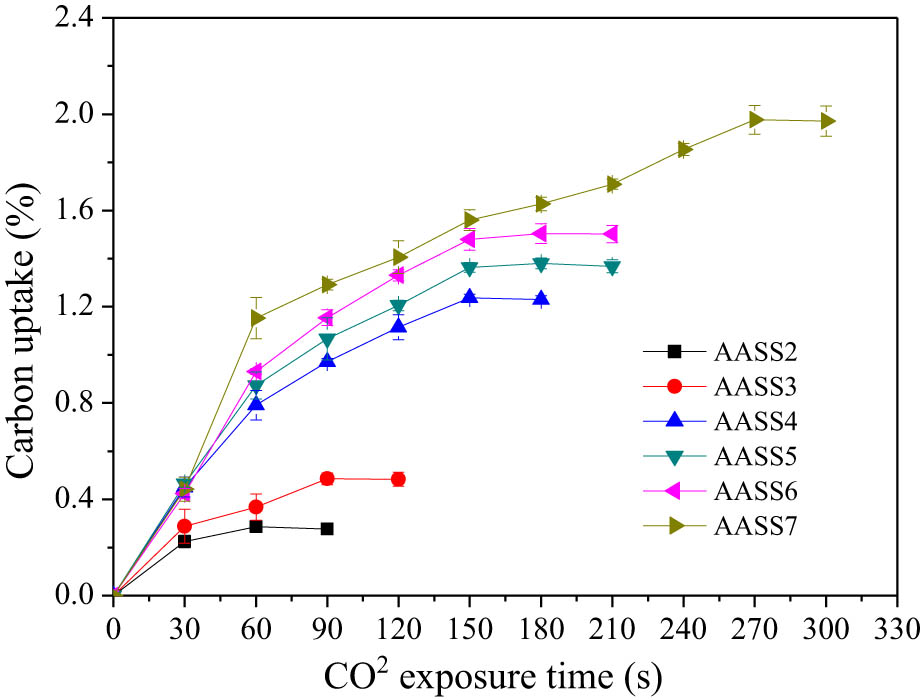
Figure 3
Relationship between CO2 fixation amount and mixing time under different alkali equivalent conditions.
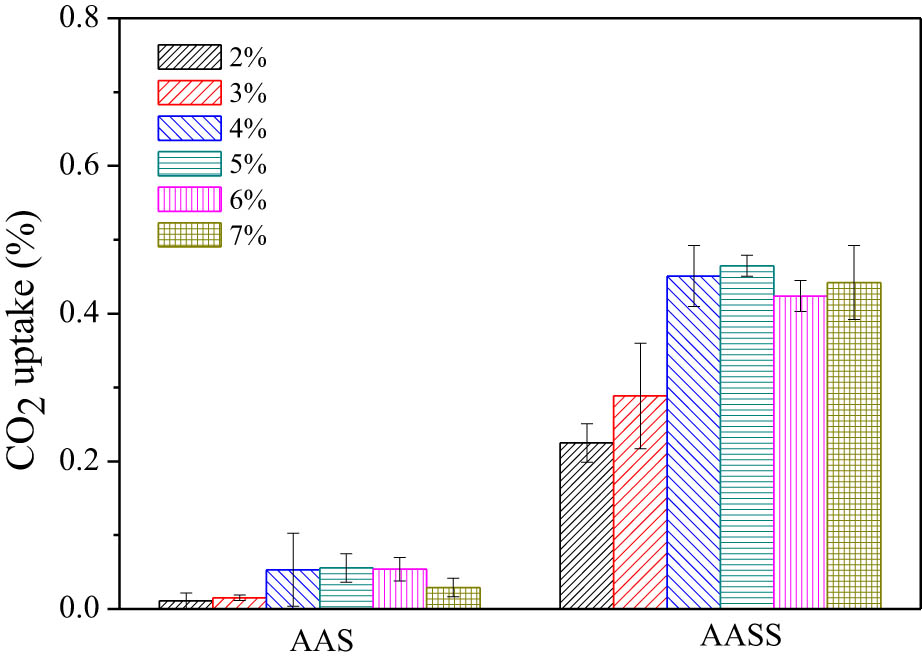
Figure 4
Comparison of CO2 uptake after 30 s exposure to a CO2 environment.
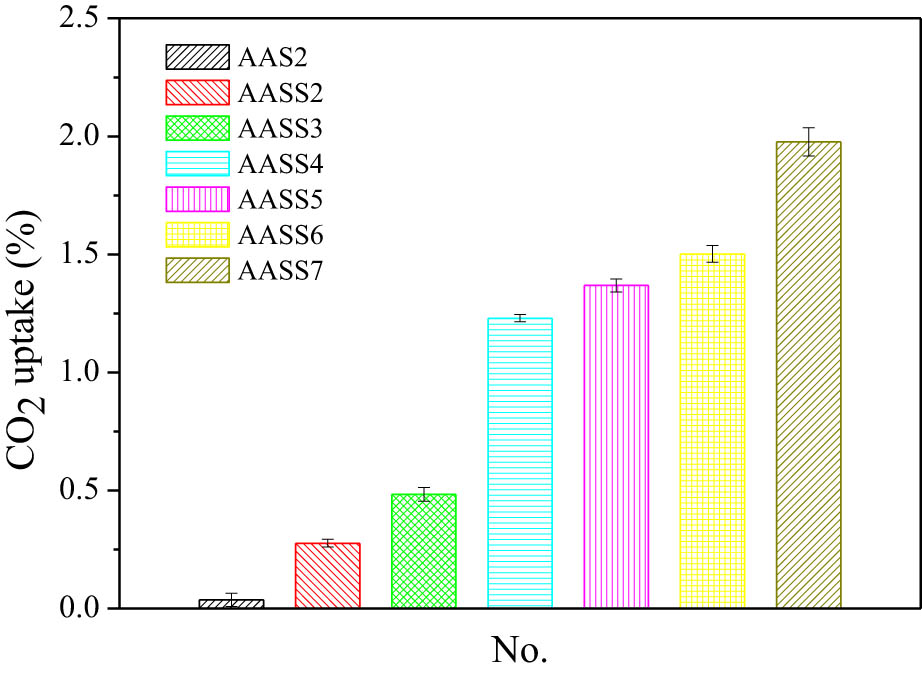
Figure 5
Comparison of maximum CO2 fixation capacities under continuous CO2 exposure at different alkali equivalents.
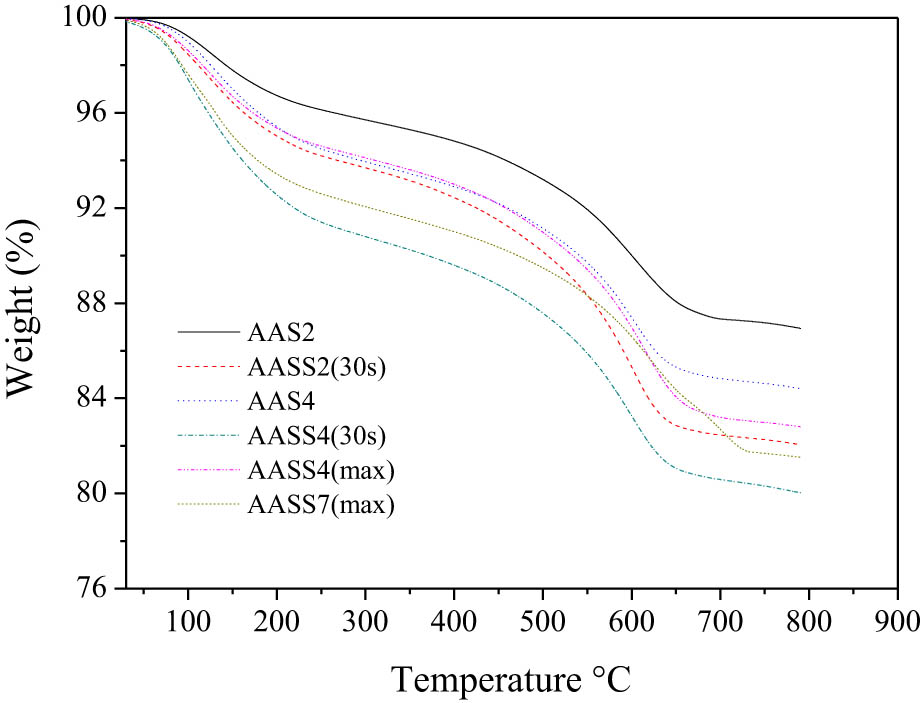
Figure 6
TGA curves of AAS under different CO2 exposure durations.
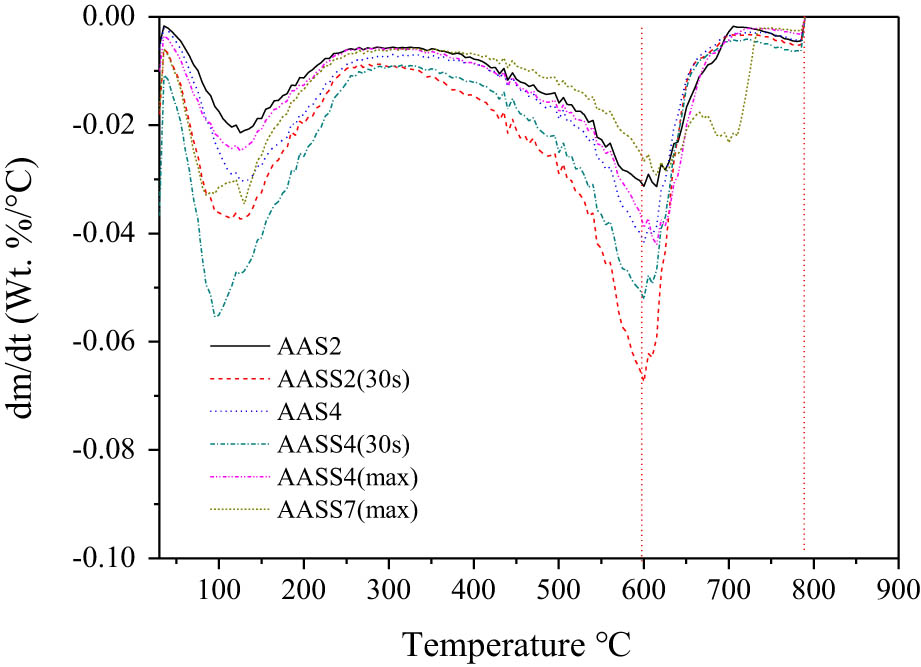
Figure 7
DTG curves of AAS under different CO2 exposure durations.
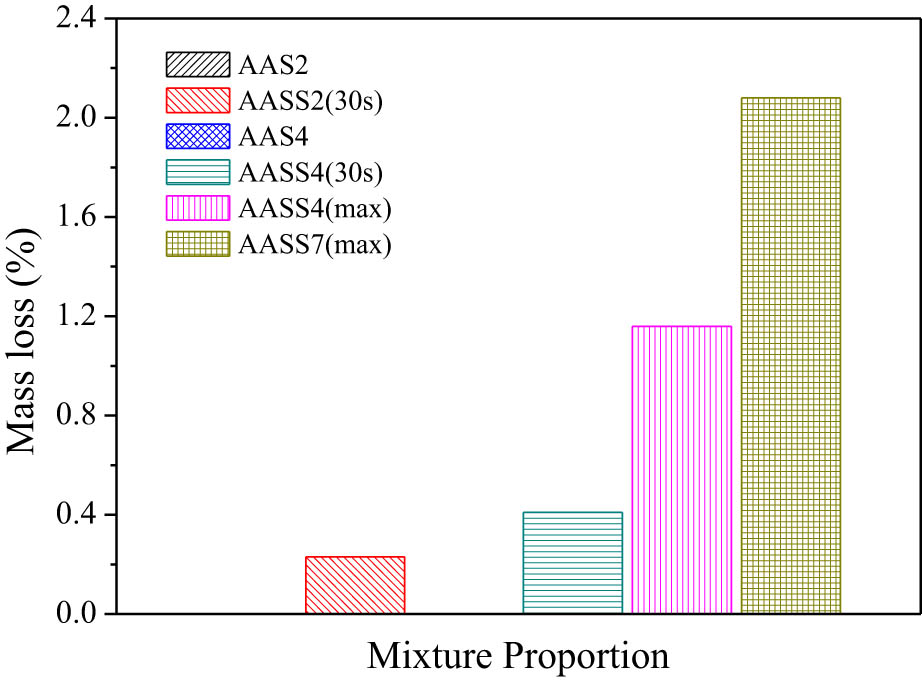
Figure 8
Mass loss associated with carbonate decomposition (600–800°C).
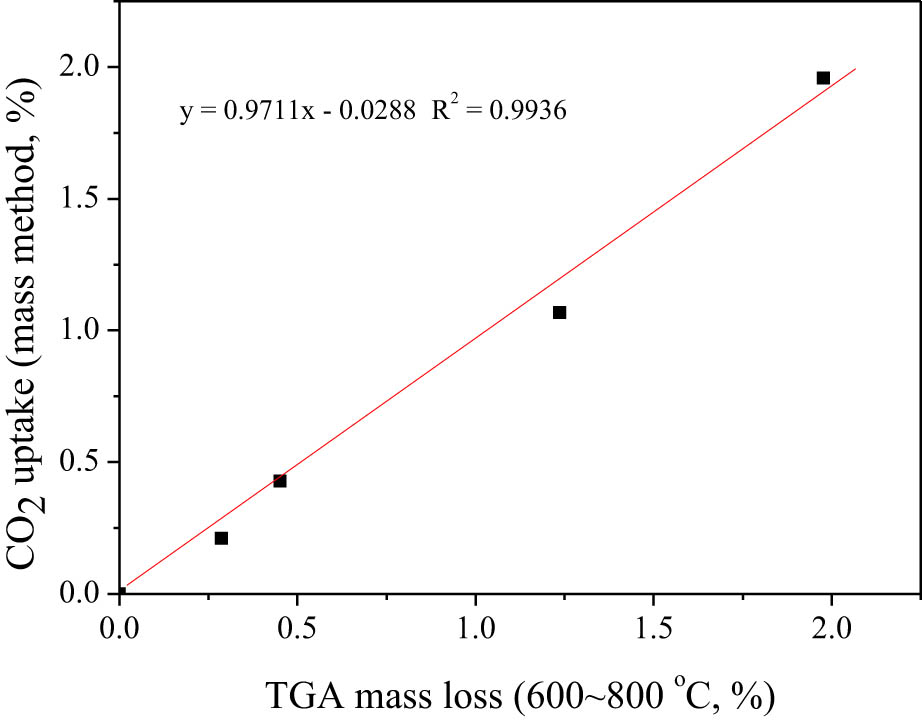
Figure 9
Relationship between the gravimetric method and the CaCO3 decomposition-related mass loss.
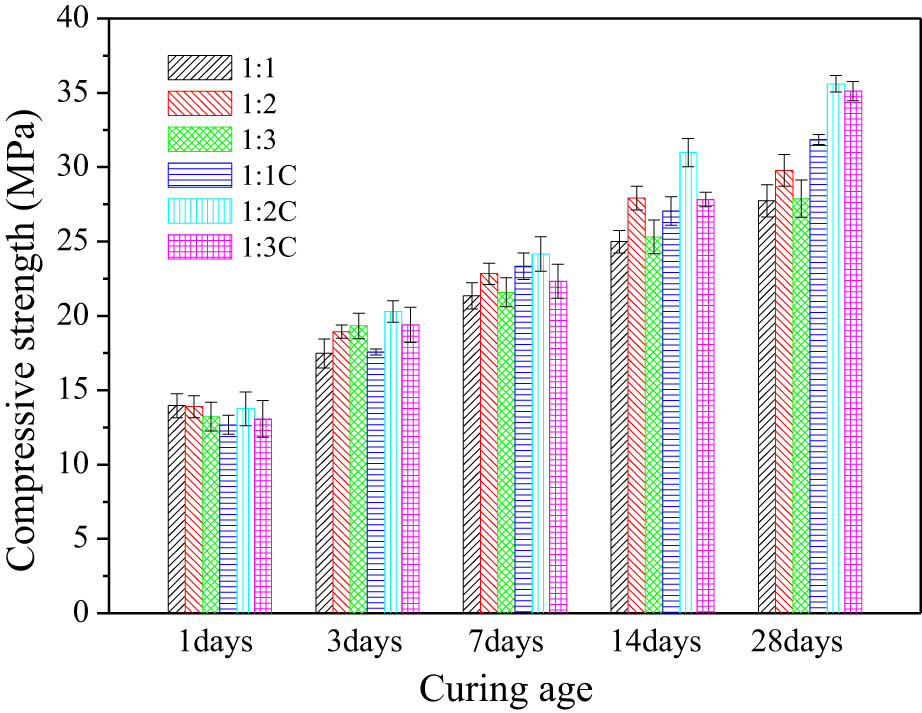
Figure 10
Effect of carbonation on the compressive strength of AAS mortar with different aggregate ratios.
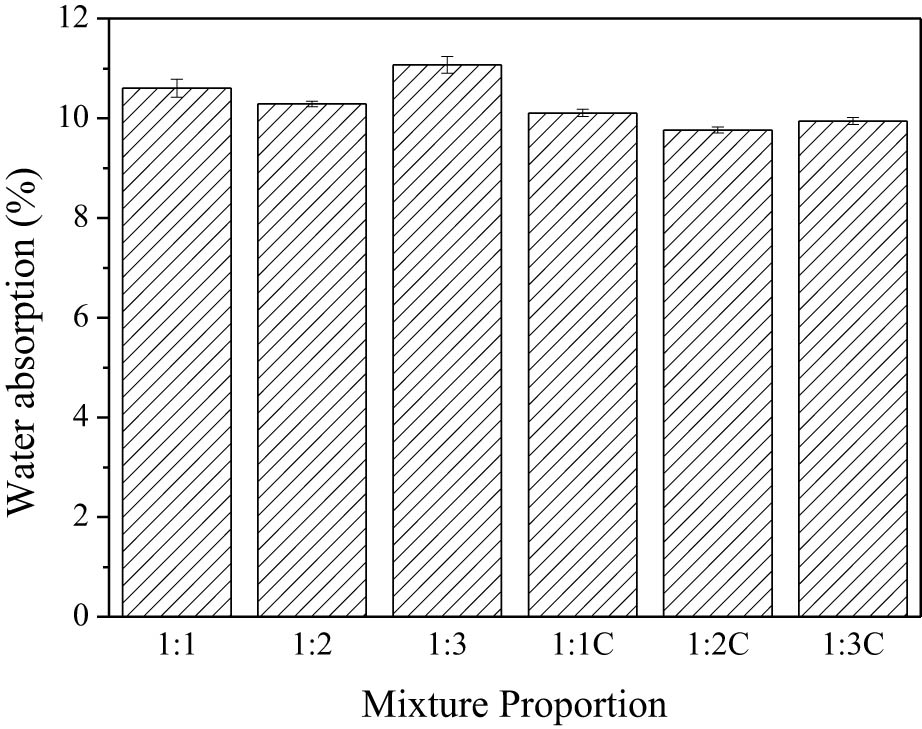
Figure 11
Effect of carbonation on water absorption of AAS mortar with different aggregate ratios.
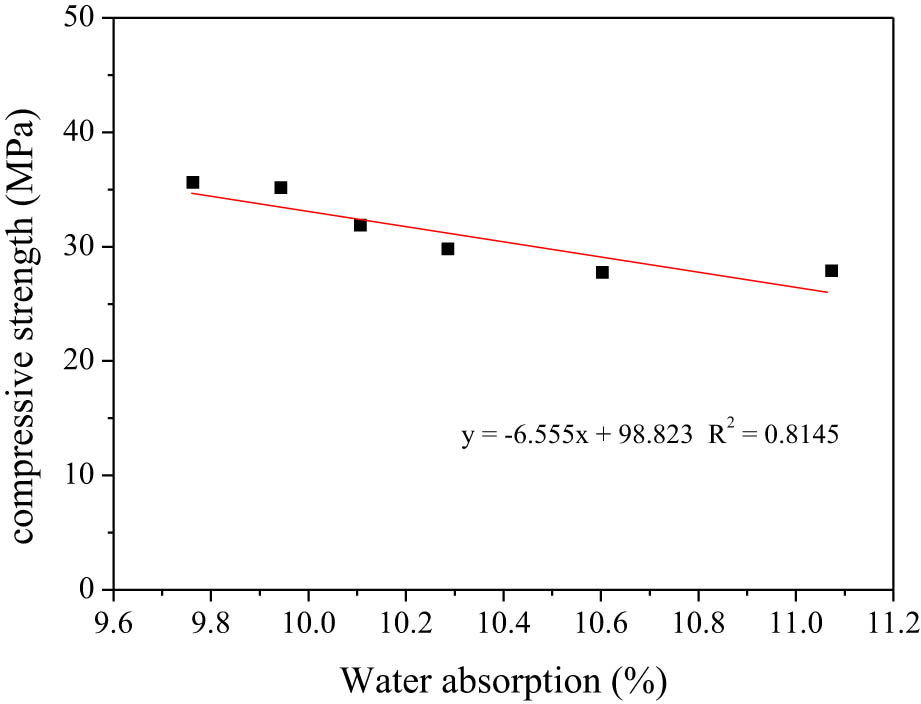
Figure 12
Relationship curve between water absorption and compressive strength.
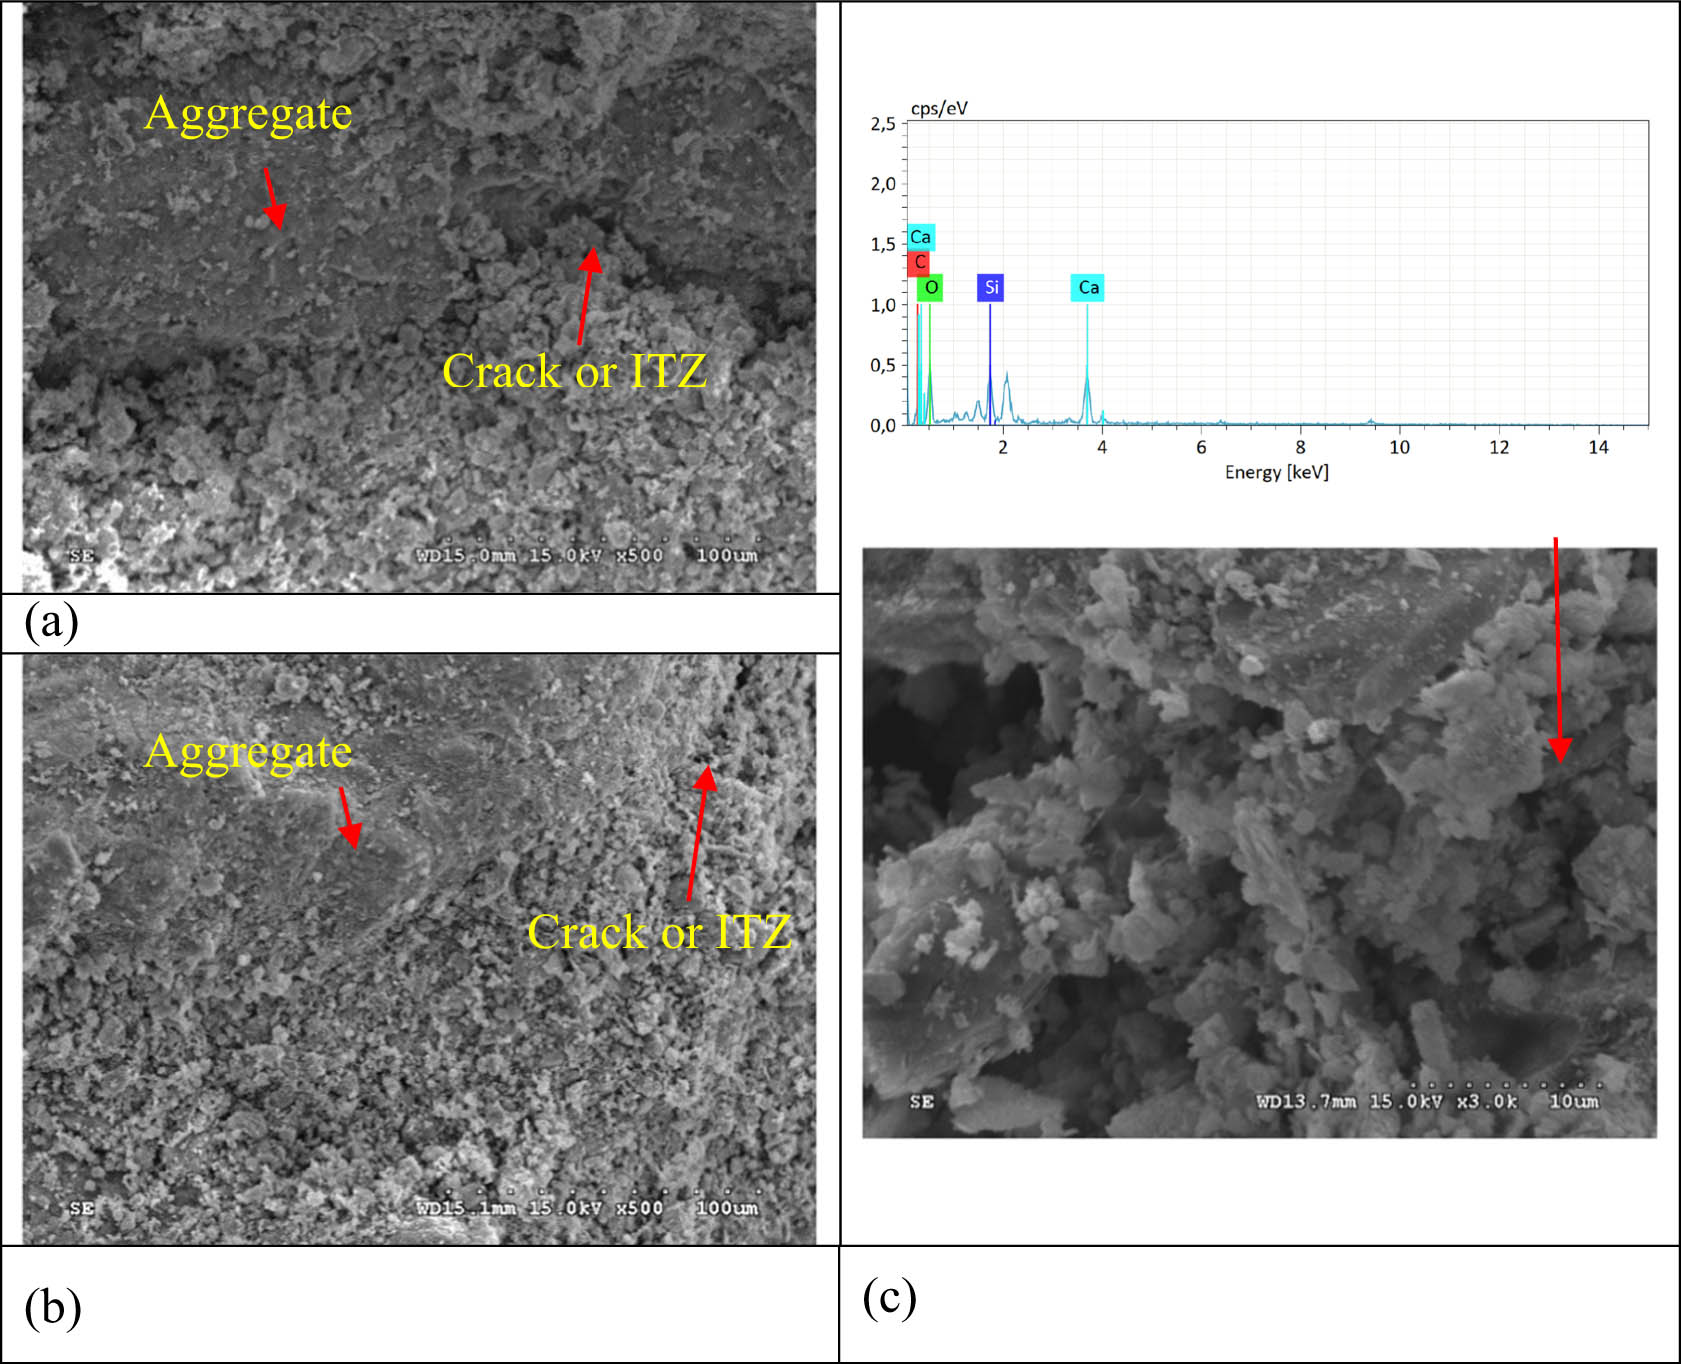
Figure 13
SEM images of carbonated and uncarbonated AAS mortar. (a) 1:3 at 500× magnification, (b) 1:3 C at 500× magnification, and (c) 1:3 C at 3,000× magnification and EDS analysis.