
Figure 1
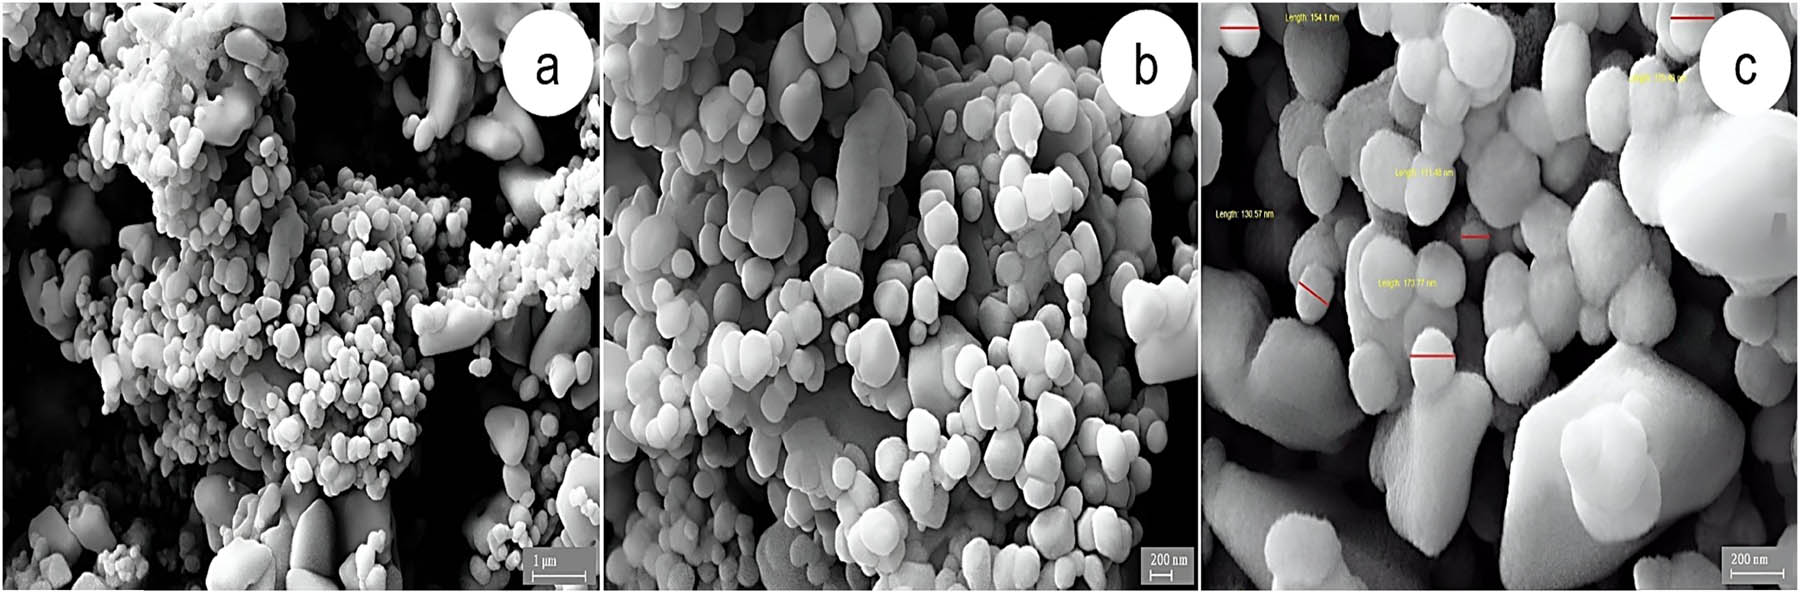
FESEM images of CuFe2O4 NPs at different magnifications: (a) low magnification showing agglomerated nanoparticles 10k×, (b) higher magnification showing semi-spherical/ellipsoidal morphology 20k×, and (c) particle size measurement image showing nanoparticles in the range of 110–170 nm, 50k×.
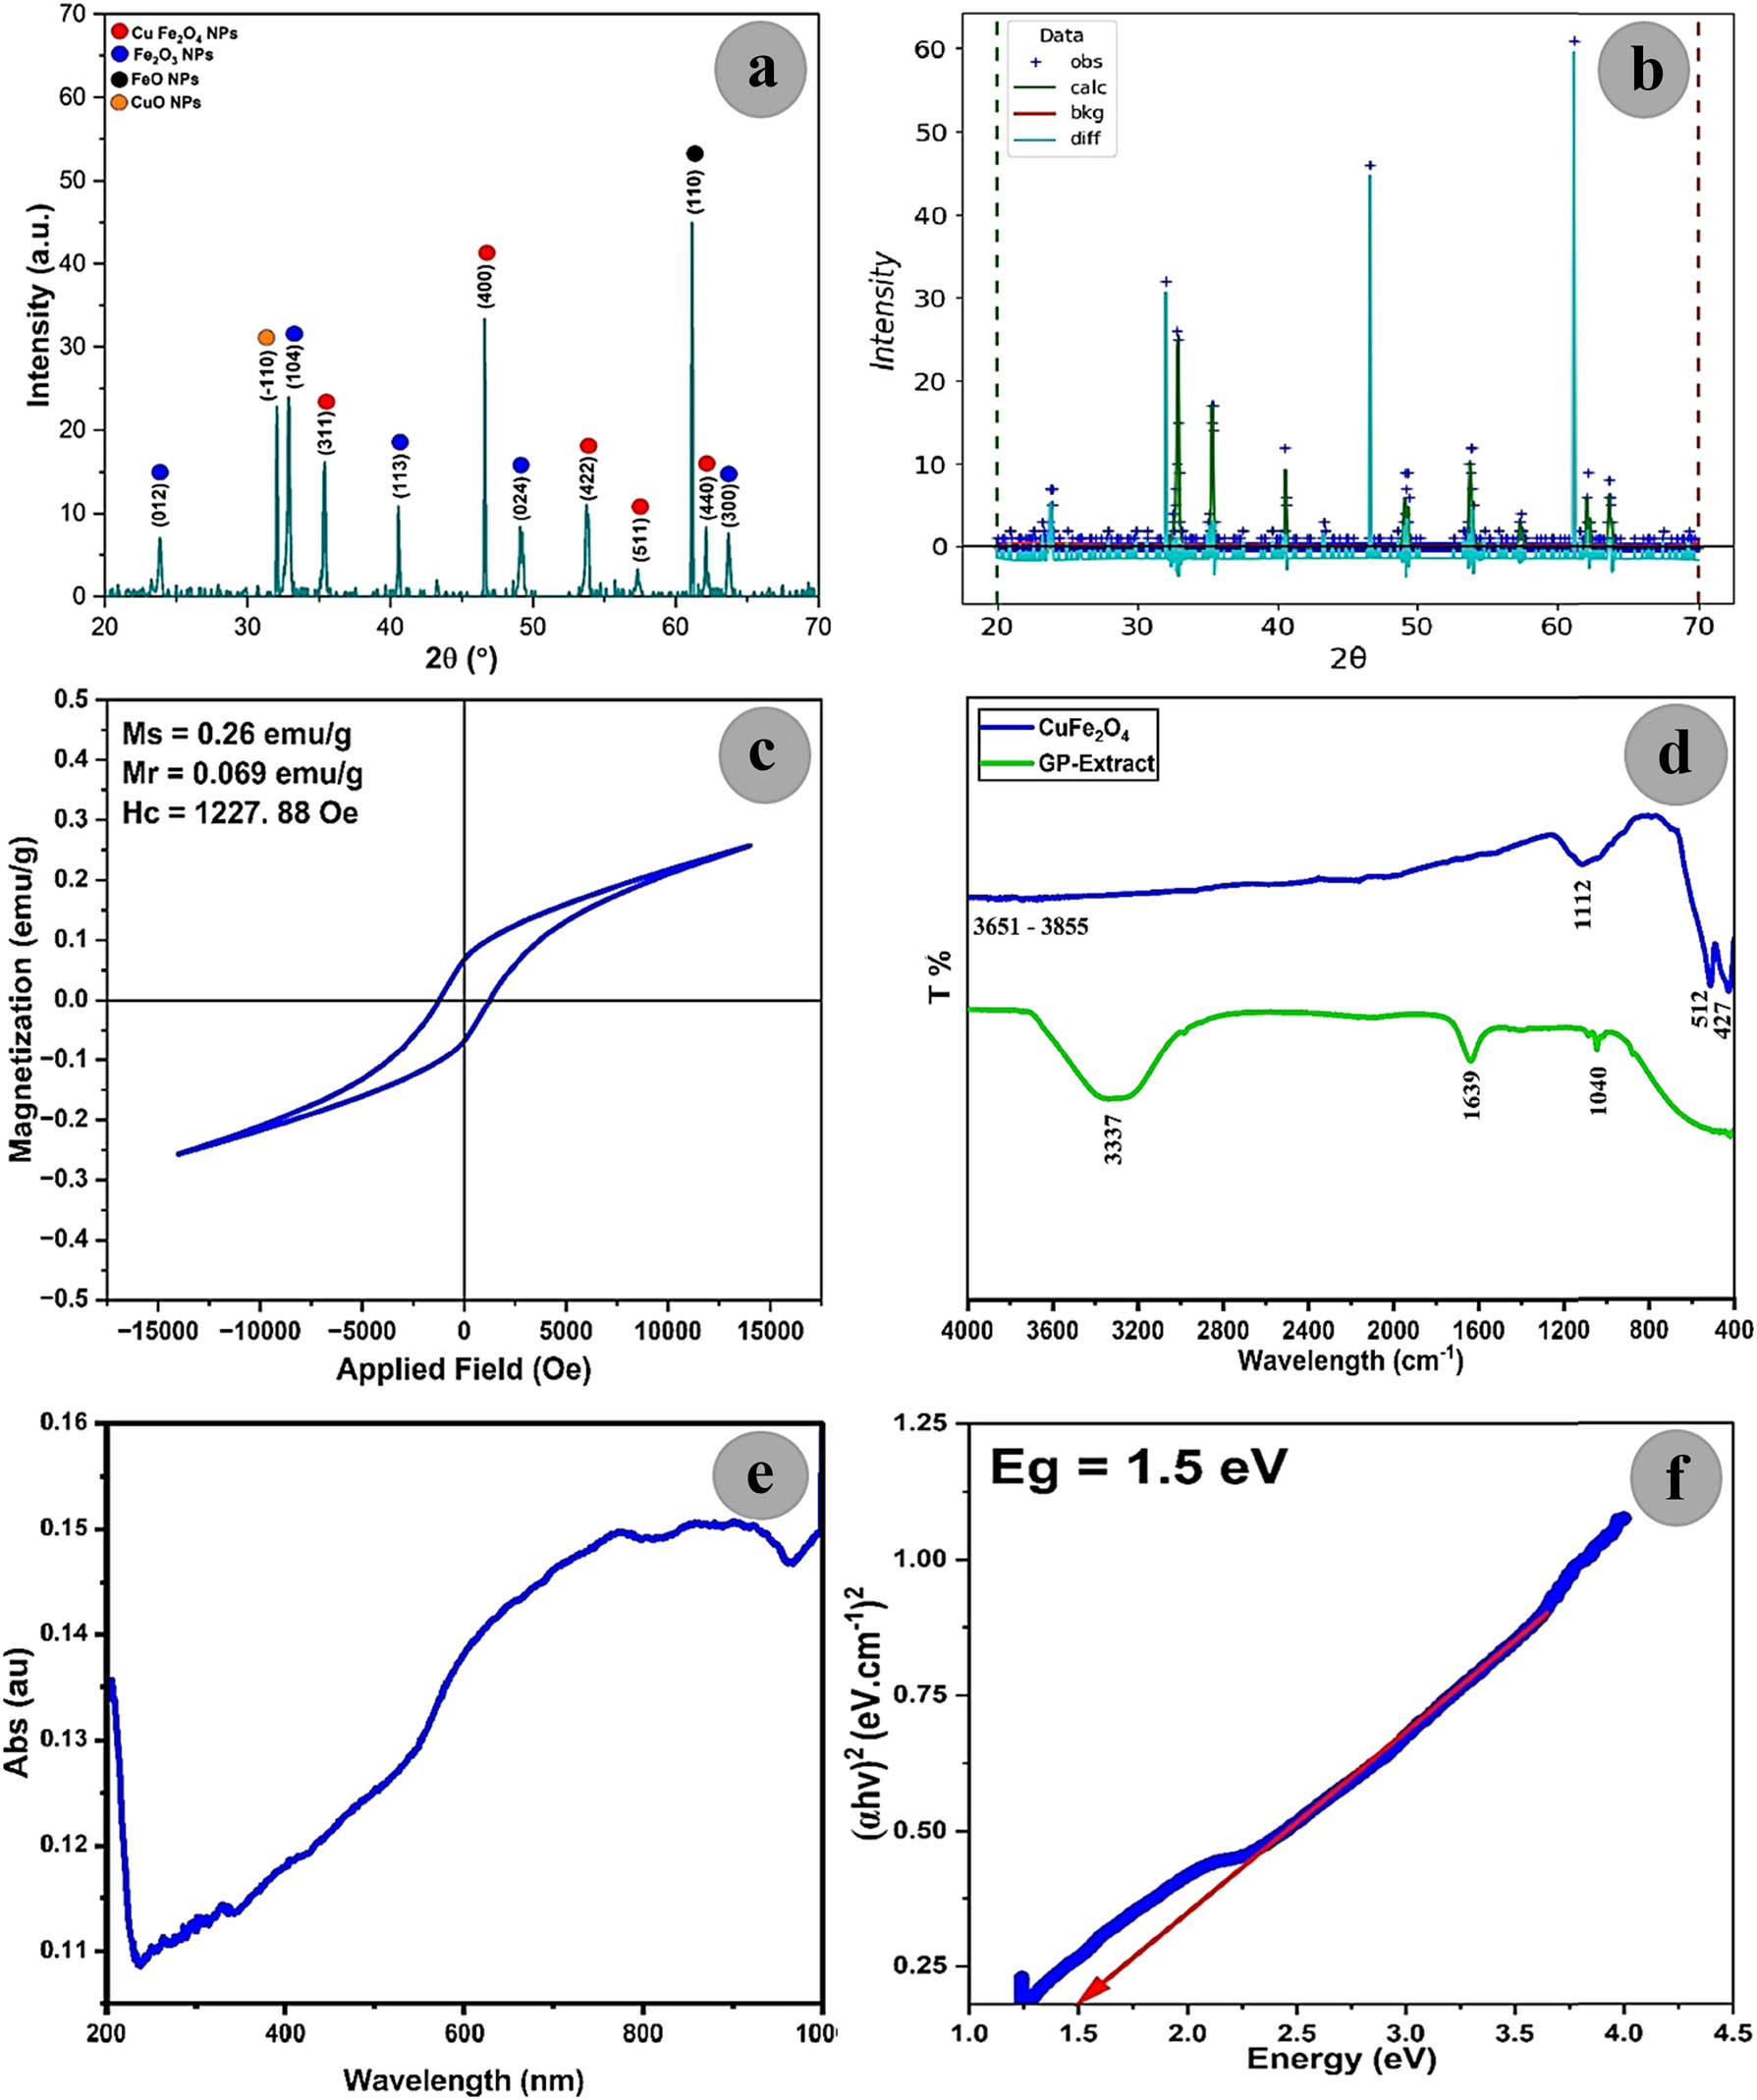
Figure 2
Structural, magnetic, and optical properties of Capsicum annuum extract-assisted synthesized CuFe2O4 nanoparticles sintered at 800℃ for 2 h: (a) XRD pattern, (b) Rietveld refinement of XRD data, (c) magnetic hysteresis loop derived from VSM analysis, (d) FTIR-ATR spectroscopy, (e) UV-Vis absorption spectrum of NPs dispersed in distilled water, and (f) Tauc plot for bandgap energy determination.
Table 1
Cations distribution derived from Rietveld refinement of CuFe2O4 sintered at 800°C for 2 h.
| Spinel ferrite | a (Å) | χ 2 | R wp (%) | R exp (%) | Cell volume (V), (Å3) | A-site (tetrahedral) | B-site (octahedral) | Final chemical formula | Inversion parameter (ϕ) |
|---|---|---|---|---|---|---|---|---|---|
| CuFe2O4 | 8.39 | 1.8 | 9.3 | 6.88 | 590.59 | () | [] | ()A []B | 1 |
Table 2
Phasic composition and crystallographic parameters of the synthesized CuFe2O4 sample.
| Spinel ferrite | Phasic chemical composition | Estimated weight fraction (%) | Crystal system | Space group | Lattice parameters |
|---|---|---|---|---|---|
| CuFe2O4 | CuFe2O4 | ≈75 | Cubic | Fd-3m | a = b = c = 8.39 Å; α = β = γ = 90° |
| Fe2O3 | ≈12 | Rhombohedral (hexagonal setting) | R-3c | a = b = 5.03 Å, c = 13.75 Å; α = β = 90°, γ = 120° | |
| FeO | ≈8 | Cubic | Fm-3m | a = b = c = 4.33 Å; α = β = γ = 90° | |
| CuO | ≈5 | Monoclinic | C2/c | a = 4.68 Å, b = 3.42 Å, c = 5.13 Å; α = γ = 90°, β ≈ 99.5° |
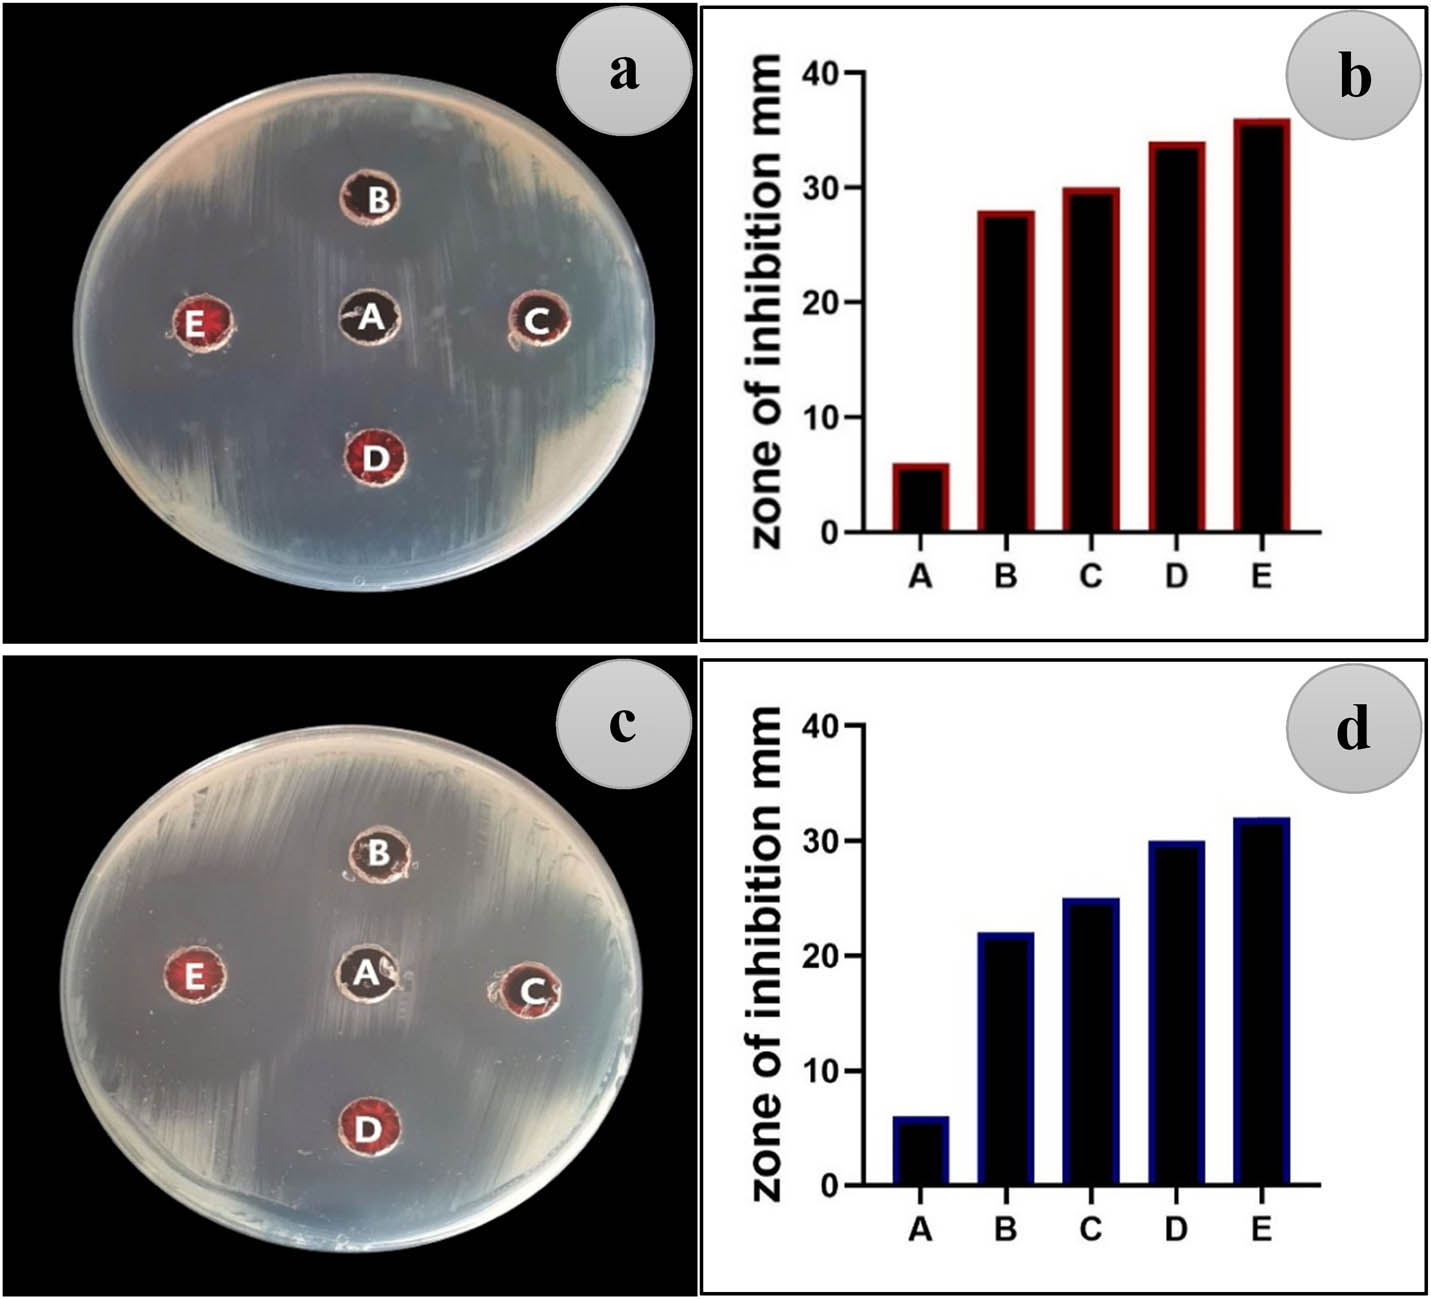
Figure 3
Antibacterial activity of CuFe₂O₄ NPs against (a and b) S. aureus and (c and d) E. coli at different concentrations: (A) control case (deionized water (DIW)), (B) 62.5 µg/mL, (C) 125 µg/mL, (D) 250 µg/mL, and (E) 500 µg/mL.
Table 3
Antibacterial activity of CuFe₂O₄ NPs against S. aureus and E. coli at different ratios.
| Sample | Control (DIW) | 62.5 µg/mL | 125 µg/mL | 250 µg/mL | 500 µg/mL |
|---|---|---|---|---|---|
| S. aureus | 6 ± 0.0 | 29.33 ± 3.21 | 33 ± 2.64 | 36 ± 2.64 | 38.66 ± 2.30 |
| E. coli | 6 ± 0.0 | 22.66 ± 2.08 | 26 ± 1.73 | 31.66 ± 2.08 | 33.66 ± 1.52 |
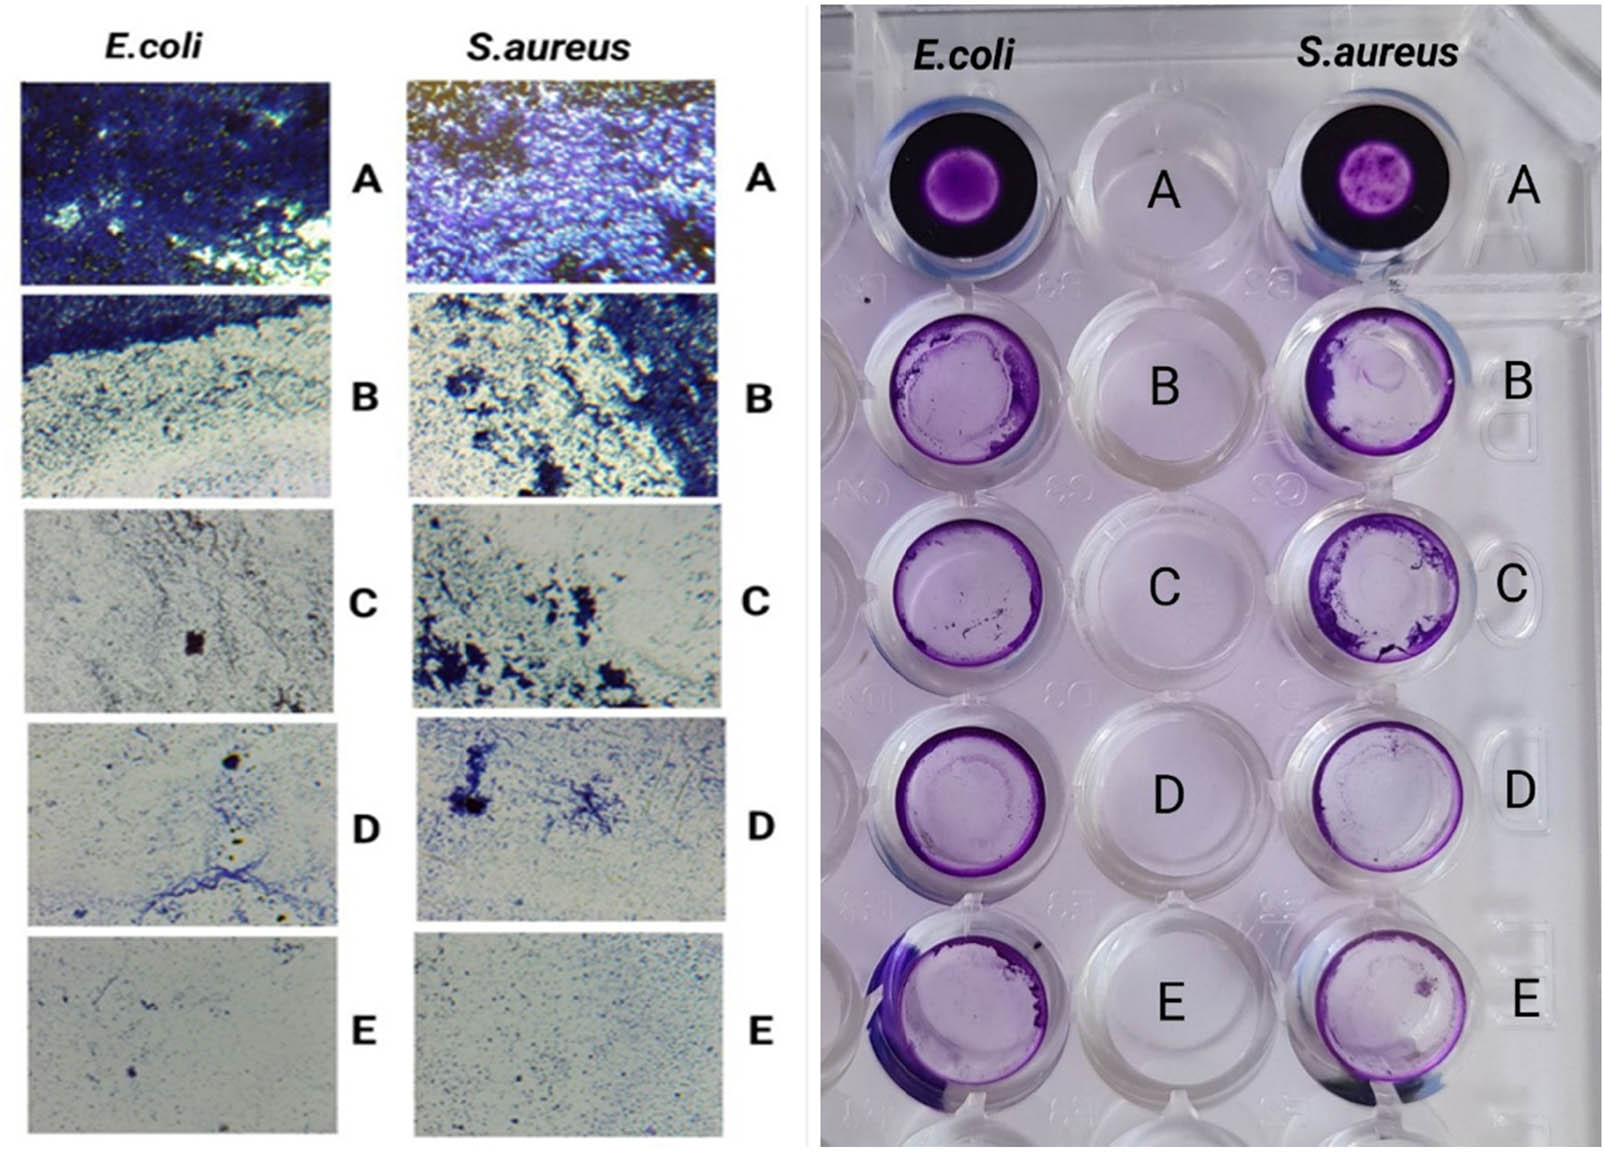
Figure 4
Biofilm formation in E. coli and S. aureus at different concentrations of CuFe₂O₄ NPs: (A) control case, (B) 62.5 µg/mL, (C) 125 µg/mL, (D) 250 µg/mL and (E) 500 µg/mL.
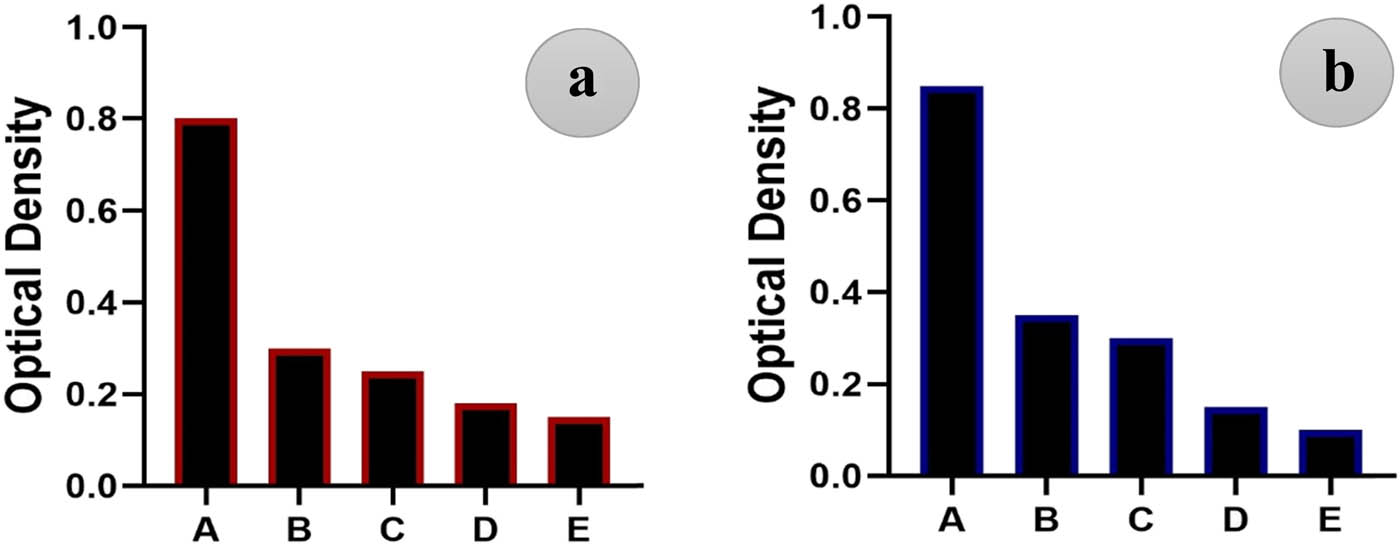
Figure 5
Biofilm formation in (a) E. coli and (b) S. aureus treated with CuFe₂O₄ NPs at different concentrations: (A) control case, (B) 62.5 µg/mL, (C) 125 µg/mL, (D) 250 µg/mL, and (E) 500 µg/mL.
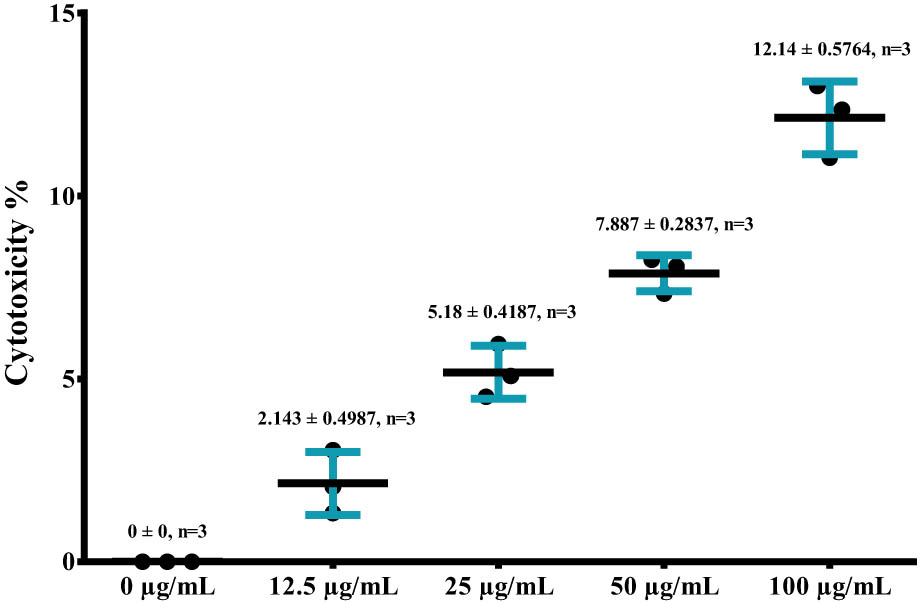
Figure 6
Cytotoxicity effect of CuFe₂O₄ substance in MCF-10 cells.
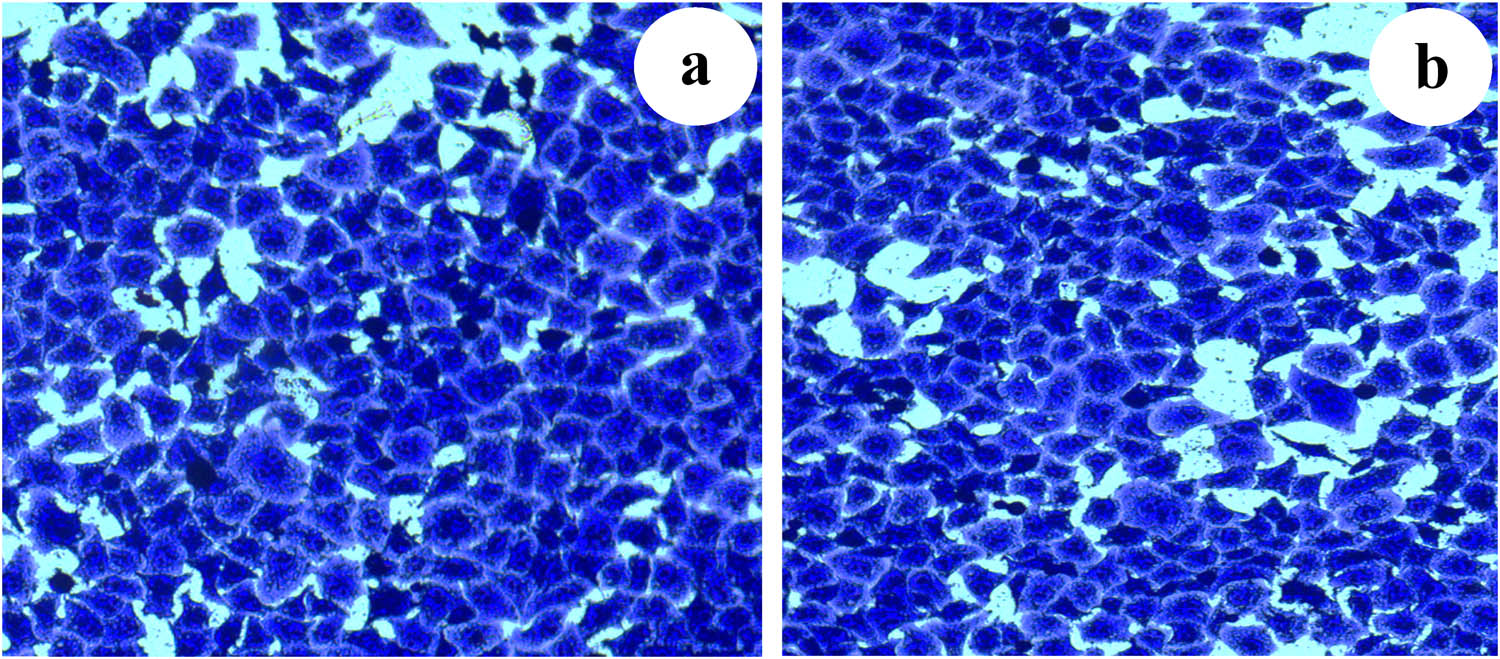
Figure 7
MTT assay: (a) untreated MCF-10 cells and (b) MCF-10 cells after being treated with CuFe₂O₄ NPs.
Table 4
Hemolysis data of CuFe₂O₄ NPs.
| Samples | Result of device | Result after |
|---|---|---|
| 25 µg/mL | 0.045 | 4.83 |
| 12.5 µg/mL | 0.042 | 3.39 |
| Negative control | 0.035 | ـــ |
| Positive control | 0.241 | ـــ |
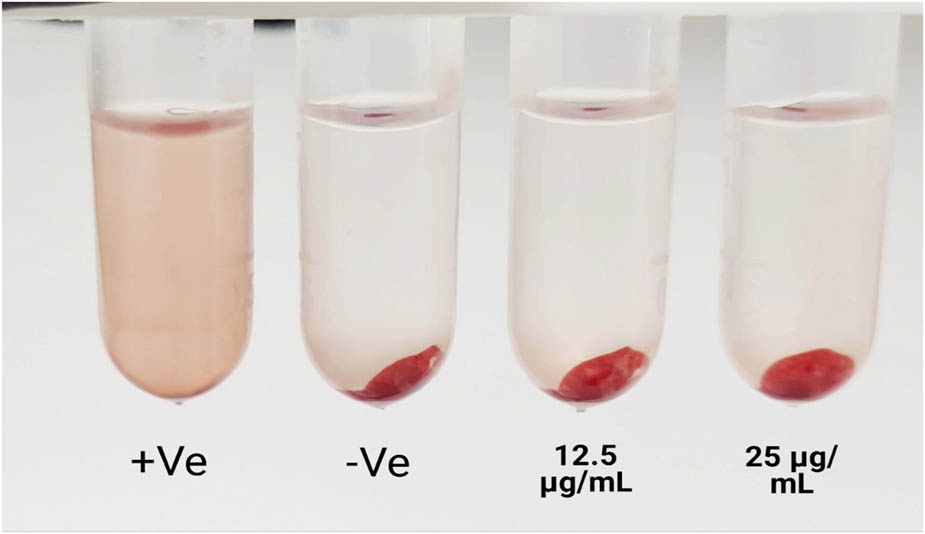
Figure 8
Hemolysis analysis of CuFe₂O₄ NPs at 12.5 and 25 µg/mL.