
Table 1
Main chemical compositions of 316L stainless steel
| Elements | C | Cr | Ni | Mo | Si | Mn | P | S |
|---|---|---|---|---|---|---|---|---|
| Mass fraction (%) | 0.0255 | 14.41 | 8.05 | 2.1 | 0.35 ≤ 1.00 | 0.86 | 0.033 | 0.011 |
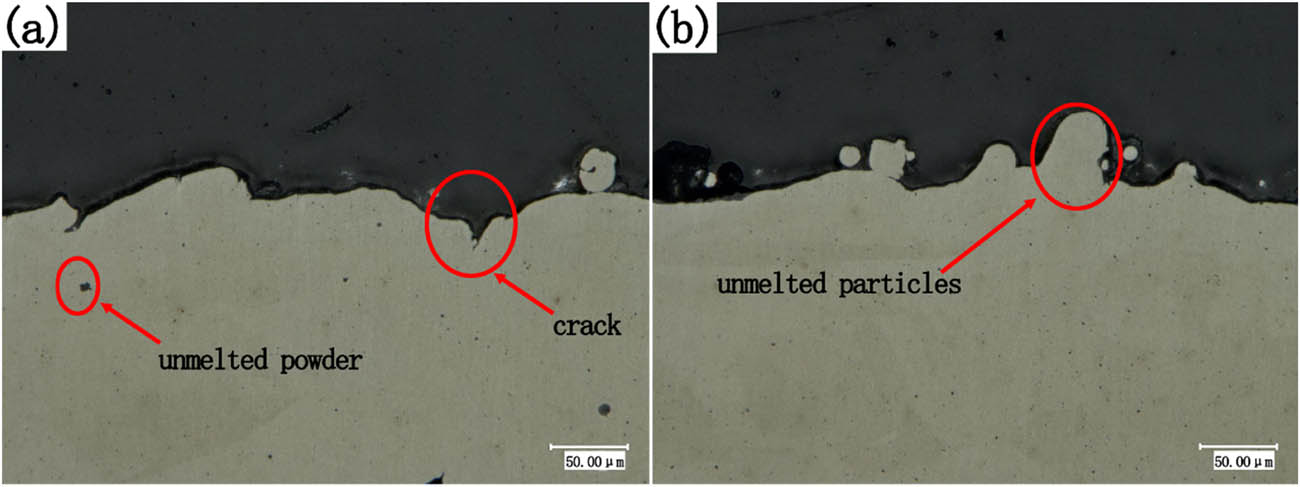
Figure 1
Defects in additive manufacturing of 316L stainless steel: (a) incompletely melted crystal grains and surface cracks and (b) incompletely molten convex structures.
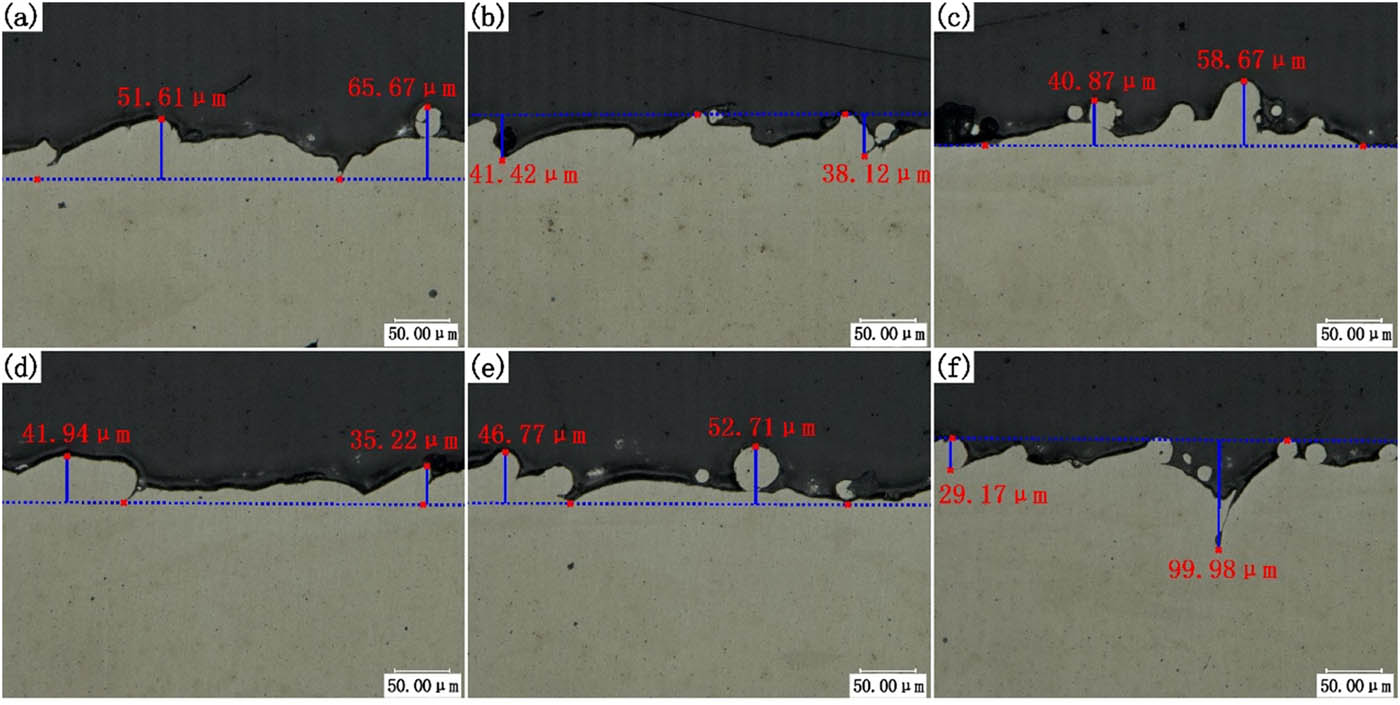
Figure 2
Defect depth measurement: (a–d) surface micro-pits and micro-protrusions; (e) unmelted particles; and (f) deep cracks.
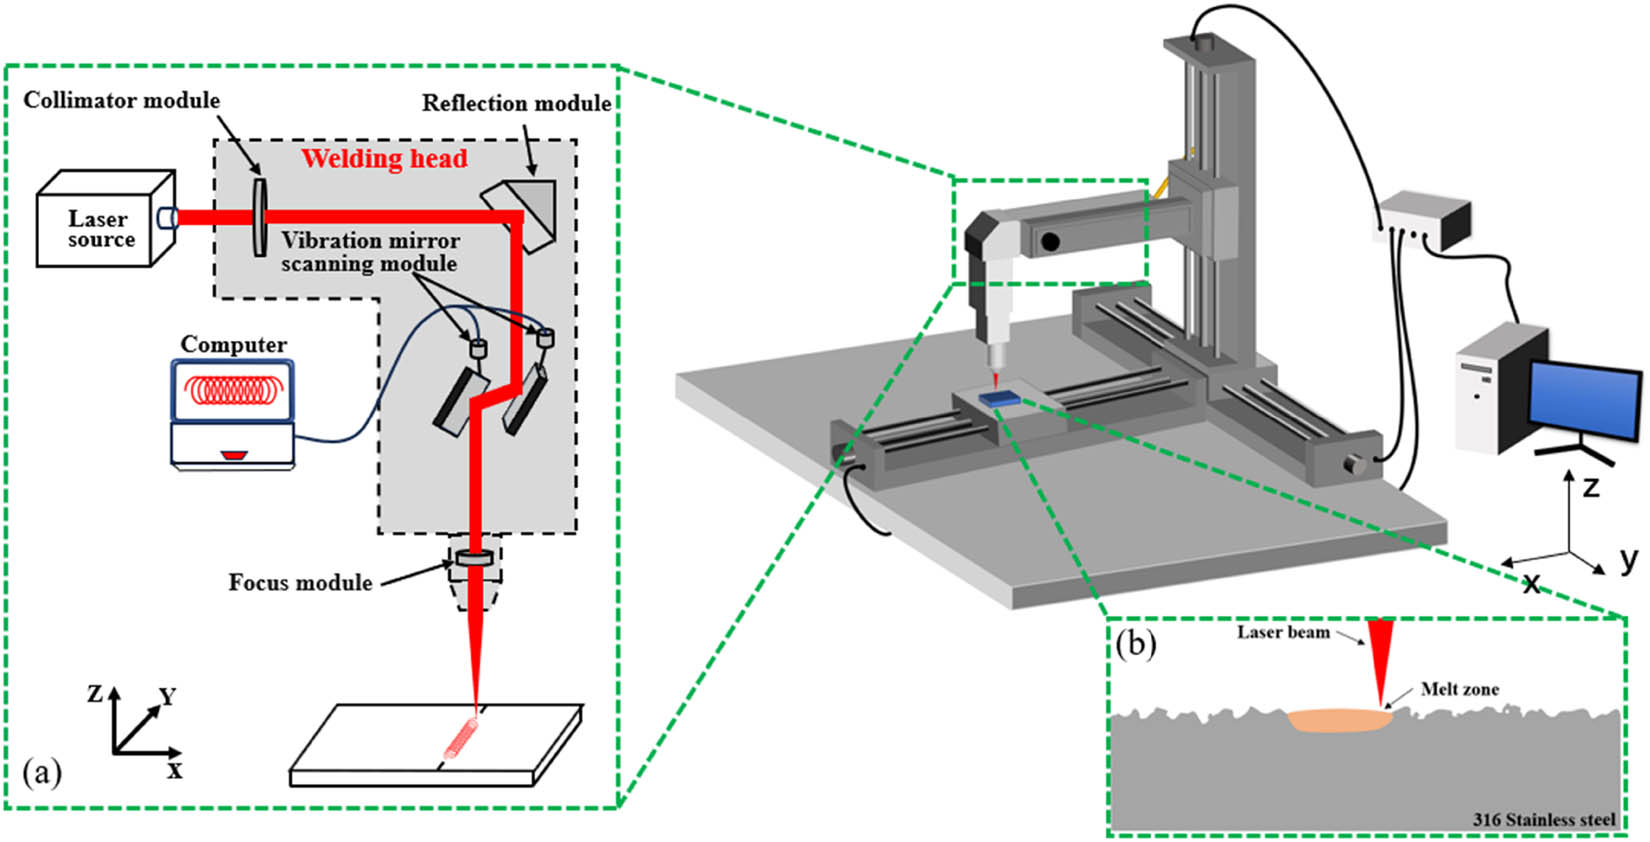
Figure 3
Schematic diagram of experimental equipment: (a) laser system and (b) laser remelting treatment.
Table 2
Main technological parameters of laser
| Technological parameters | Value |
|---|---|
| Maximum power (W) | 1,500 |
| Laser wavelength (nm) | 1,064 |
| Maximum frequency (Hz) | 20,000 |
| Focal length (mm) | 125 |
| Rotation speed (rpm) | 2,000 |
| Laser mode | Circular oscillating laser |
| Output mode | Pulse |
Table 3
Laser remelting process parameters
| No. | Laser power (W) | Scanning speed (mm/s) | Rotation speed (%) |
|---|---|---|---|
| 1 | 120 | 4 | 40, 50, 60 |
| 2 | 120 | 5 | 40, 50, 60 |
| 3 | 120 | 6 | 40, 50, 60 |
| 4 | 150 | 4 | 40, 50, 60 |
| 5 | 150 | 5 | 40, 50, 60 |
| 6 | 150 | 6 | 40, 50, 60 |
| 7 | 180 | 4 | 40, 50, 60 |
| 8 | 180 | 5 | 40, 50, 60 |
| 9 | 180 | 6 | 40, 50, 60 |
Table 4
The actual values and corresponding encoded values of roughness and melt depth parameters
| Factor | Symbol | Extreme value | ||
|---|---|---|---|---|
| −1 | 0 | 1 | ||
| P (W) | W | 120 | 150 | 180 |
| V (mm/s) | v | 4 | 5 | 6 |
| N (%) | r | 40 | 50 | 60 |
Table 5
Experimental design matrix and corresponding measurement results for roughness and melt depth
| No. | P (W) | N (%) | V (mm/s) | R (μm) | D (μm) |
|---|---|---|---|---|---|
| 1 | 120 | 40 | 5 | 1.99 | 50 |
| 2 | 180 | 40 | 5 | 0.65 | 239 |
| 3 | 120 | 60 | 5 | 1.56 | 40 |
| 4 | 180 | 60 | 5 | 0.85 | 195 |
| 5 | 120 | 50 | 4 | 1.32 | 48 |
| 6 | 180 | 50 | 4 | 0.8 | 228 |
| 7 | 120 | 50 | 6 | 2.13 | 46 |
| 8 | 180 | 50 | 6 | 0.72 | 210 |
| 9 | 150 | 40 | 4 | 0.86 | 136 |
| 10 | 150 | 60 | 4 | 0.81 | 94 |
| 11 | 150 | 40 | 6 | 1.2 | 136 |
| 12 | 150 | 60 | 6 | 0.83 | 95 |
| 13 | 150 | 50 | 5 | 0.97 | 107 |
| 14 | 150 | 50 | 5 | 0.99 | 106 |
| 15 | 150 | 50 | 5 | 0.95 | 103 |
| 16 | 150 | 50 | 5 | 1.01 | 104 |
| 17 | 150 | 50 | 5 | 0.98 | 105 |
Table 6
Parameters corresponding to image encoding under different power parameters
| 4 mm/s | 5 mm/s | 6 mm/s | |
|---|---|---|---|
| 40% | a | b | c |
| 50% | d | e | f |
| 60% | g | h | i |
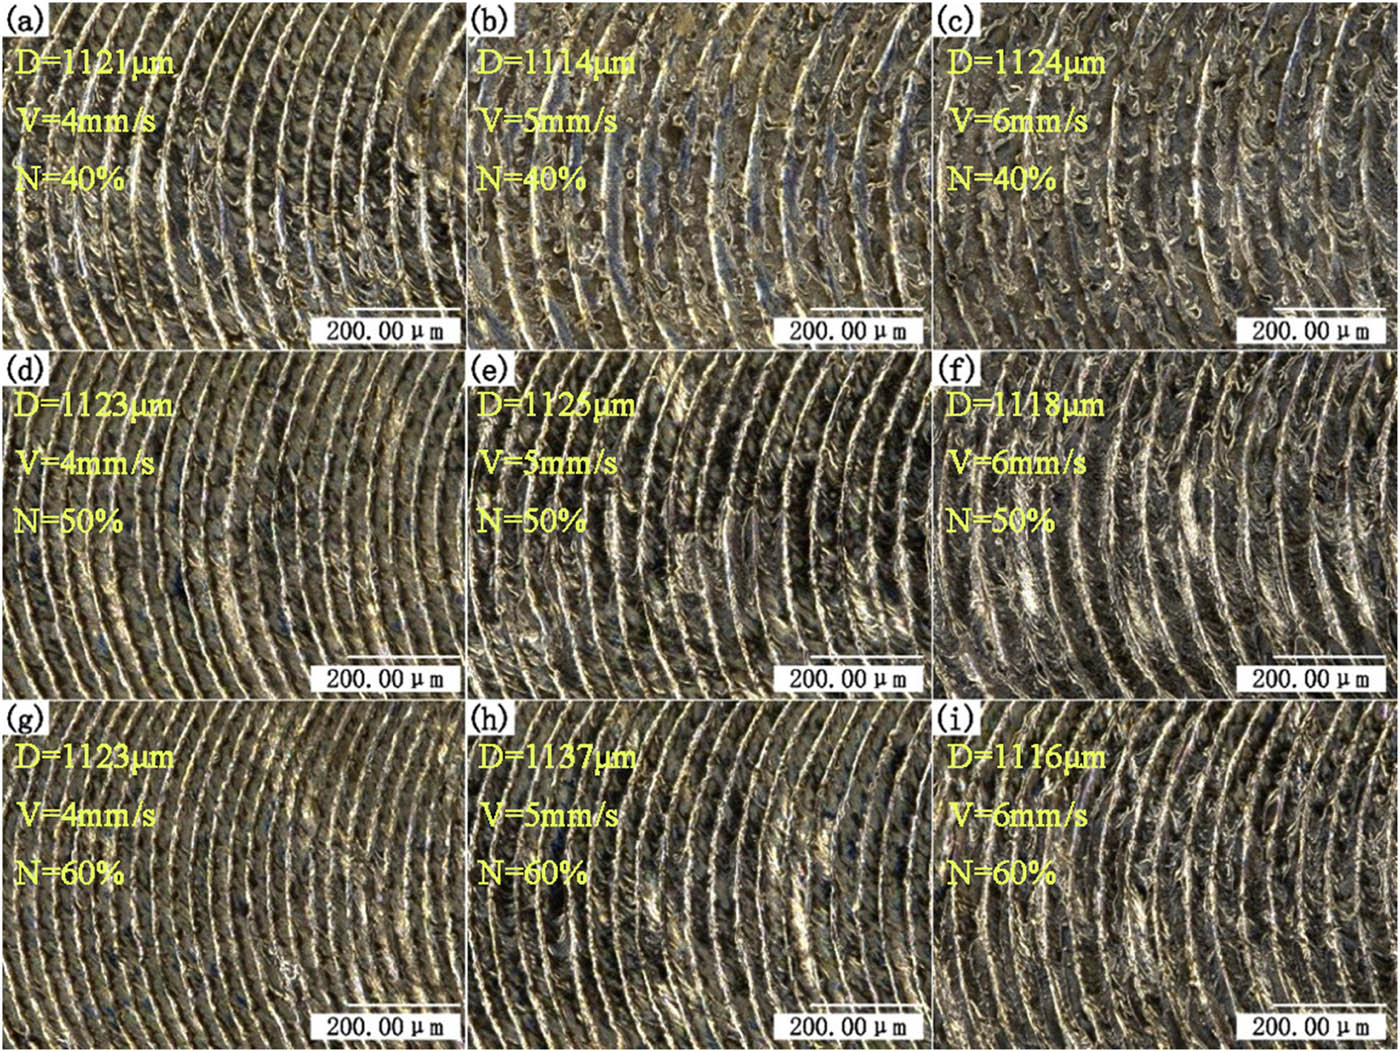
Figure 4
Surface morphology of specimens with different scanning speeds and rotation speeds under a power of 120 W, samples (a–i) correspond to the process parameters a–i listed in Table 6.
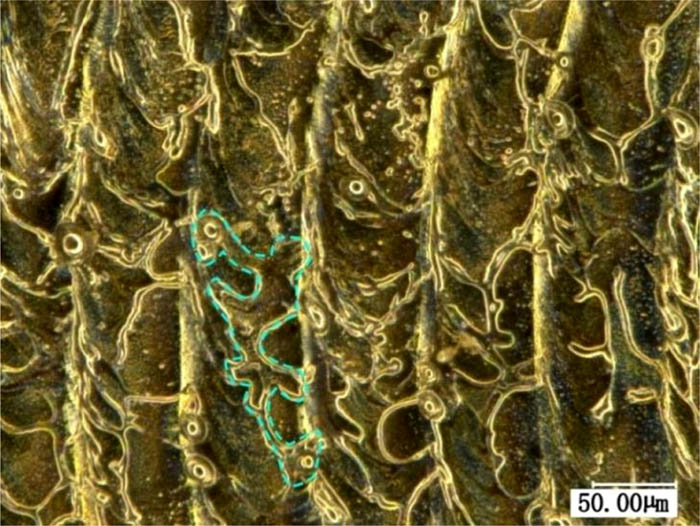
Figure 5
Sawtooth undulating morphology at 800× magnification under a power of 120 W.
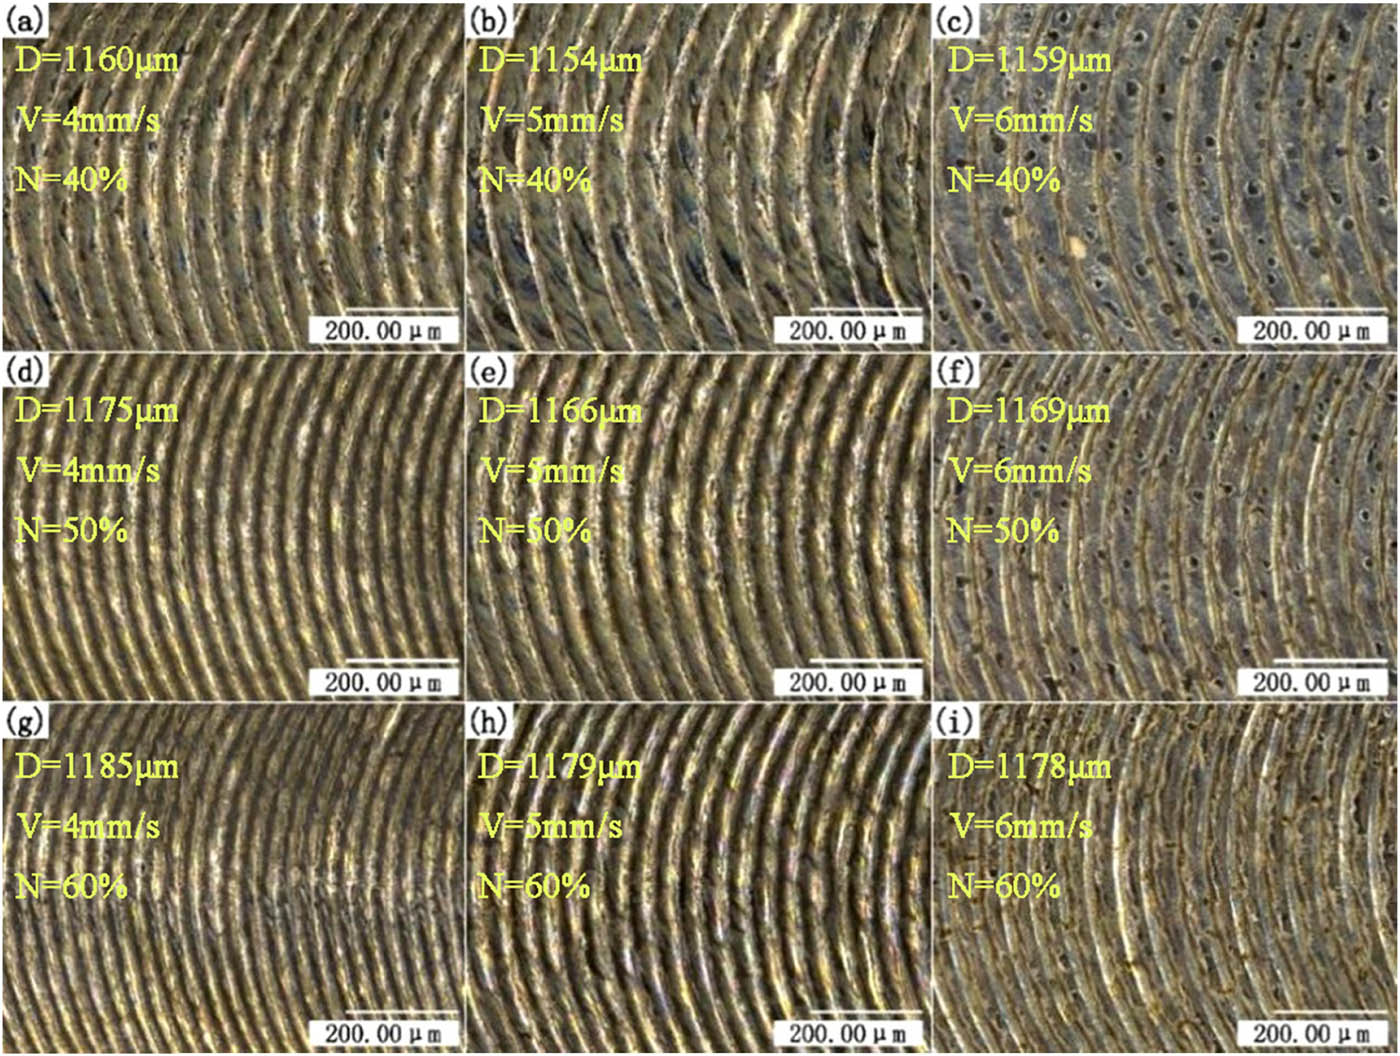
Figure 6
Surface morphology of specimens with different scanning speeds and rotation speeds under a power of 150 W, samples (a–i) correspond to the process parameters a–i listed in Table 6.
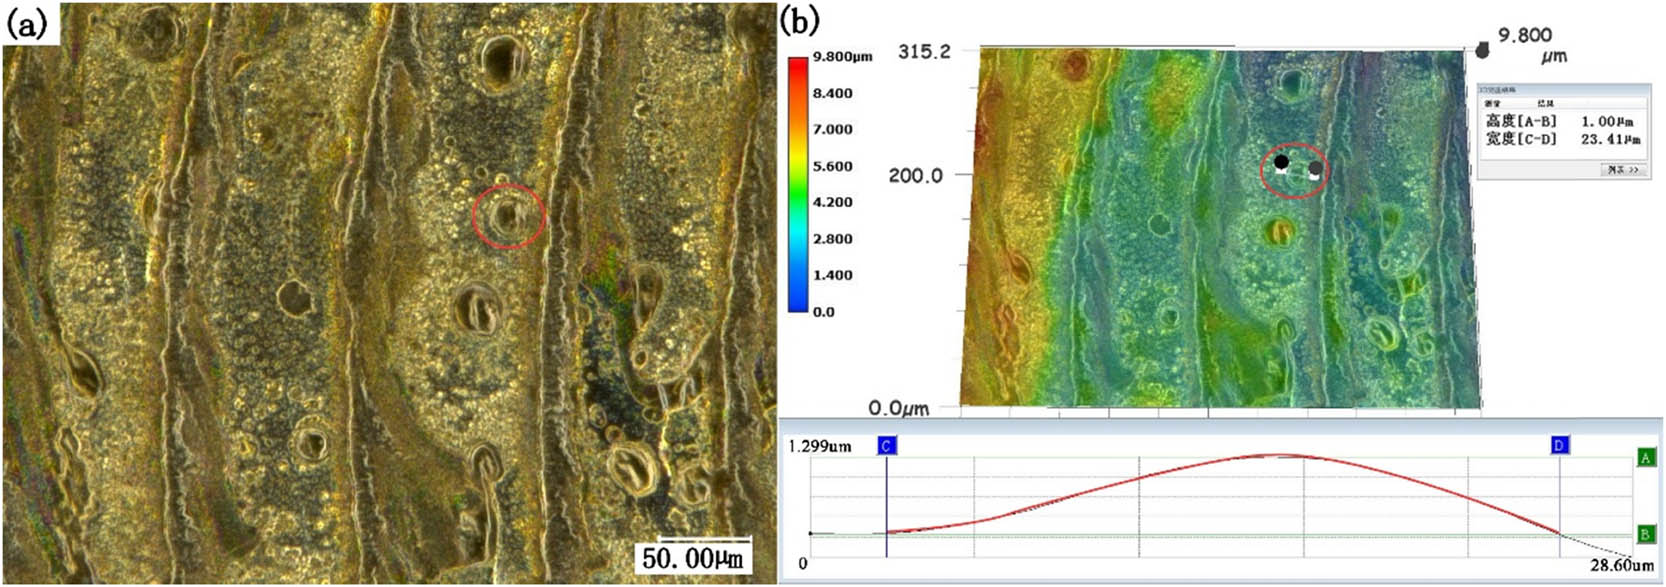
Figure 7
Black spot defects on the remelted surface: (a) two dimensional morphology and (b) three dimensional morphology and cross-sectional profile.
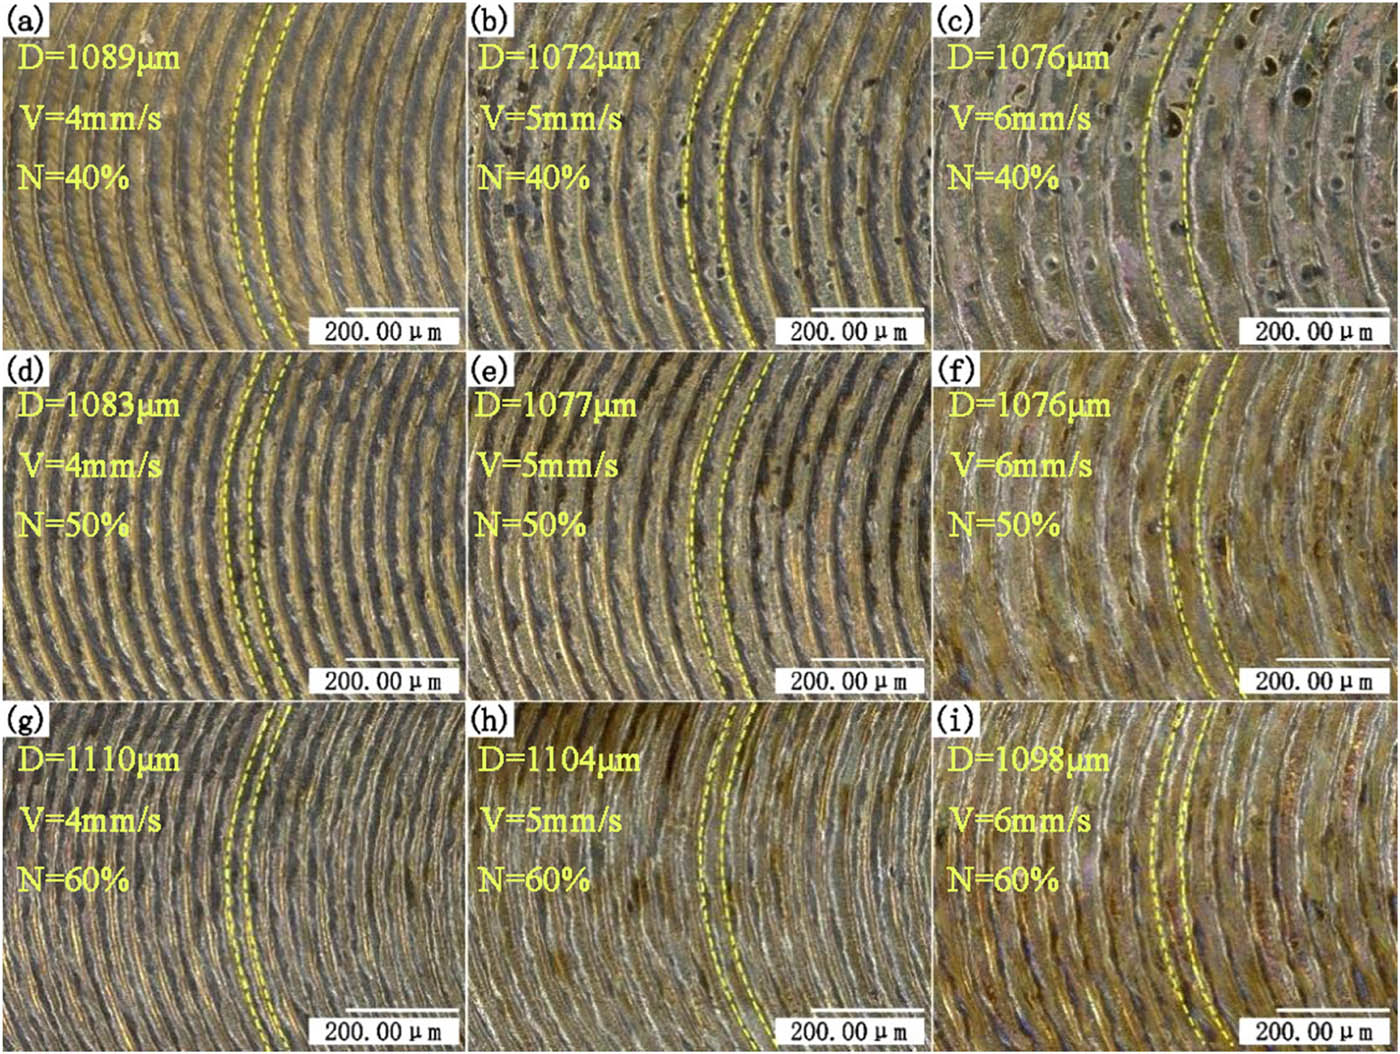
Figure 8
Surface morphology of specimens with different scanning speeds and rotation speeds under a power of 180 W, samples (a–i) correspond to the process parameters a–i listed in Table 6.
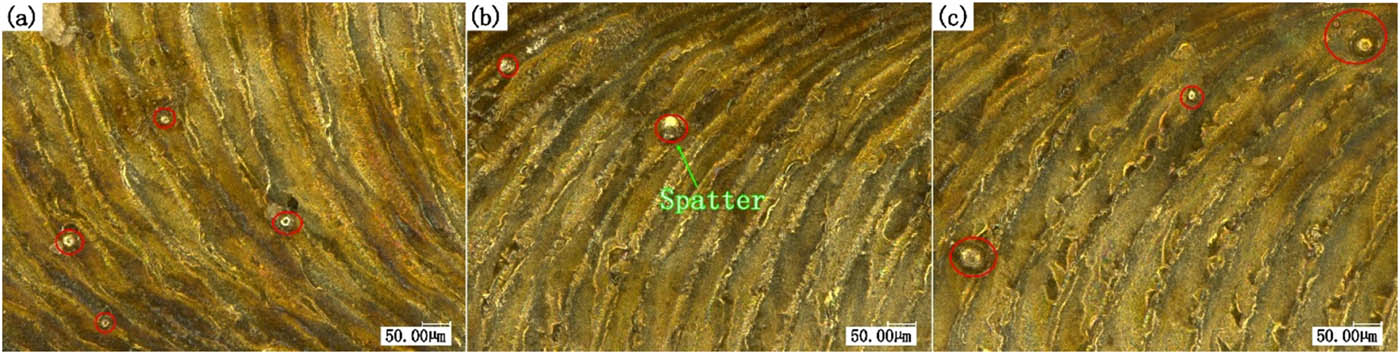
Figure 9
Surface splashing after 180 W power remelting: (a) bottom side and (b, c) top side.
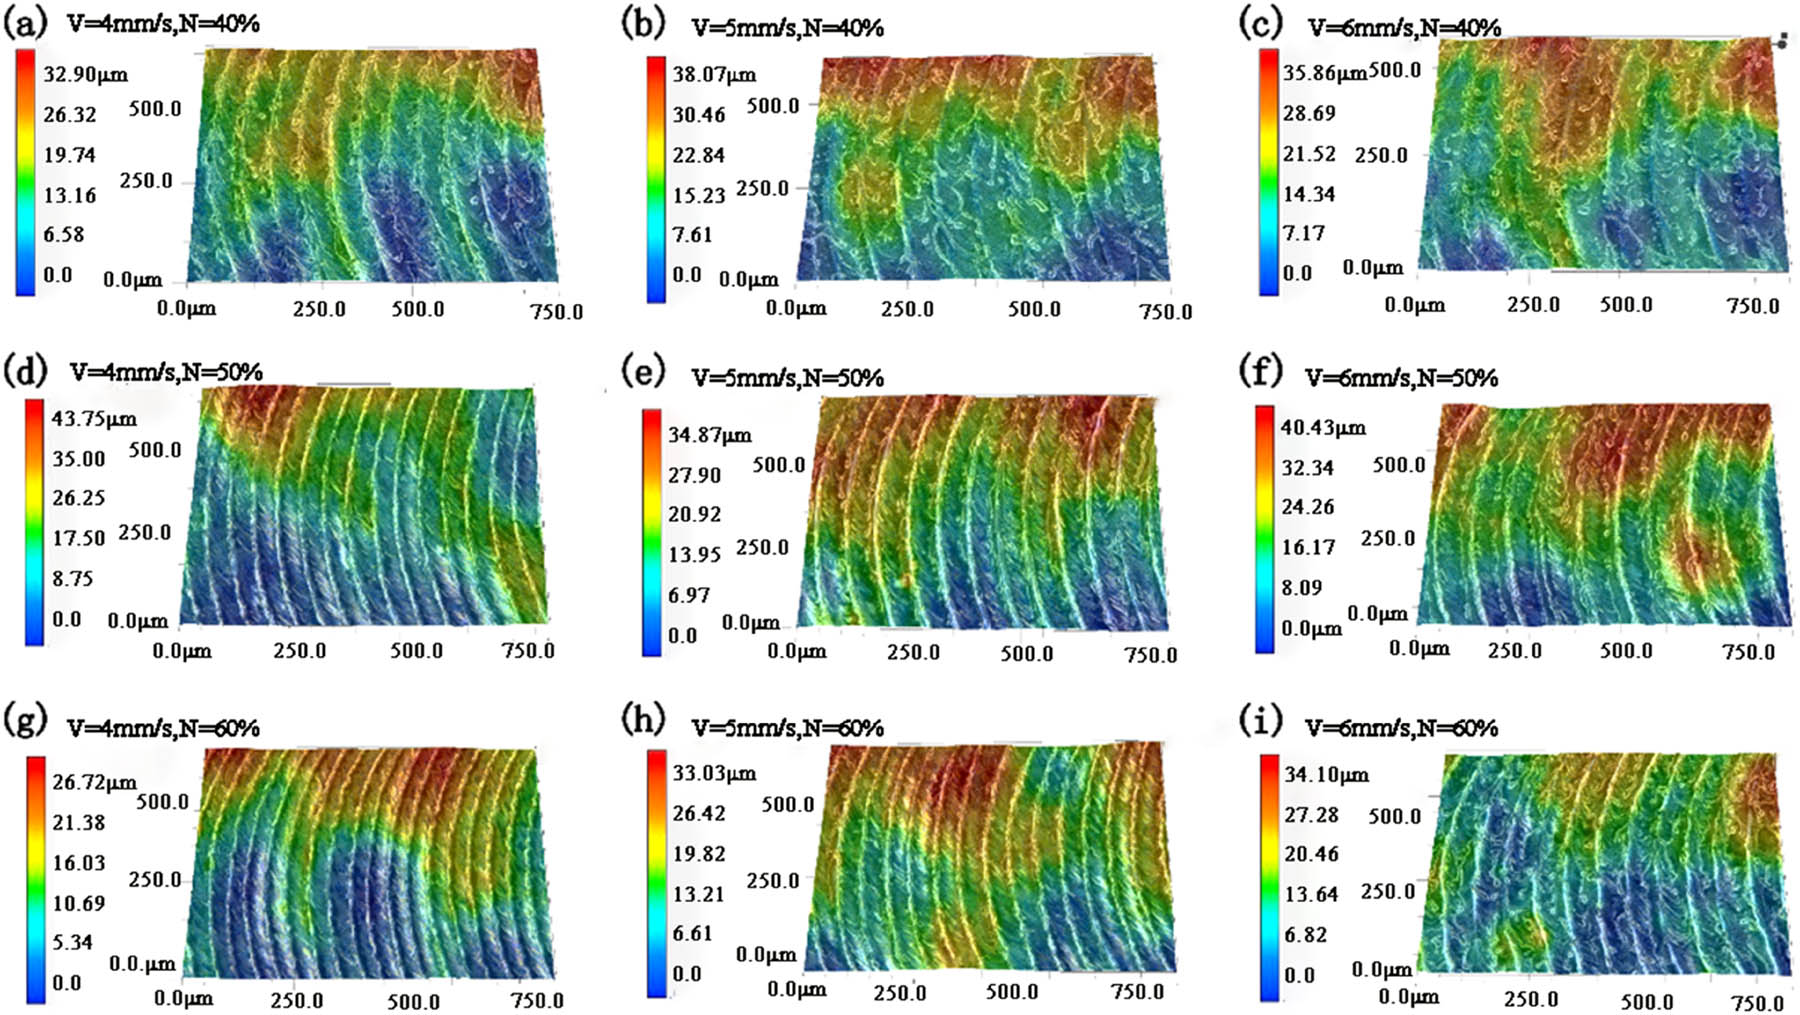
Figure 10
Three-dimensional morphology after 120 W power remelting, samples (a–i) correspond to the process parameters a–i listed in Table 6.
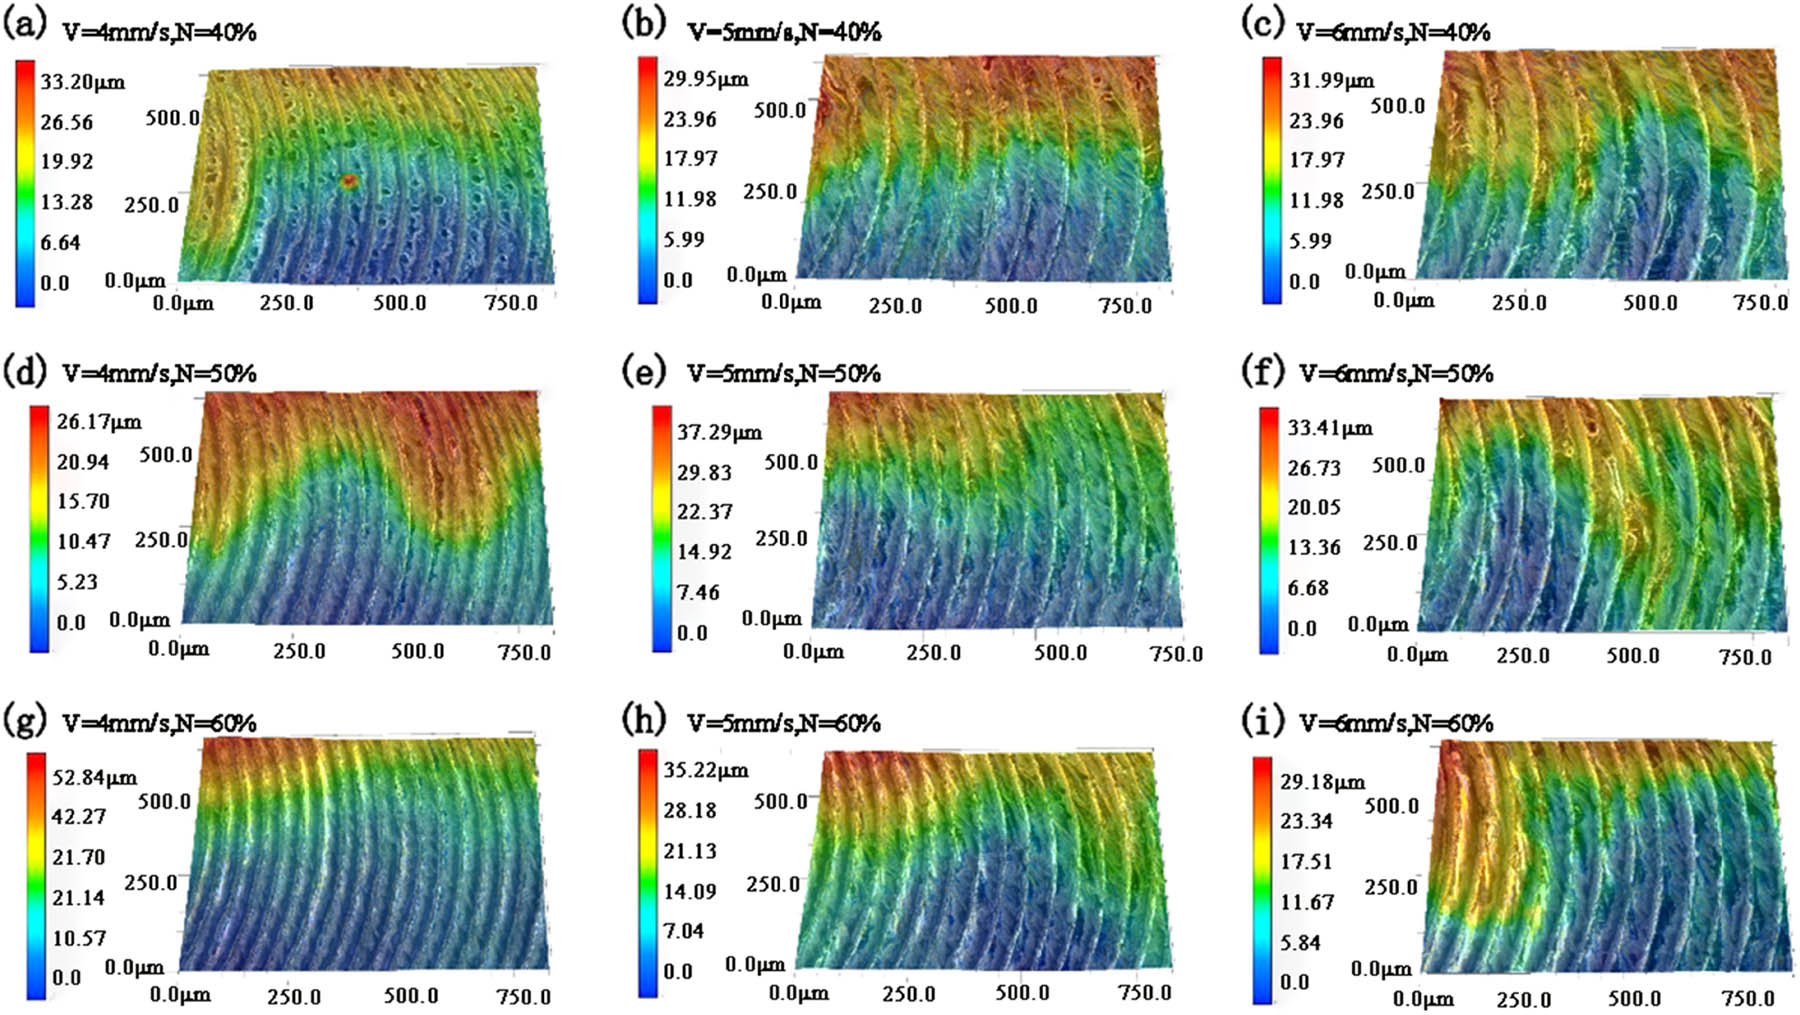
Figure 11
Three-dimensional morphology after 150 W power remelting, samples (a–i) correspond to the process parameters a–i listed in Table 6.
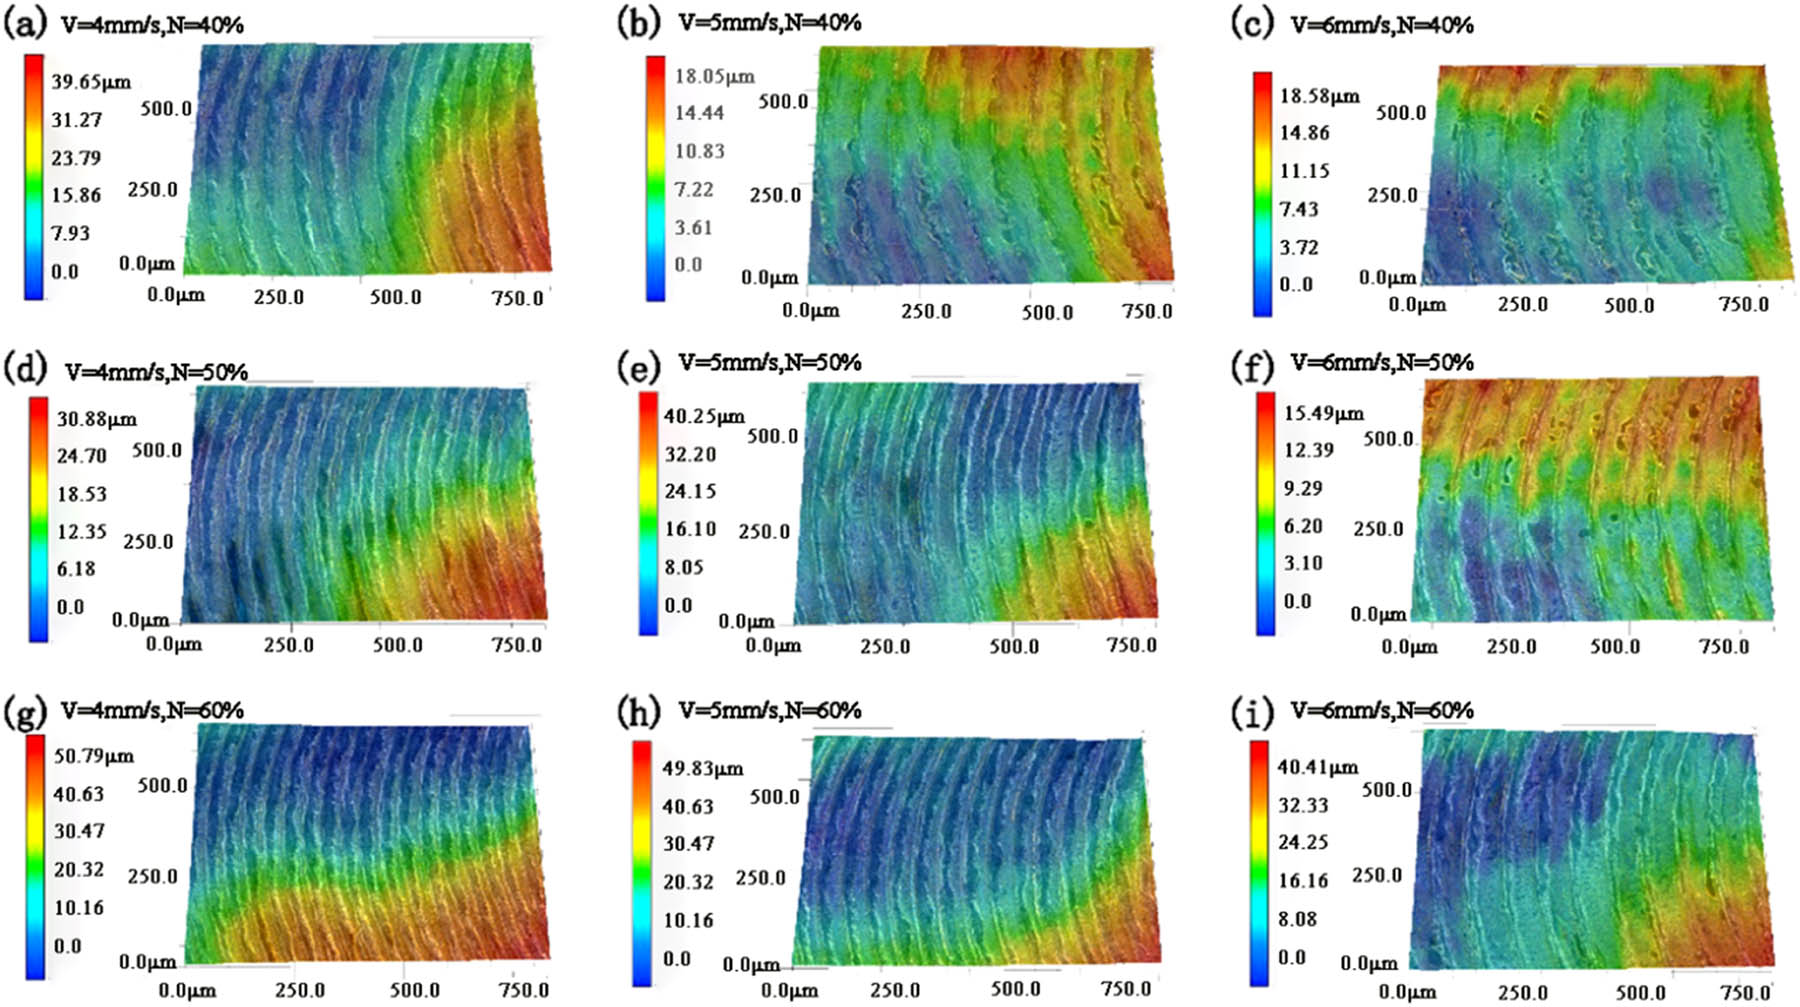
Figure 12
Three-dimensional morphology after 180 W power remelting, samples (a–i) correspond to the process parameters a–i listed in Table 6.
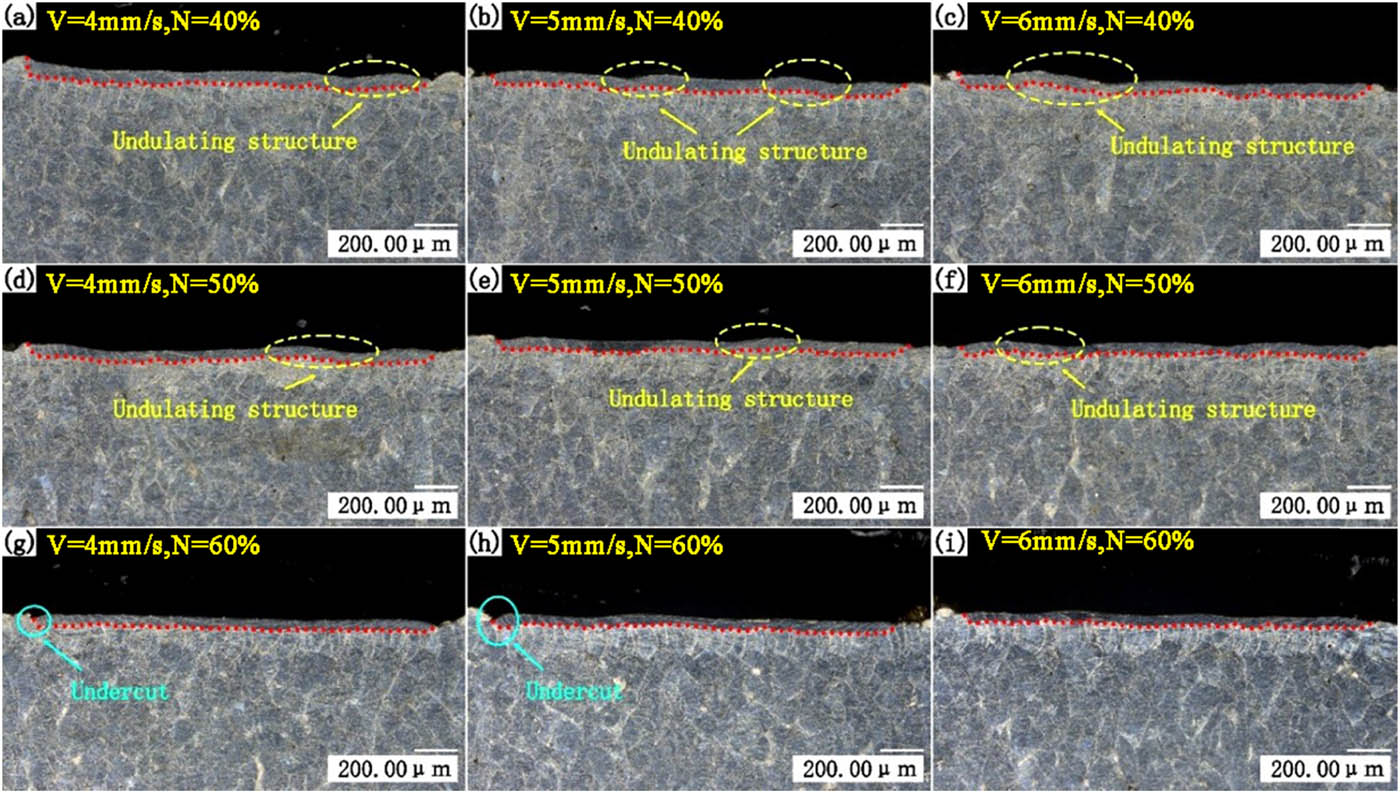
Figure 13
The morphology of the molten pool after 120 W power remelting, samples (a–i) correspond to the process parameters a–i listed in Table 6.
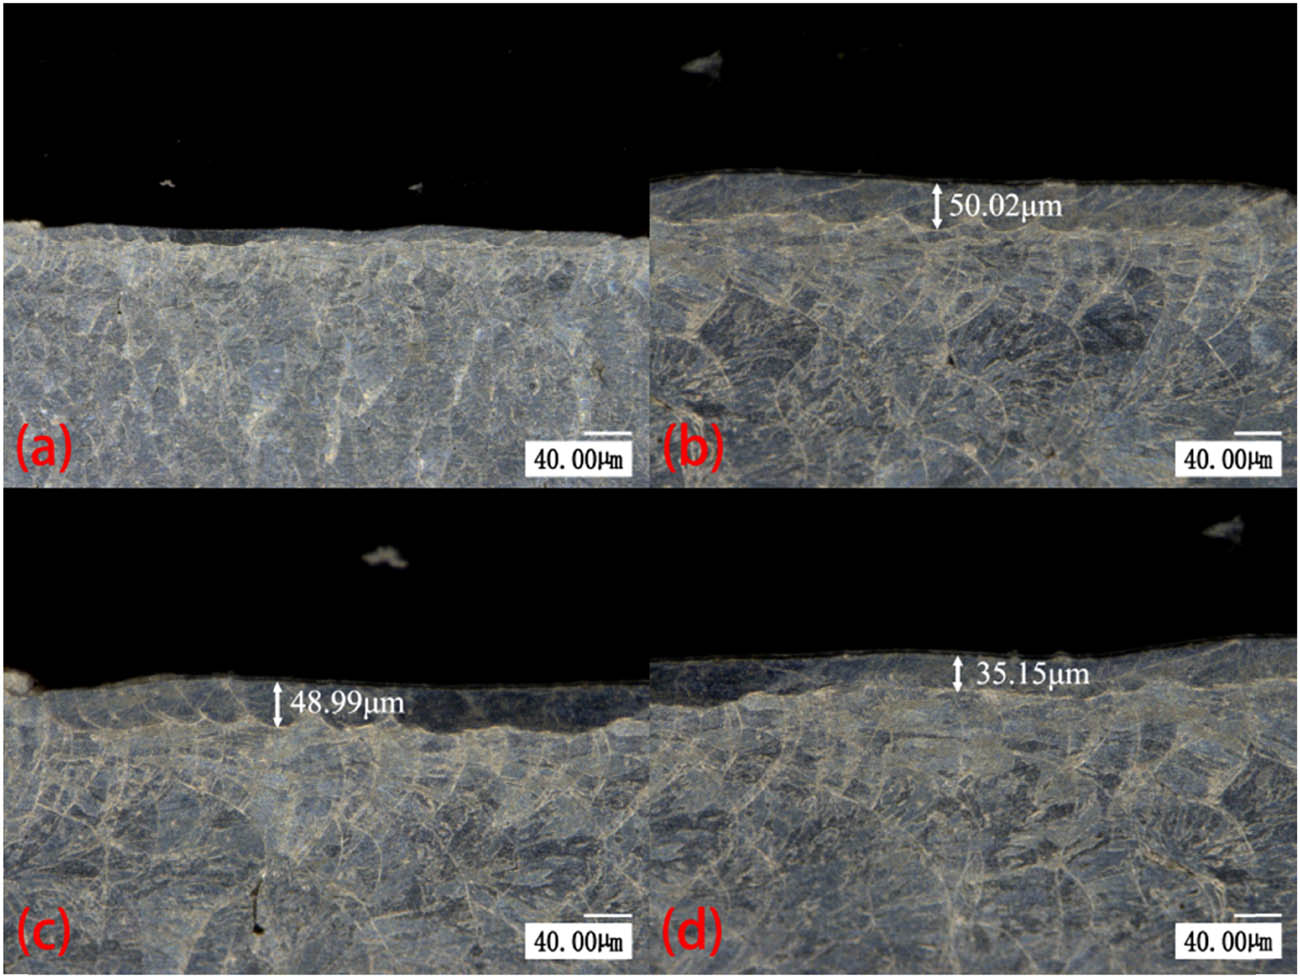
Figure 14
Remelting depth with 120 W, 5 mm/s, and 50% rotation: (a) overall morphology, (b) right side, (c) left side, and (d) central region.
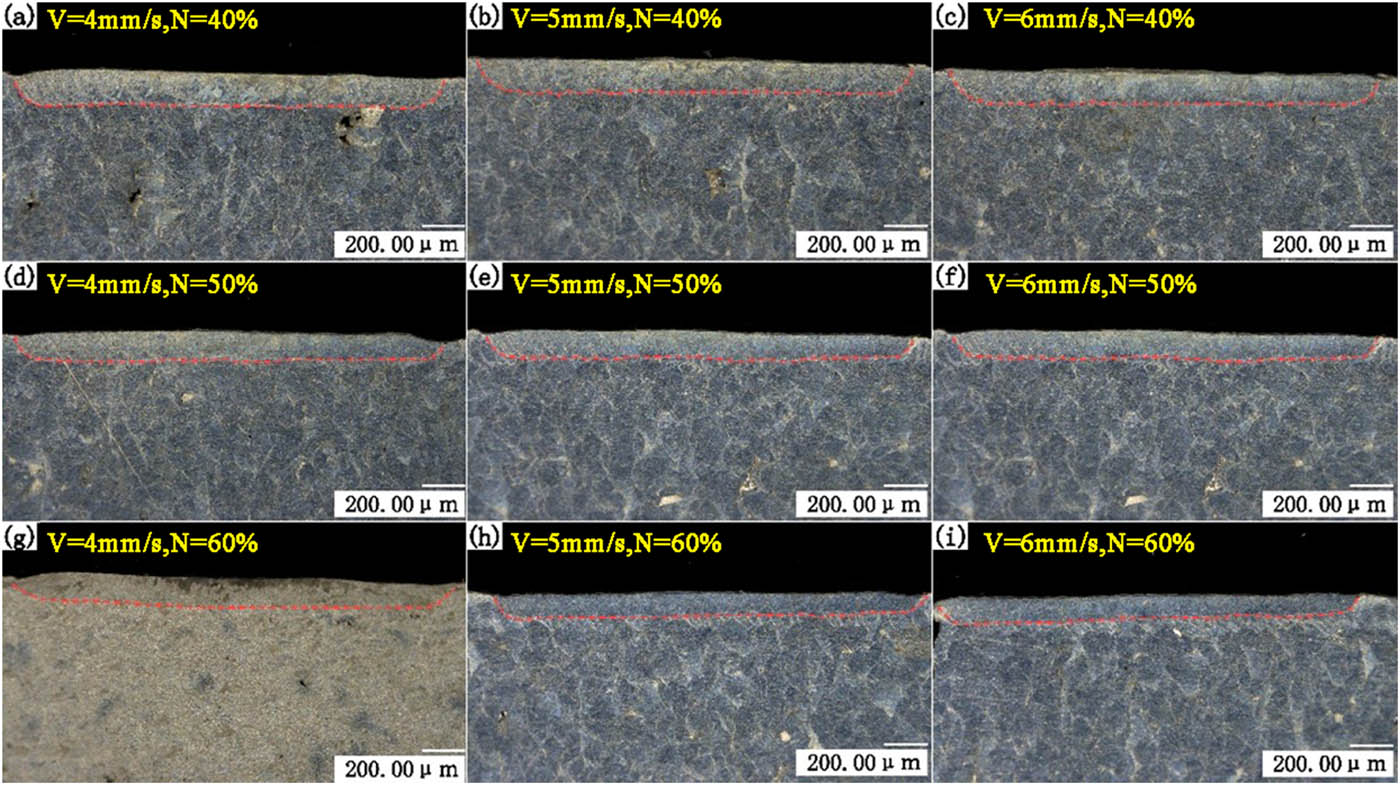
Figure 15
The morphology of the molten pool after 150 W power remelting, samples (a–i) correspond to the process parameters a–i listed in Table 6.
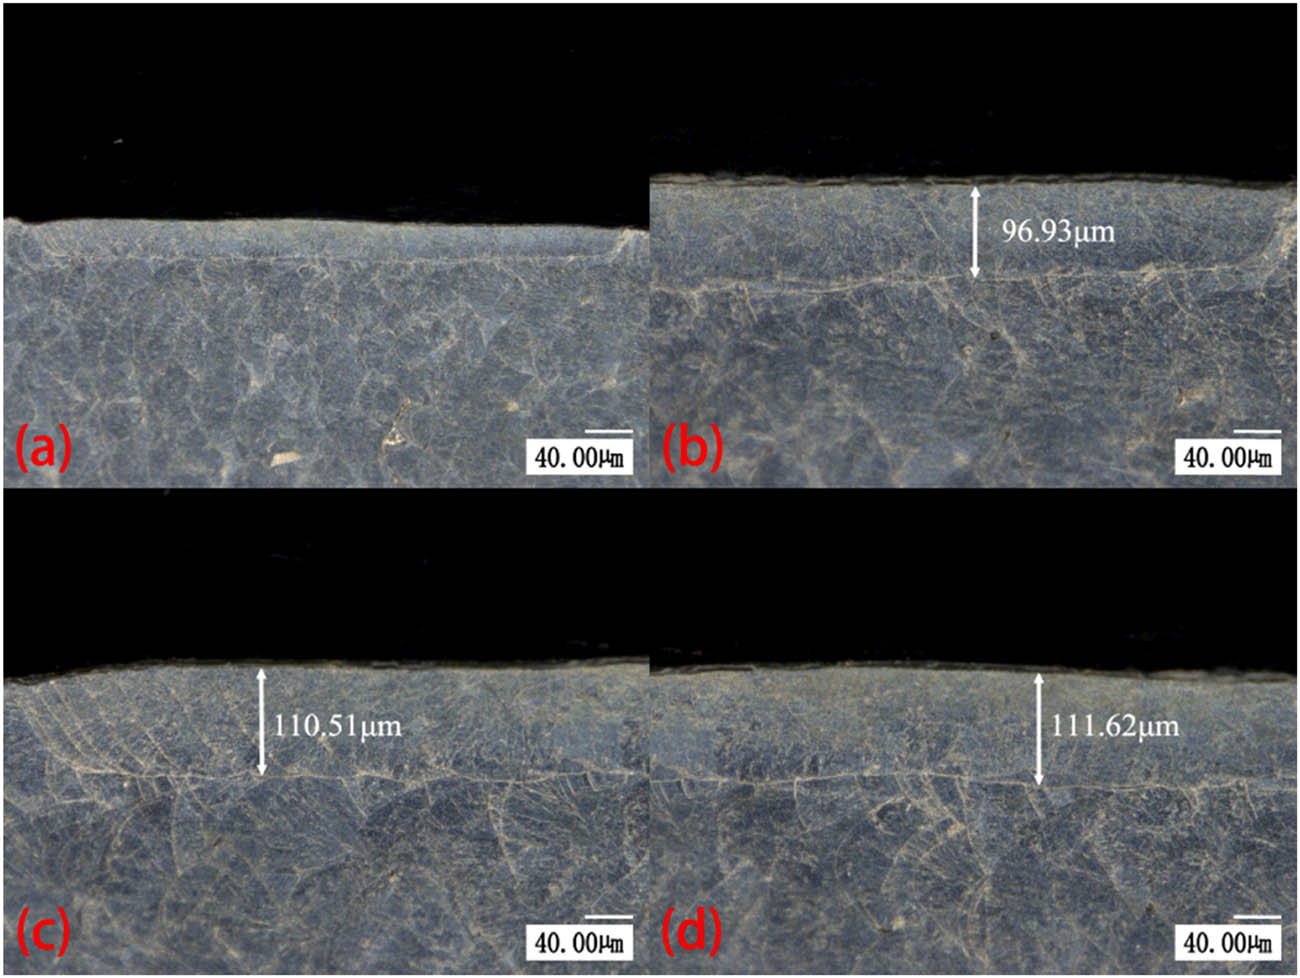
Figure 16
Remelting depth with 150 W, 5 mm/s, 50% rotation: (a) overall morphology, (b) right side, (c) left side, and (d) central region.
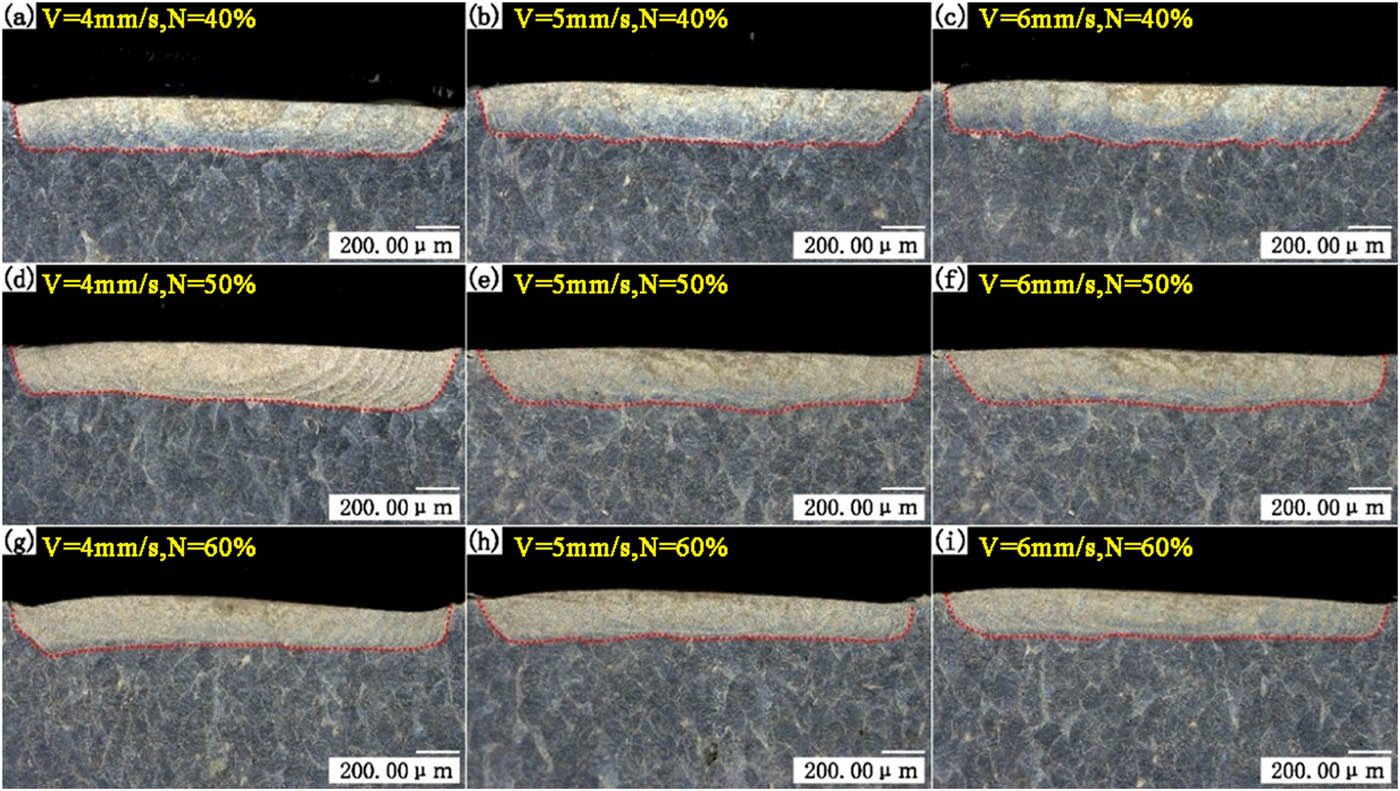
Figure 17
The morphology of the molten pool after 180 W power remelting, samples (a)–(i) correspond to the process parameters a–i listed in Table 6.
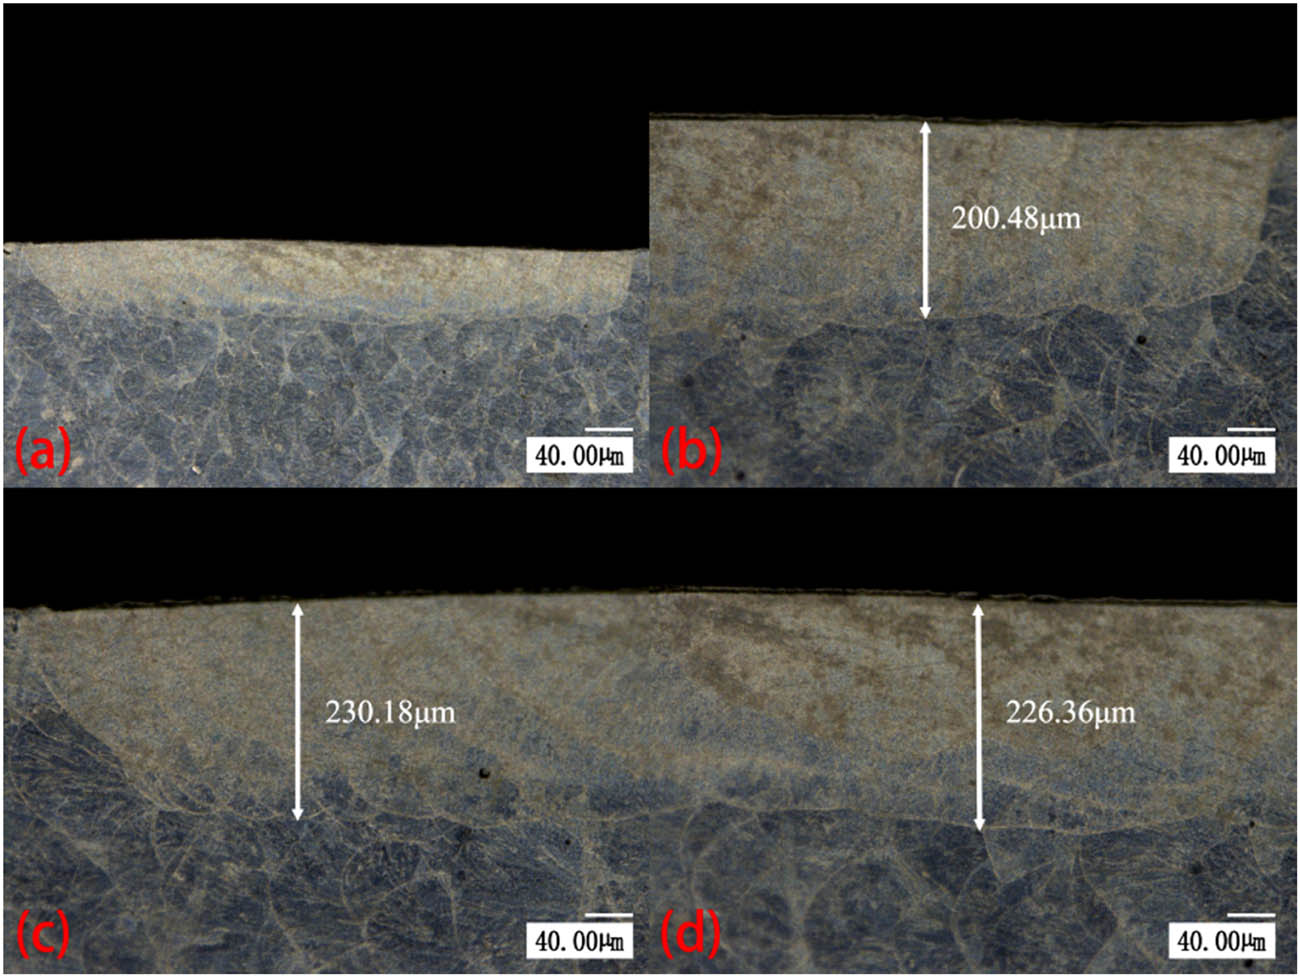
Figure 18
Remelting depth with 180 W, 5 mm/s, 50% rotation: (a) overall morphology, (b) right side, (c) left side, and (d) central region.
Table 7
Variance analysis of roughness difference
| Source | Sum of squares | Df | Mean square | F-value | P-value | |
|---|---|---|---|---|---|---|
| Model | 2.90 | 9 | 0.3219 | 96.19 | <0.0001 | Significant |
| P | 1.98 | 1 | 0.0032 | 591.69 | <0.0001 | |
| N | 0.0528 | 1 | 0.0020 | 15.78 | 0.0054 | |
| V | 0.1485 | 1 | 0.0012 | 44.38 | 0.0003 | |
| PN | 0.0992 | 1 | 0.0001 | 29.65 | 0.0010 | |
| PV | 0.1980 | 1 | 0.0000 | 59.18 | 0.0001 | |
| NV | 0.0256 | 1 | 0.0002 | 7.65 | 0.0279 | |
| P 2 | 0.3917 | 1 | 0.0002 | 117.05 | <0.0001 | |
| N 2 | 0.0007 | 1 | 0.0000 | 0.1966 | 0.6709 | |
| V 2 | 0.0044 | 1 | 1.067E-06 | 1.33 | 0.2868 | |
| Residuals | 0.0234 | 7 | 0.0033 | |||
| Adeq precision = 32.456 | Adj. R 2 = 0.9817 | Pred. R 2 = 0.8717 | R 2 = 0.992 | |||
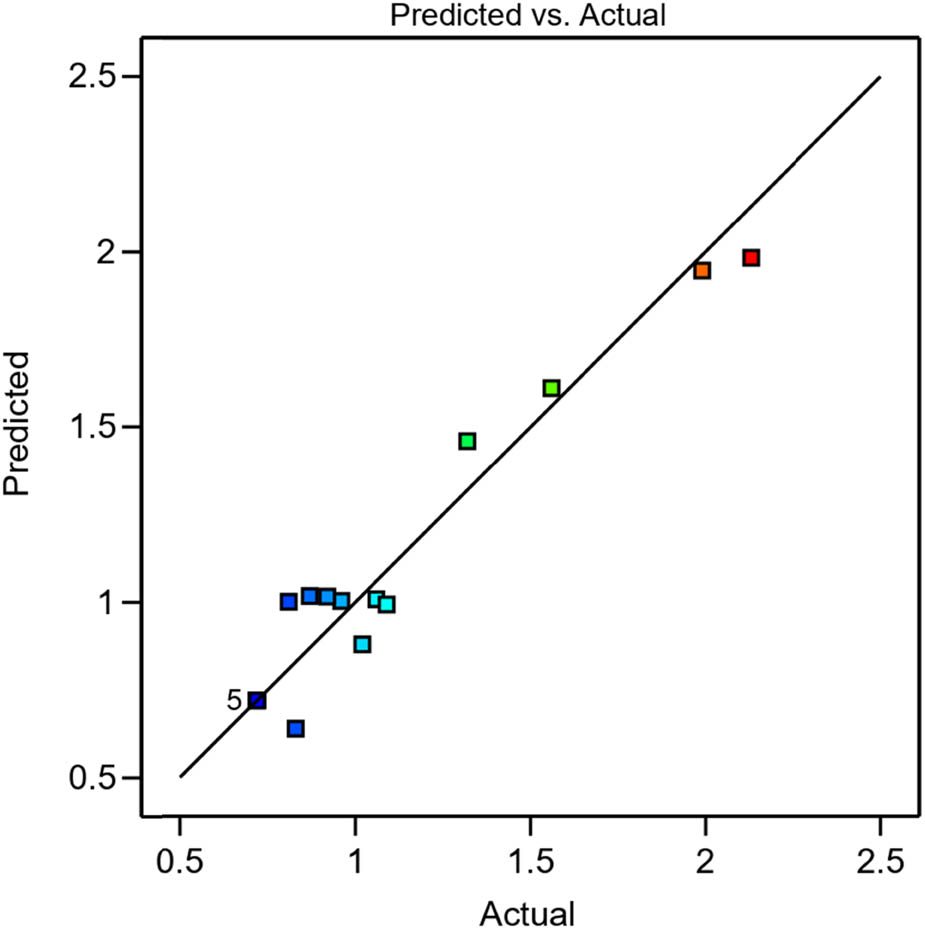
Figure 19
Comparison between actual and predicted roughness difference values.
Table 8
Variance analysis of remelting depth
| Source | Sum of squares | Df | Mean square | F-value | P-value | |
|---|---|---|---|---|---|---|
| Model | 64139.87 | 9 | 7126.65 | 311.30 | <0.0001 | Significant |
| P | 59168.00 | 1 | 59168.00 | 2584.56 | <0.0001 | |
| N | 2346.13 | 1 | 2346.13 | 102.48 | <0.0001 | |
| V | 45.13 | 1 | 45.13 | 1.97 | 0.2031 | |
| PN | 289 | 1 | 289 | 12.62 | 0.0093 | |
| PV | 64 | 1 | 64 | 2.80 | 0.1384 | |
| NV | 0.2500 | 1 | 0.2500 | 0.0109 | 0.9197 | |
| P 2 | 1923.75 | 1 | 1923.75 | 84.03 | <0.0001 | |
| N 2 | 55.33 | 1 | 55.33 | 2.42 | 0.1640 | |
| V 2 | 133.22 | 1 | 133.22 | 5.82 | 0.0466 | |
| Residuals | 160.25 | 7 | 22.89 | |||
| Adeq precision = 56.2042 | Adj. R 2 = 0.9943 | Pred. R 2 = 0.9601 | R 2 = 0.9975 | |||
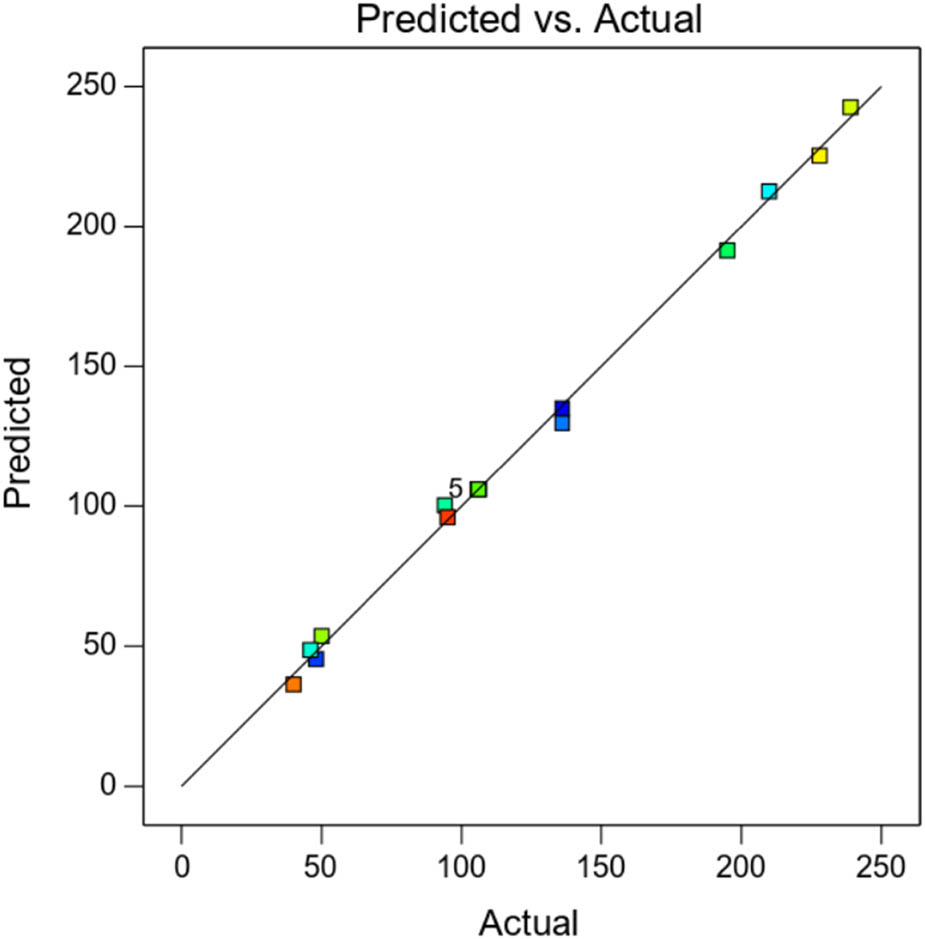
Figure 20
Comparison between actual and predicted values of the difference in depth of the molten pool.
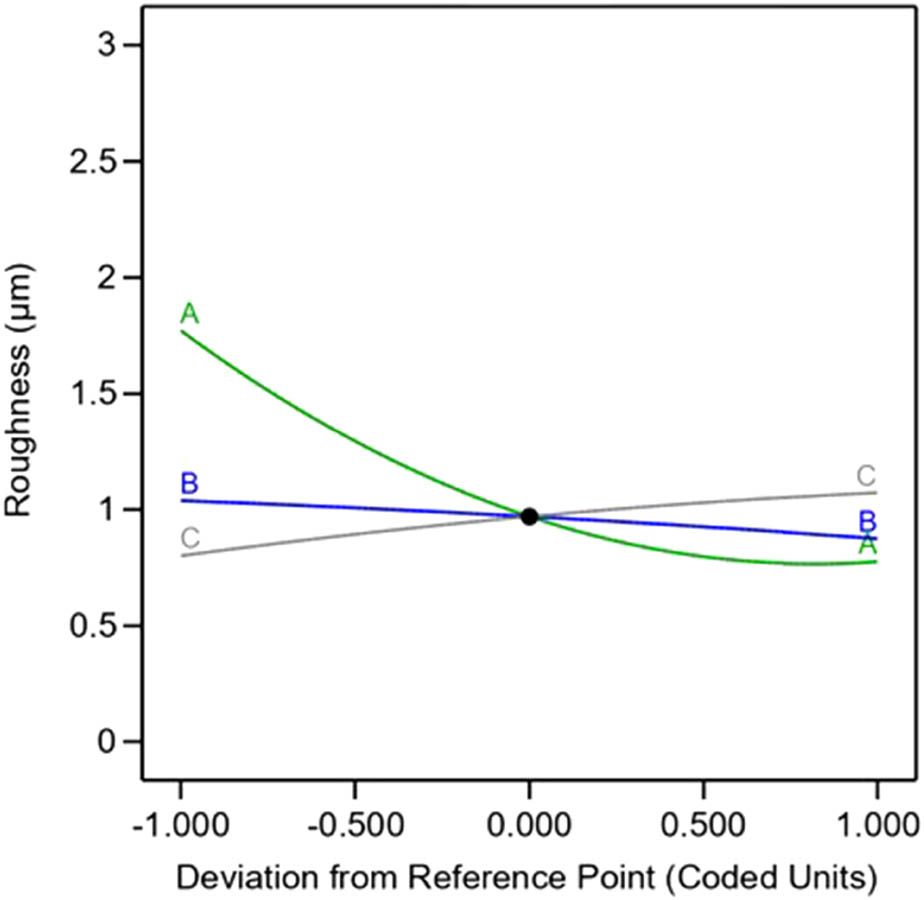
Figure 21
Disturbance diagram of roughness.
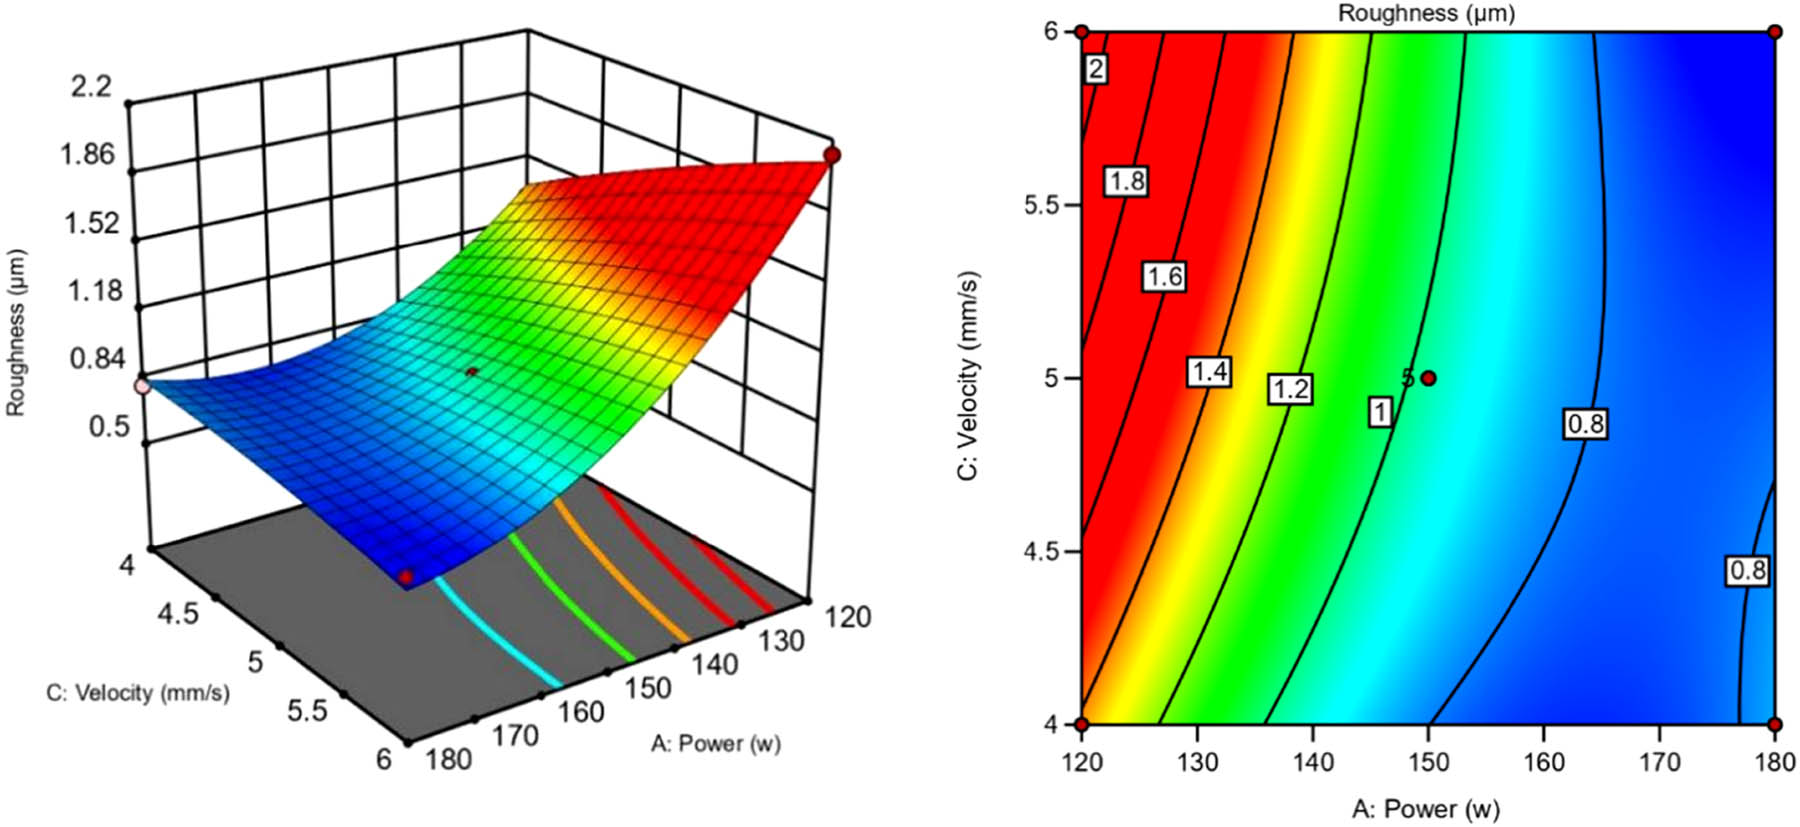
Figure 22
Contour lines and response surfaces of the interaction between laser power and scanning speed.
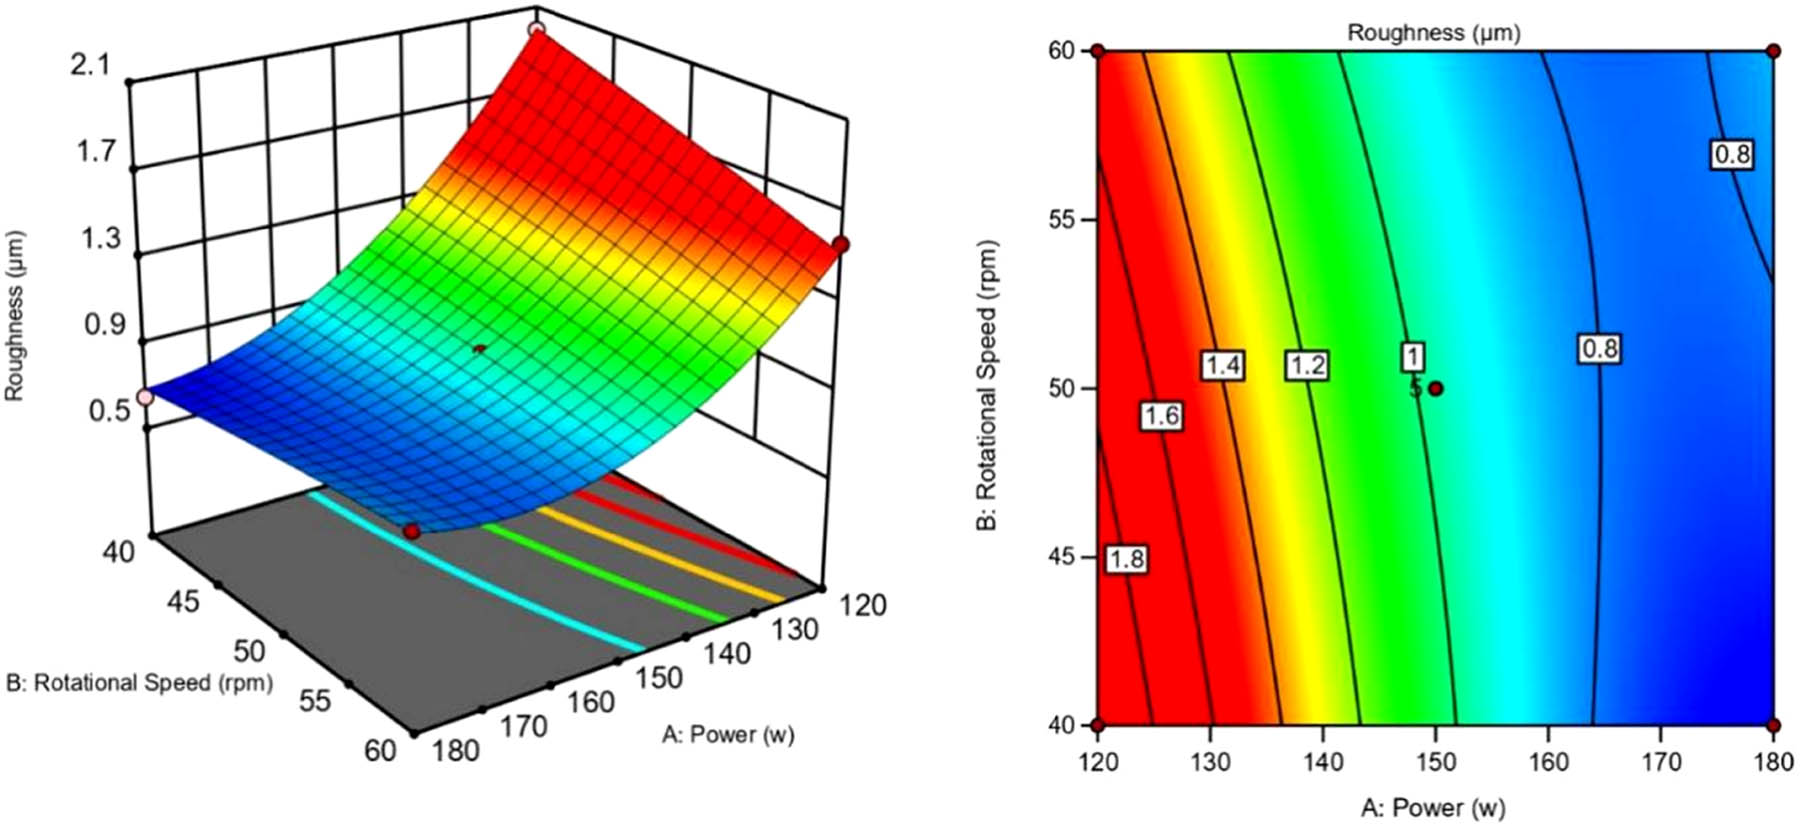
Figure 23
Contour lines and response surfaces of the interaction between laser power and rotational speed.
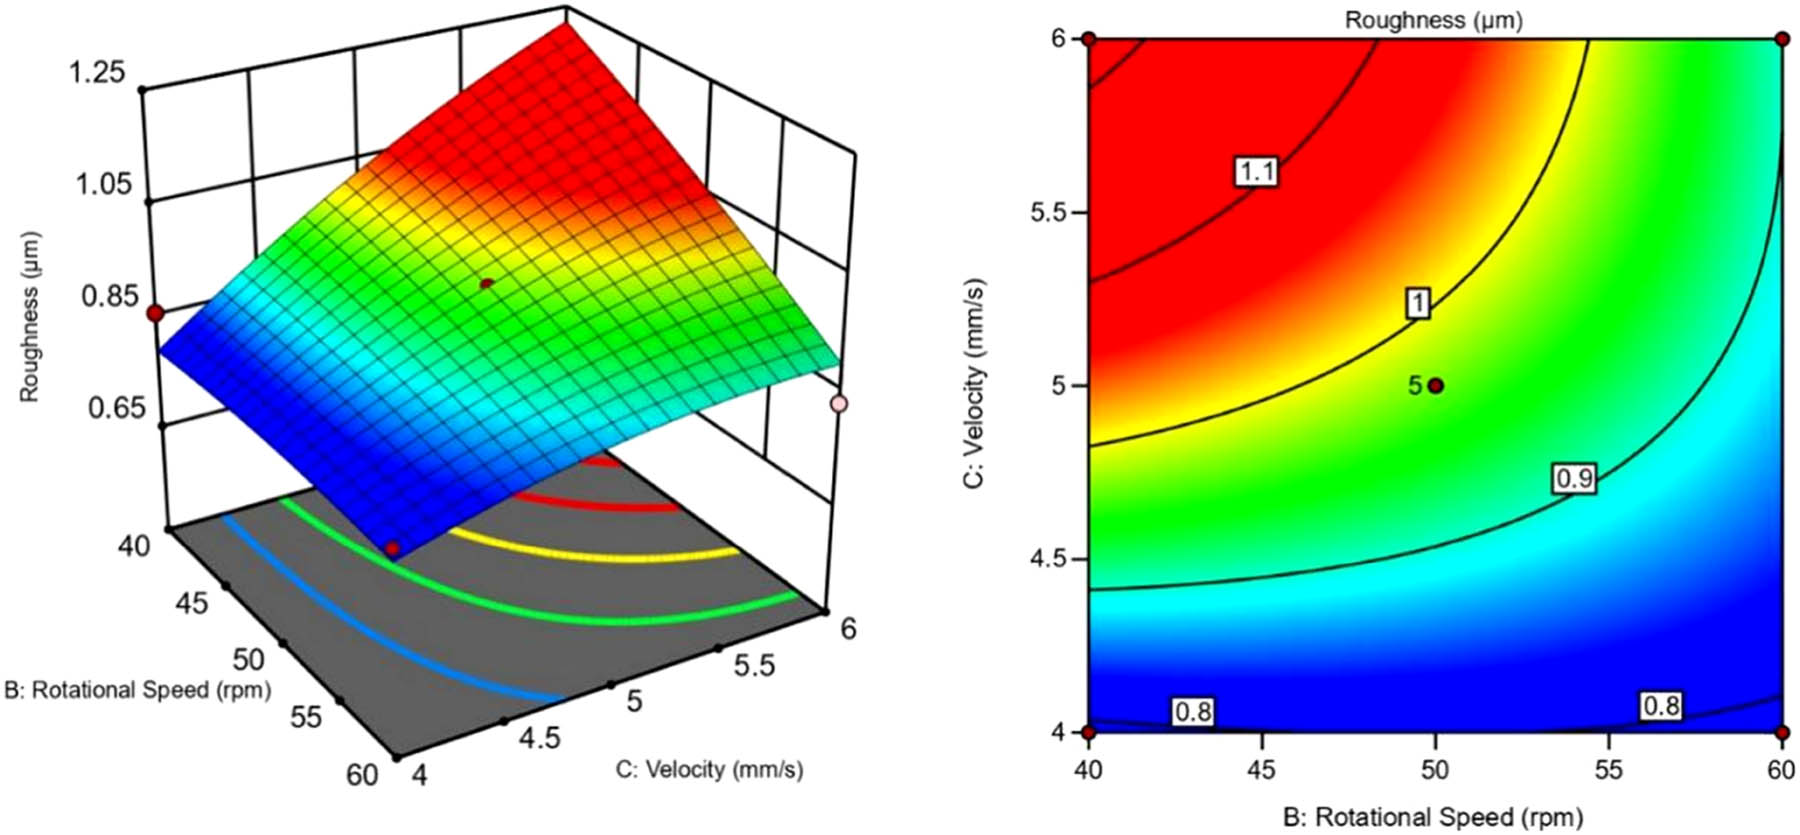
Figure 24
Interaction between scanning speed and rotational speed contour lines and response surfaces.
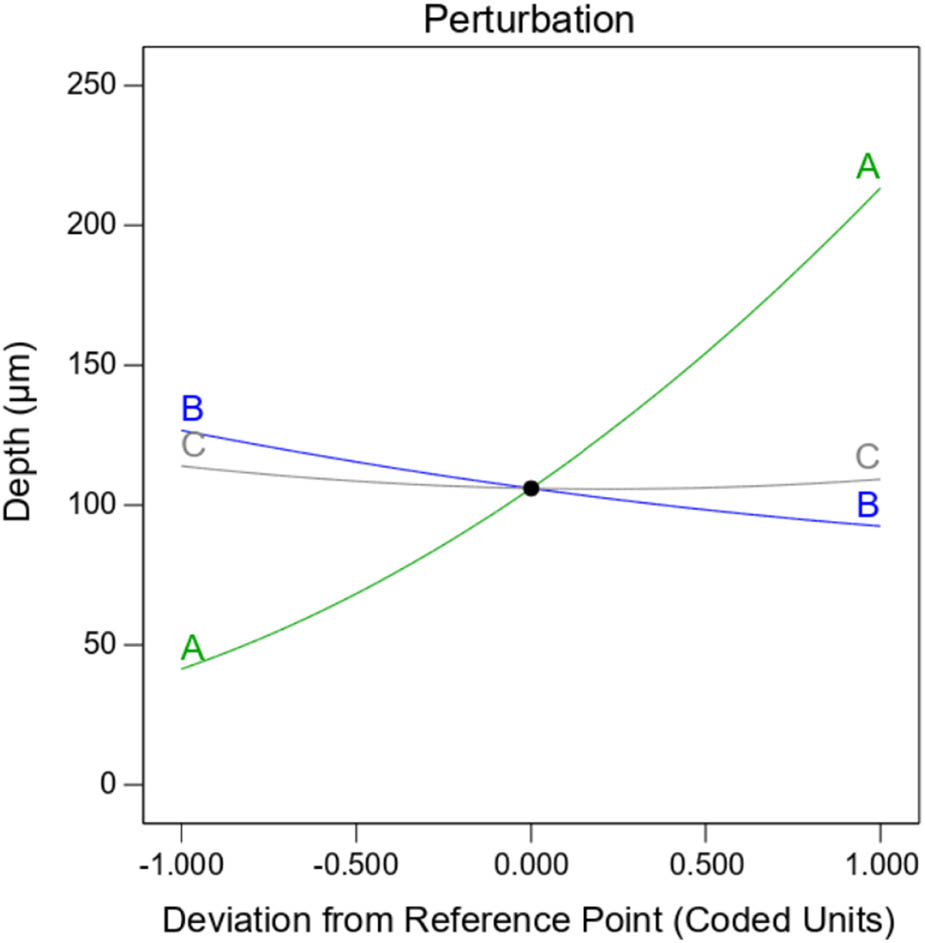
Figure 25
Disturbance diagram of molten pool depth.
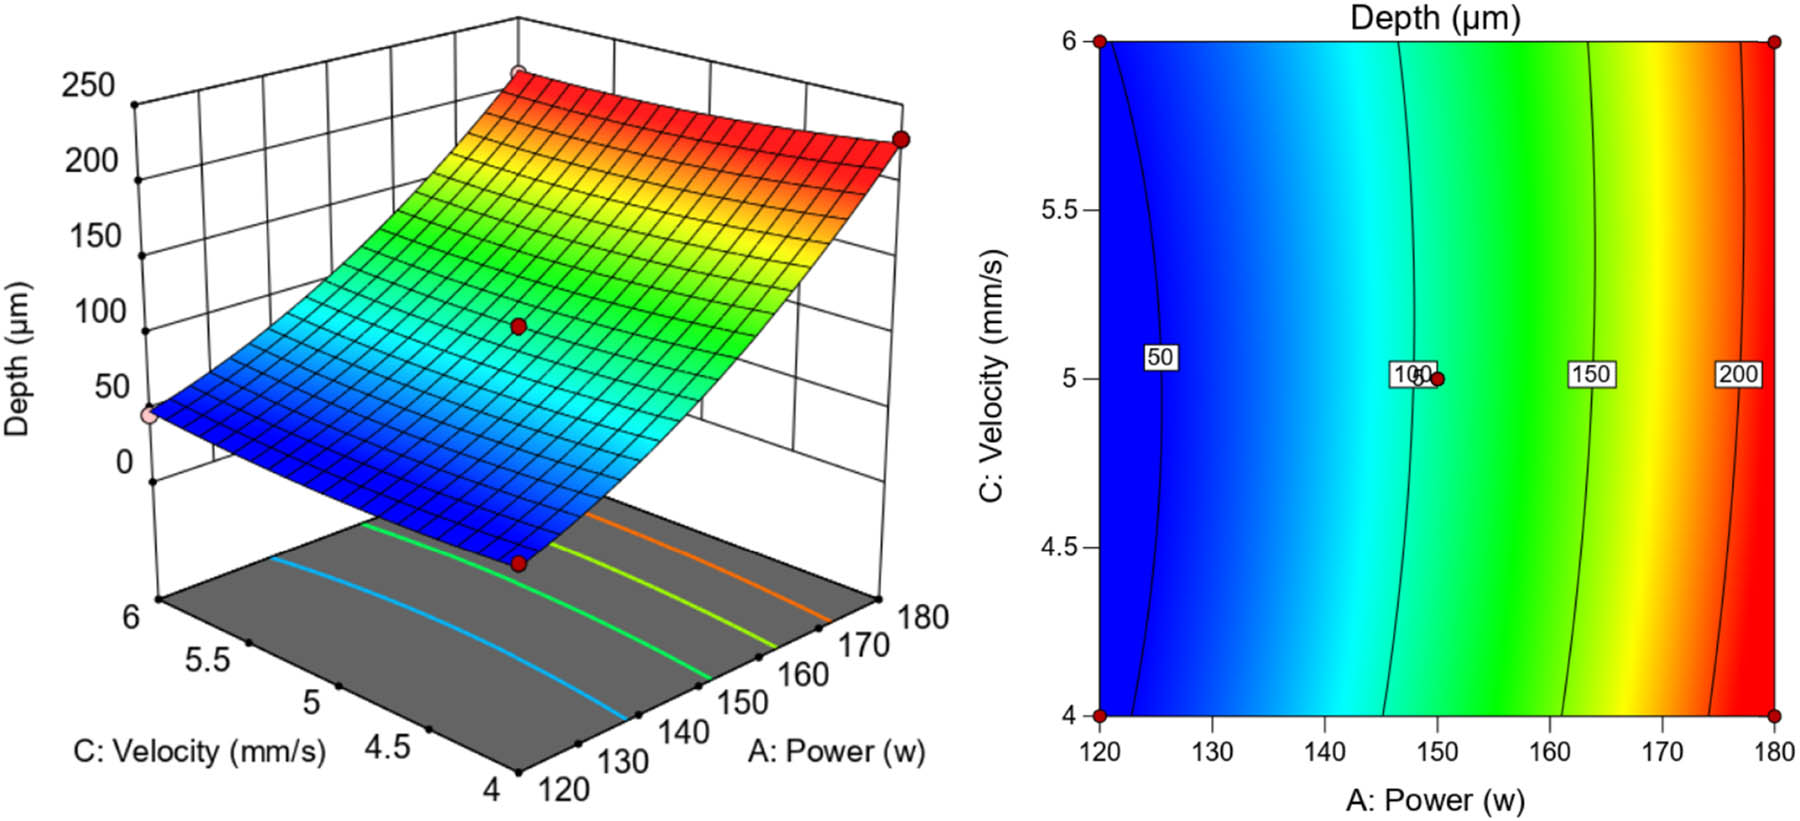
Figure 26
Contour lines and response surfaces of the interaction between laser power and scanning speed.
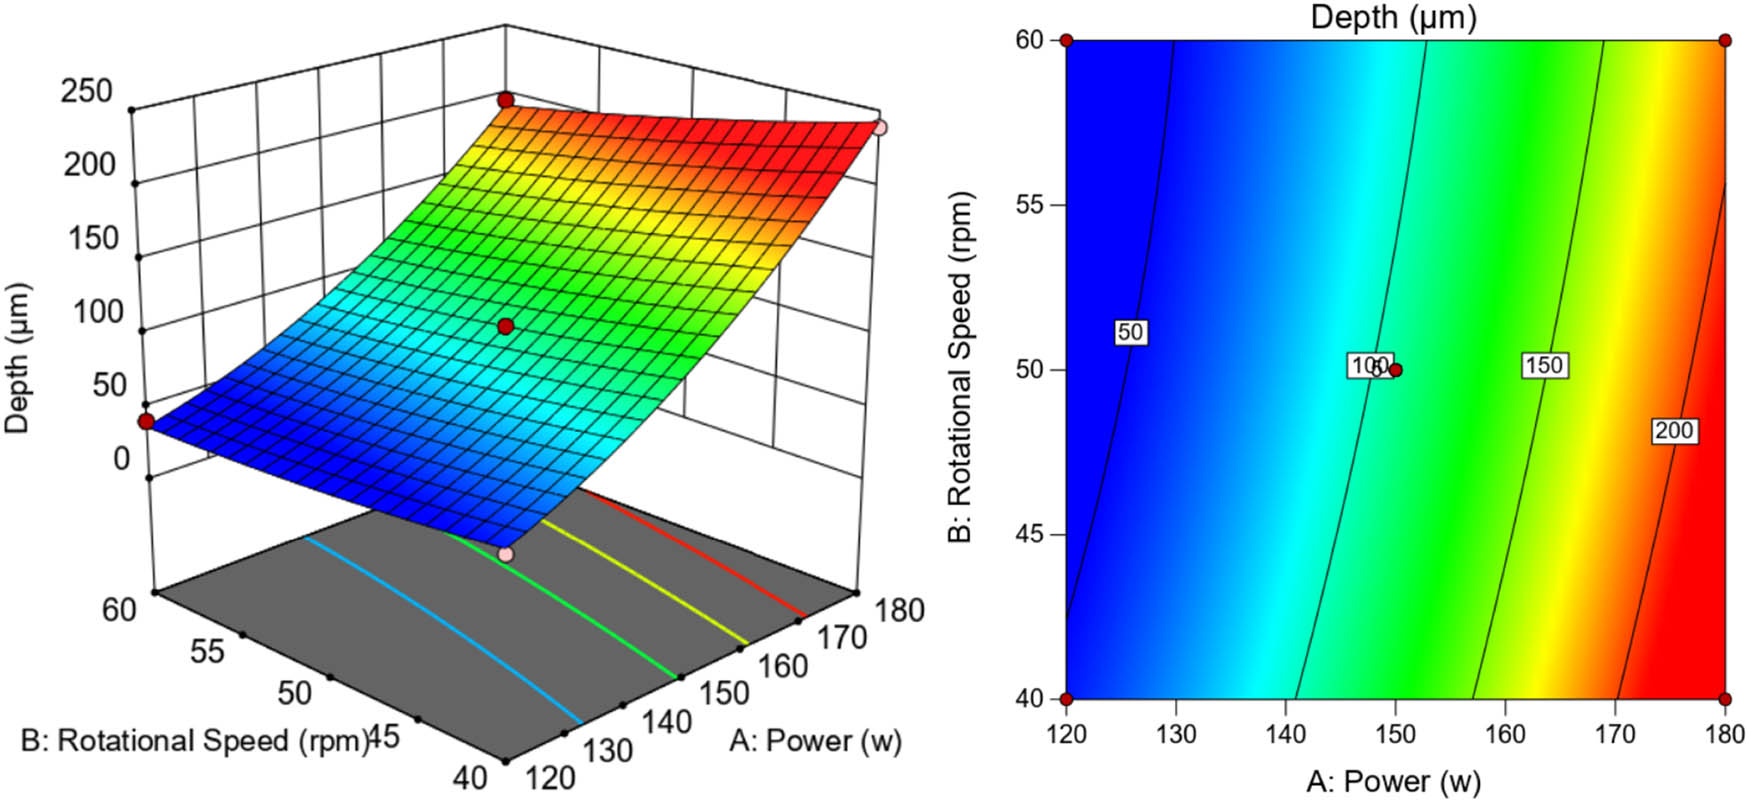
Figure 27
Contour lines and response surfaces of the interaction between laser power and rotational speed.
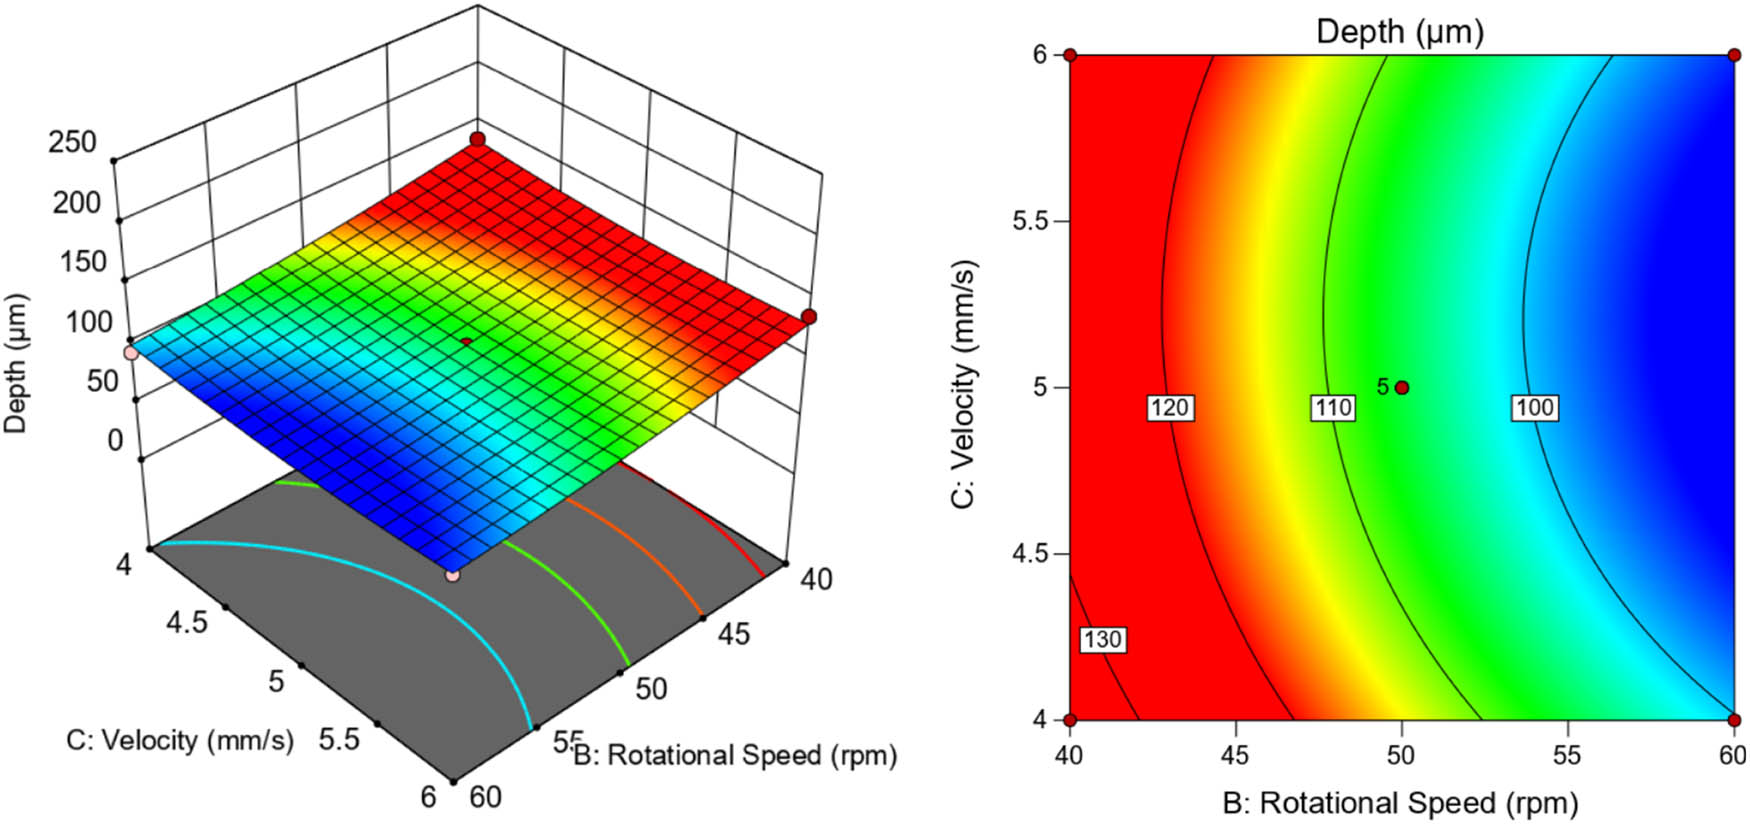
Figure 28
Interaction between scanning speed and rotational speed contour lines and response surfaces.
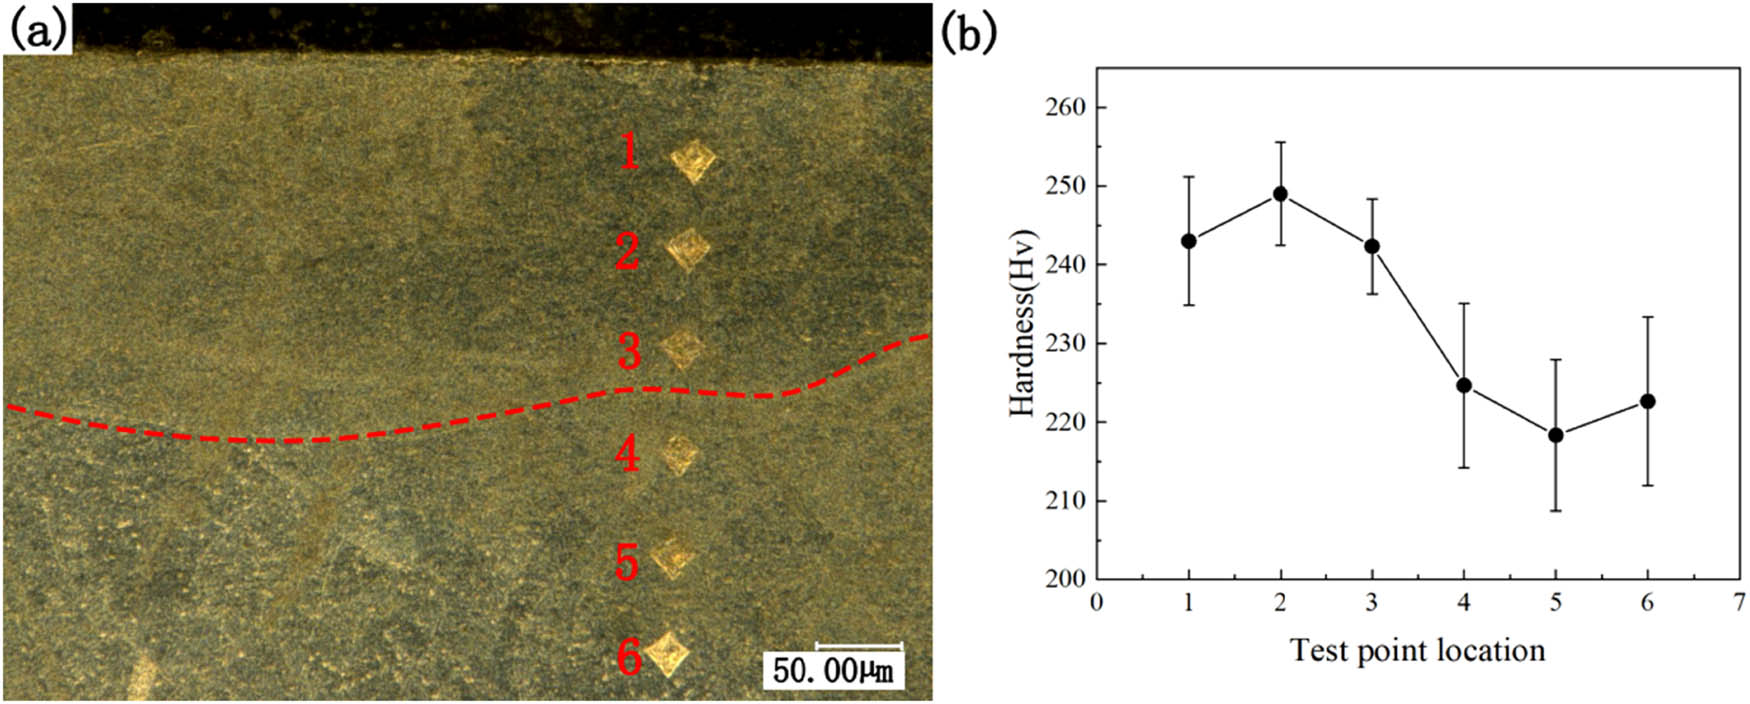
Figure 29
Microhardness test results: (a) longitudinal measurement locations and (b) line graph of measurement data.
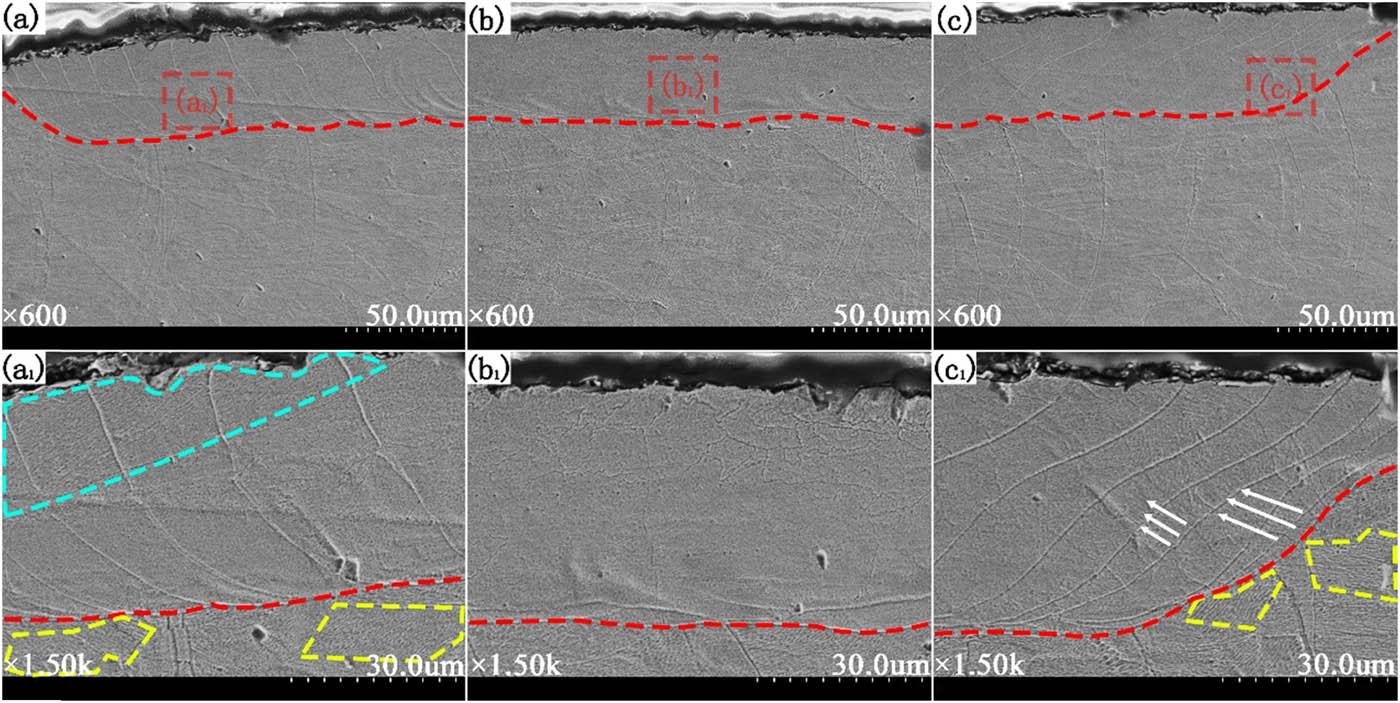
Figure 30
Microscopic morphology of heat affected zone after 120 W power remelting: (a) left side, (b) central region, (c) right side, (a1) magnified view of the a1 region in (a), (b1) magnified view of the b1 region in (b), and (c1) magnified view of the c1 region in (c).
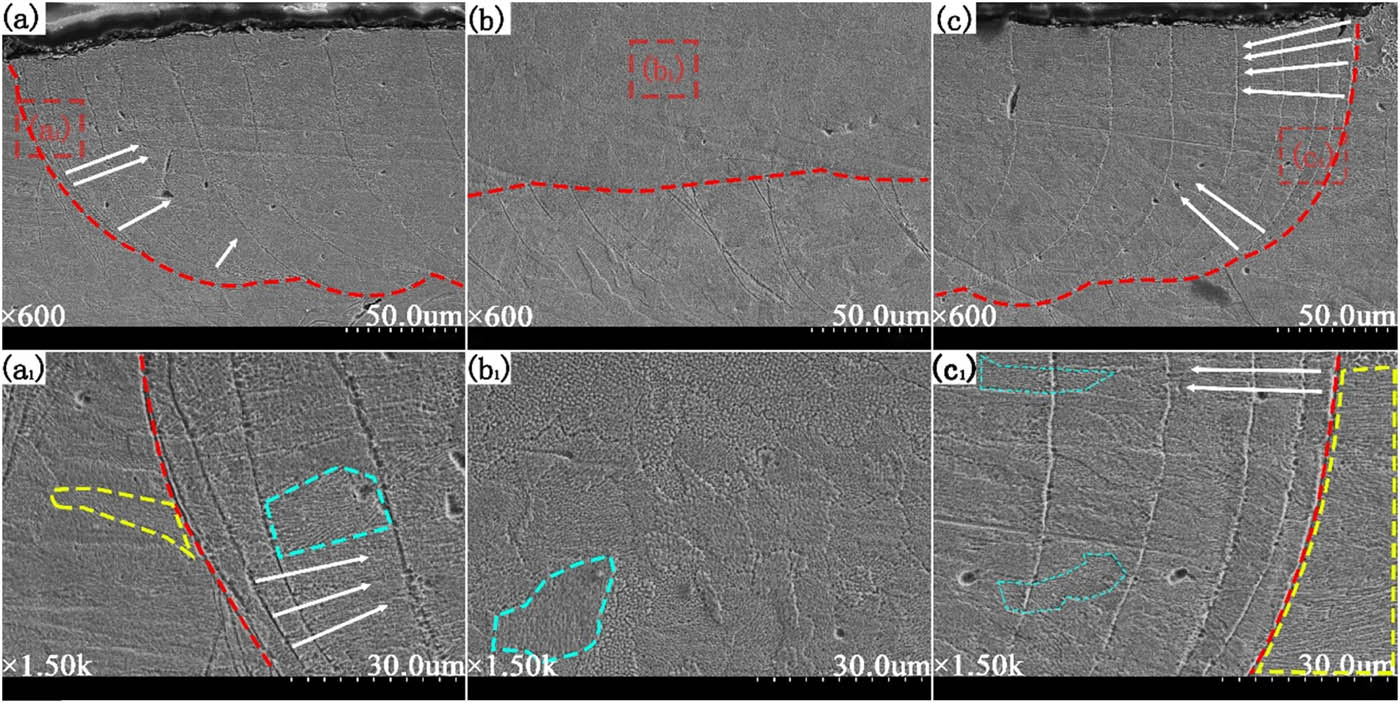
Figure 31
Microscopic morphology of heat-affected zone after 150 W power remelting: (a) left side, (b) central region, (c) right side, (a1) magnified view of the a1 region in (a), (b1) magnified view of the b1 region in (b), and (c1) magnified view of the c1 region in (c).
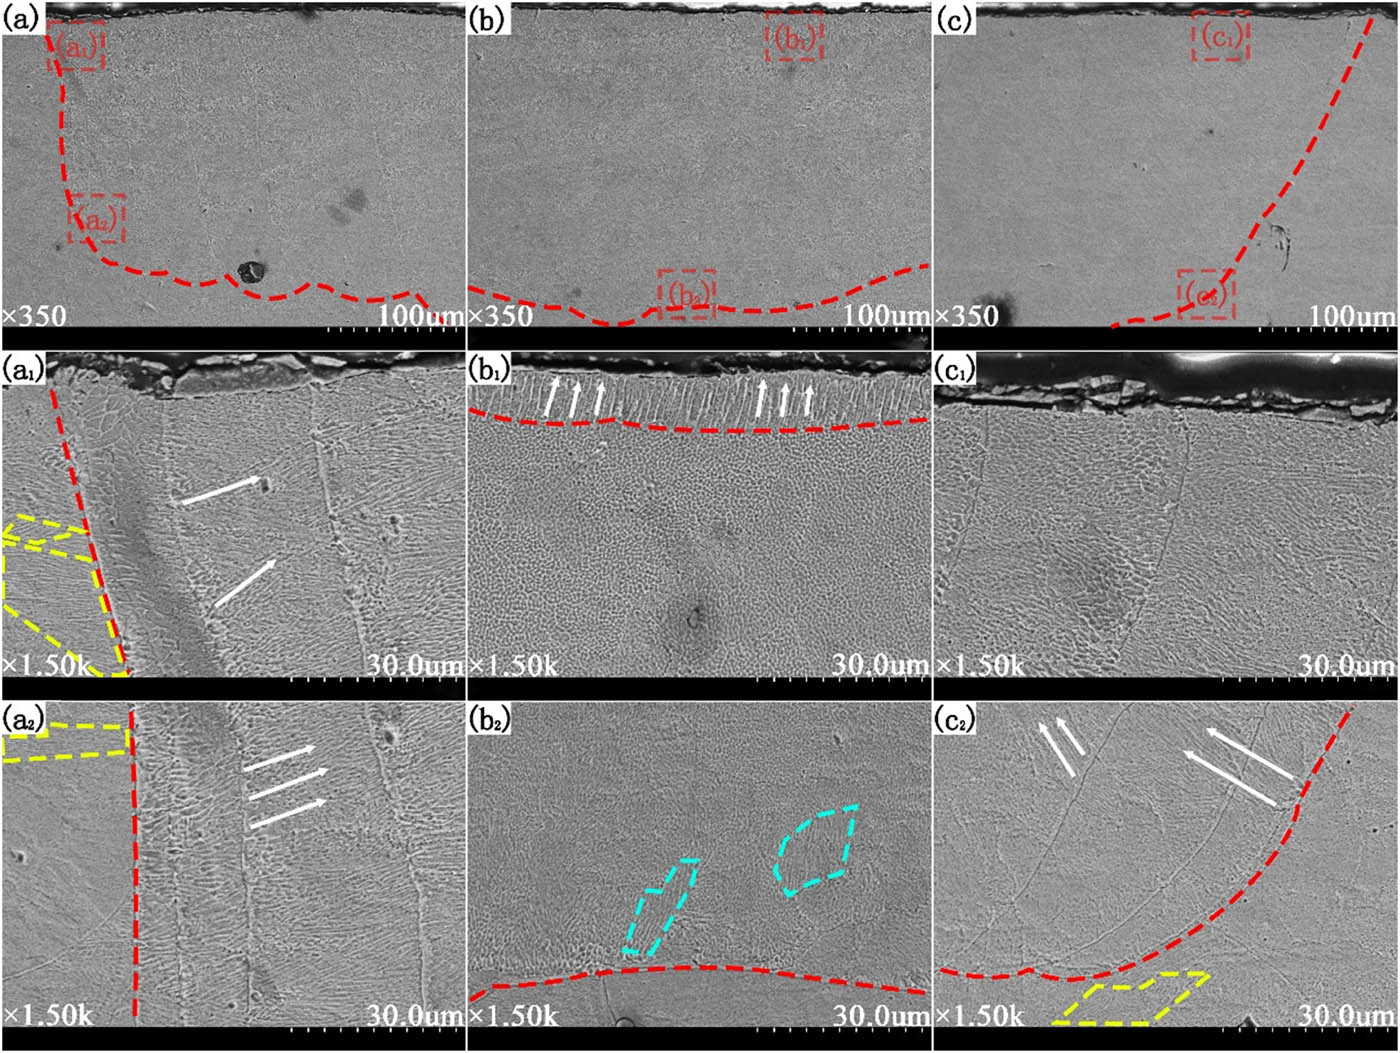
Figure 32
Microscopic morphology of heat-affected zone after 180 W power remelting: (a) left side, (b) central region, (c) right side, (a1) magnified view of the a1 region in (a), (b1) magnified view of the b1 region in (b), (c1) magnified view of the c1 region in (c), (a2) magnified view of the a2 region in (a), (b2) magnified view of the b2 region in (b), and (c2) magnified view of the c2 region in (c).