
1. Introduction
In recent years, additive manufacturing (AM) technology has demonstrated significant advantages in metal component fabrication, such as near-net-shape forming, high material utilization, and the ability to produce complex geometries difficult to achieve with conventional methods [1]. While some AM processes can achieve refined microstructures and high strength through rapid solidification, powder-bed-based techniques including selective laser sintering (SLS) often produce parts with porosity, microcracks, and poor surface finish, which compromise performance and reliability. 316L stainless steel, a representative high-performance austenitic alloy, offers excellent mechanical properties, corrosion resistance, and formability [2–5], making it widely used in demanding environments. However, the defect-prone nature of as-built AM 316L components often necessitates postprocessing to meet service requirements.
Extensive research has been devoted to additively manufactured metallic materials, with emphasis on microstructural characteristics, strain hardening behavior, deformation mechanisms, and anisotropy [6–9]. Jandaghi et al. [10] systematically investigated the influence of process parameters on the preparation of 316L stainless steel powder by gas atomization. The results showed that increasing the atomization pressure effectively reduced the powder particle size, while a nozzle design with a composite structure of holes, slits, and grooves significantly improved the fine powder yield. Kamath et al. [11] studied 316L stainless steel prepared by selective laser melting (SLM) and found that higher laser power led to higher material density. Li et al. [12] investigated the quasi-static mechanical properties of traditionally rolled and additively manufactured 316L stainless steel and found that the yield strength of the AM material reached nearly three times that of the rolled counterpart, with finer and more uniform dimples on the fracture surface. They also observed that increasing the printing inclination angle significantly increased strength but noticeably reduced toughness. Zhang et al. [13] systematically studied the influence of seven different printing directions on the mechanical properties of AM 316L stainless steel and found that the sample exhibited optimal strength when the material deposition direction was perpendicular to the tensile load direction.
Galy et al. [14] reported that gas in AM mainly originates from inert gas entrapped during powder preparation and gaseous products from high-temperature evaporation of alloying elements. Other studies have shown that spatter droplets generated during the process can be carried by the scraper during powder spreading, forming periodically distributed pores inside the material [15]. Zhao [16] and Larrosa et al. [17] used computed tomography (CT) to characterize internal pore defects in SLM components and systematically investigated their influence on fatigue performance. The studies revealed a negative correlation between pore size and fatigue life, and when the largest pore is oriented perpendicular to the loading direction, stress concentration is more likely to nucleate cracks. The formation of pores is mainly attributed to gas entrapment during rapid solidification: during melting, the liquid metal dissolves a considerable amount of gas, and upon rapid cooling the solubility drops sharply, causing supersaturated gas to precipitate and become entrapped [18]. Cracking is closely linked to residual stresses arising from nonuniform thermal fields, differential shrinkage, and the material’s inherent physical properties [19,20,21,22]. These inherent defects degrade surface integrity and mechanical reliability, highlighting the critical need for effective surface posttreatment.
Laser remelting is a cost-effective and efficient surface treatment that uses a high-energy-density laser beam to rapidly melt the surface layer of an alloy [23]. It requires no additional materials and offers simple equipment and high processing efficiency. During the process, laser energy rapidly melts the surface layer to form a thin molten pool, which is then quickly cooled through efficient heat conduction into the substrate. This extremely fast solidification can refine the grain size, reduce chemical composition segregation, and form special microstructures such as supersaturated solid solutions and metastable phases. These microstructures can significantly improve surface properties, including hardness, wear resistance, and corrosion resistance.
Compared with the traditional nonoscillating laser mode, oscillating laser beams can reduce pores and improve weld formation and microstructural characteristics [24,25,26]. Tsukamoto et al. [27] conducted narrow-gap oscillating laser welding tests on 60 mm and 150 mm thick carbon steel plates in the flat position and found that laser oscillation effectively eliminated incomplete fusion defects and hot cracks; the oscillation amplitude also significantly influenced welding quality. Mann et al. [28] studied the effects of oscillation frequency and spot diameter on the molten pool shape and temperature field in laser welding of high-strength steel. Their results showed that increasing the spot diameter enlarged the molten pool, whereas higher oscillation frequency improved the formation of weld edges. Li et al. [29] investigated the effects of oscillating laser welding on the dynamic behaviors of vapor plume, molten pool, and keyholes, finding that higher oscillation frequency improved vapor plume stability. Fetzer et al. [25] studied the influence of laser oscillation on keyholes during deep-penetration laser welding of aluminum alloys and observed that nonoscillating welding tended to produce process pores, whereas circular oscillating welding resulted in almost pore-free welds. Jiang et al. [30] studied oscillating laser welding of Invar alloy and found that laser oscillation altered the energy distribution on the sample surface and transformed the solidification structure from columnar dendrites to equiaxed grains. Zhang et al. [31] studied the influence of oscillation parameters on porosity during deep-penetration laser welding of Al–6Mg alloy and demonstrated that larger oscillation frequency and amplitude were more effective in suppressing pores. Li et al. [32] studied the process stability of narrow-gap laser welding with hot stainless steel wire in the vertical position and found that vertical-up welding was less sensitive to pores than vertical-down welding, while increasing welding speed improved stability and reduced pore formation. Despite these advances, the systematic optimization of circular oscillating laser remelting (COLR) parameters for additively manufactured 316L stainless steel – particularly with respect to surface roughness and subsurface defect elimination – has not been thoroughly explored. In this study, COLR is employed to postprocess SLS-fabricated 316L stainless steel. Response surface methodology (RSM) based on a box-Behnken design is used to analyze the effects of laser power, scanning speed, and rotation speed on surface roughness and melt depth, and to identify optimal processing windows. The evolution of surface morphology, melt pool characteristics, and microstructure is also investigated to reveal the underlying mechanisms.
2. Experimental conditions and methods
2.1. Experimental materials
The experimental samples were rectangular parallelepiped structural parts with dimensions of 30 mm × 20 mm × 3 mm, fabricated by Jiangsu Chuangyi Rapid Prototyping Technology Co., Ltd. via SLS using 316L stainless steel spherical powder. The process parameters used for fabrication were as follows: laser power P = 17.5 W, scanning speed V = 1,600 mm/s, laser spot diameter d = 220 μm, hatch spacing D = 150 μm, layer thickness T = 100 μm, and powder bed preheating temperature = 100°C. The chemical composition of the powder is presented in Table 1.
Table 1
Main chemical compositions of 316L stainless steel
| Elements | C | Cr | Ni | Mo | Si | Mn | P | S |
|---|---|---|---|---|---|---|---|---|
| Mass fraction (%) | 0.0255 | 14.41 | 8.05 | 2.1 | 0.35 ≤ 1.00 | 0.86 | 0.033 | 0.011 |
The SLS process adopts semi-solid liquid phase sintering as its metallurgical mechanism. Under the thermal effect of a laser beam, the powder is partially melted, leading to the rearrangement of solid particles and subsequent solidification of the liquid phase, which bonds the particles and achieves part consolidation. The SLS preparation process includes stages such as CAD model generation, data processing, powder spreading, and sintering [9]. First, a structural model is created using CAD software. The model is then sliced into a series of continuous cross-sectional layers using slicing software, and the contour of each cross-section is obtained. The laser beam selectively sinters the powder material of each layer along a specific trajectory, and the sintered layers are stacked sequentially to build a three-dimensional part.
2.2. Sample cold mounting and measurement
During SLS processing, the high viscosity of the solid–liquid mixture and poor melt pool fluidity often lead to defects such as powder spheroidization, cracks, and pores. The samples were cold-mounted, ground, and polished. Cross-sections were then observed using an extended depth-of-field microscope, revealing numerous subsurface defects, as shown in Figure 1.
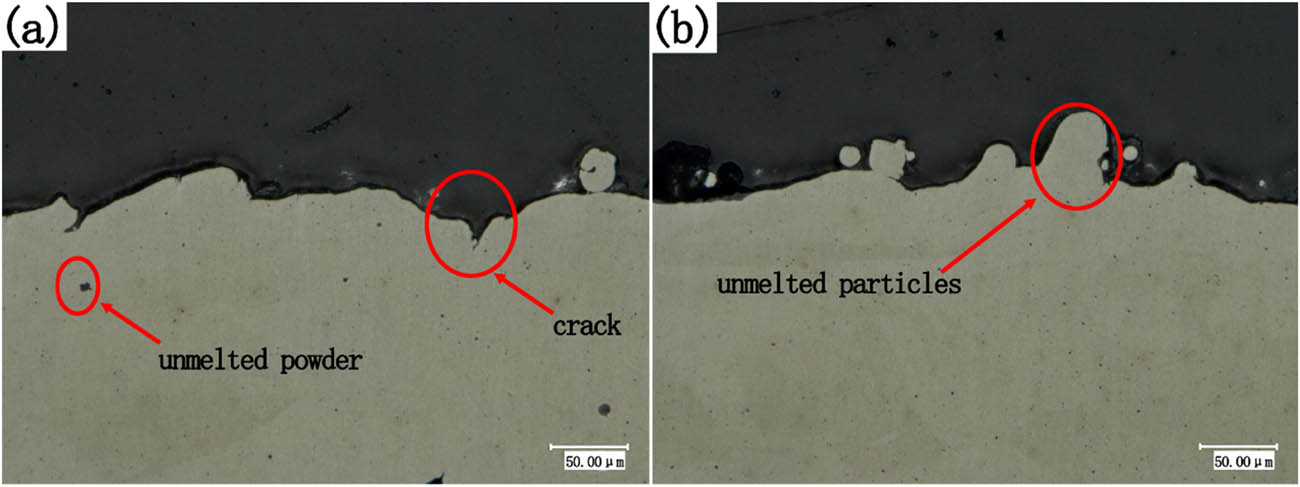
Figure 1
Defects in additive manufacturing of 316L stainless steel: (a) incompletely melted crystal grains and surface cracks and (b) incompletely molten convex structures.
Figure 1(a) reveals deep cracks in the surface layer, attributed to uneven residual stress release during cooling. Such cracks significantly degrade the mechanical properties of the samples. Incompletely melted powder particles are also shown in Figure 1(a), resulting from insufficient local temperature due to uneven laser energy distribution or excessive powder layer thickness. In Figure 1(b), melted powder forms spherical particles through surface tension-driven spheroidization, producing numerous unmelted protrusions on the surface. These unmelted particles create an uneven surface texture that degrades the surface finish. These observations confirm that SLS-processed 316L stainless steel inherently contains surface and subsurface defects, motivating the need for postprocessing.
After cold mounting, grinding, and polishing, the samples were observed using an extended depth-of-field microscope at 800× magnification to measure defect depths. Using the lowest point in the field of view as the reference plane, the height of defect protrusions was measured; the results are shown in Figure 2. As shown in Figure 2, the main defects in the SLS-processed 316L stainless steel samples are surface micro-pits and micro-protrusions, with depths predominantly distributed between 30 μm and 70 μm, representing the majority of observed defects. In Figure 2(c), the accumulation of unmelted particles forms a protrusion with a height of 58.67 μm. In Figure 2(e), the depth of unmelted particles in the subsurface layer is 46.77 μm. In Figure 2(f), deep cracks propagate from the surface into the interior, with a maximum measured depth of 99.98 μm. Only a very small number of pit defects reached comparable depths.
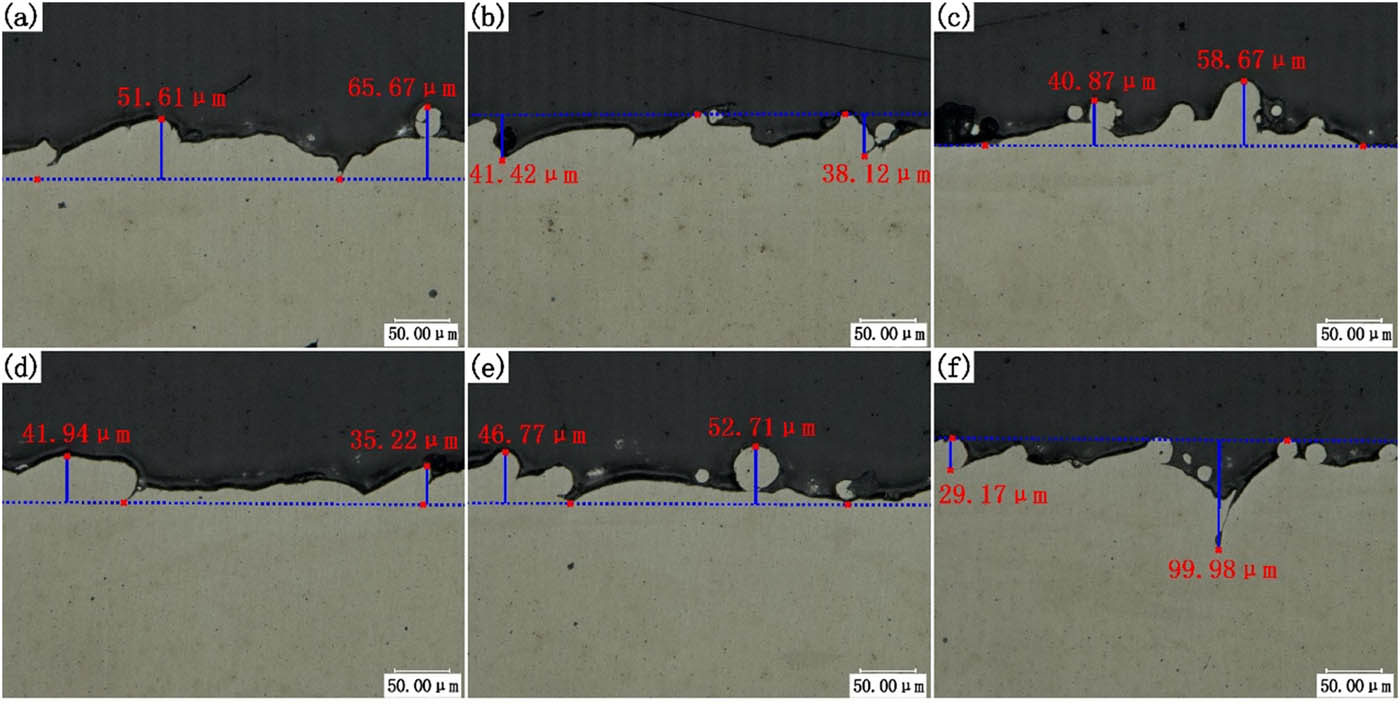
Figure 2
Defect depth measurement: (a–d) surface micro-pits and micro-protrusions; (e) unmelted particles; and (f) deep cracks.
2.3. Experimental equipment and principle
The COLR method was employed to improve the surface roughness and control the remelting depth of 316L stainless steel samples. The experimental procedure comprised sample preparation, COLR treatment, characterization of surface morphology and melt pool geometry, and data analysis. The laser system consisted of a laser source and a processing head. The processing head comprised four units: a collimation unit, a reflection unit, a galvanometer scanning unit, and a focusing unit. The laser beam emitted from the source was collimated, reflected, circularly oscillated via the galvanometer, and focused to form a high-energy-density spot on the workpiece surface. Driven by a mobile platform, the laser beam moved along the prescribed scanning path to complete the surface remelting process. A schematic diagram of the experimental setup is shown in Figure 3, and the main parameters of the laser are listed in Table 2.
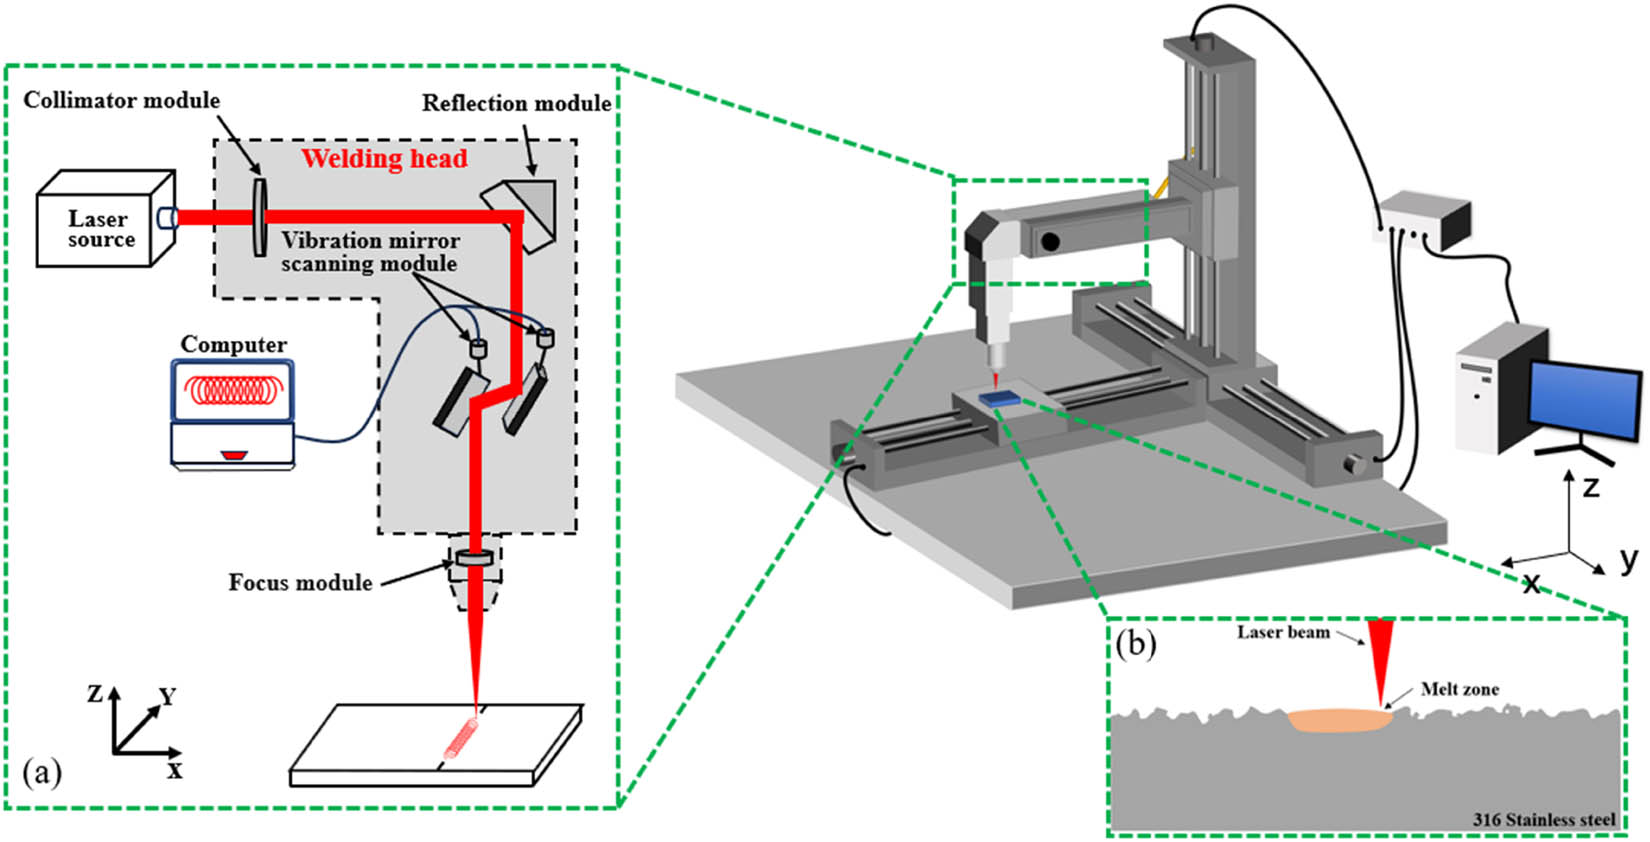
Figure 3
Schematic diagram of experimental equipment: (a) laser system and (b) laser remelting treatment.
Table 2
Main technological parameters of laser
| Technological parameters | Value |
|---|---|
| Maximum power (W) | 1,500 |
| Laser wavelength (nm) | 1,064 |
| Maximum frequency (Hz) | 20,000 |
| Focal length (mm) | 125 |
| Rotation speed (rpm) | 2,000 |
| Laser mode | Circular oscillating laser |
| Output mode | Pulse |
The laser operates in a Gaussian mode. A systematic parameter screening was conducted to identify a suitable range for analyzing the effects of laser remelting on surface morphology and defects. Three factors – laser power, scanning speed, and rotation speed – were selected to examine their effects on the remelting process. Feasibility tests were first conducted to determine a workable range for each factor (Table 3). To minimize the average surface roughness Ra and reduce defects, the final parameter levels were determined after dozens of preliminary trials. An extended depth-of-field microscope and an scanning electron microscopy (SEM) were used to observe the surface morphology and microstructure. Additionally, a laser confocal microscope was employed to measure the surface roughness and three-dimensional morphology before and after polishing.
Table 3
Laser remelting process parameters
| No. | Laser power (W) | Scanning speed (mm/s) | Rotation speed (%) |
|---|---|---|---|
| 1 | 120 | 4 | 40, 50, 60 |
| 2 | 120 | 5 | 40, 50, 60 |
| 3 | 120 | 6 | 40, 50, 60 |
| 4 | 150 | 4 | 40, 50, 60 |
| 5 | 150 | 5 | 40, 50, 60 |
| 6 | 150 | 6 | 40, 50, 60 |
| 7 | 180 | 4 | 40, 50, 60 |
| 8 | 180 | 5 | 40, 50, 60 |
| 9 | 180 | 6 | 40, 50, 60 |
Sufficient pretreatment of the samples is required before observation. First, mount the specimen vertically in a cold-mounting mold to ensure the observed cross-section is parallel to the mold bottom surface. Mix epoxy resin and curing agent at a volume ratio of 3:1, pour the mixture slowly into the mold, and allow natural curing for 6 h in a well-ventilated area. Subsequently, perform rough grinding to remove surface protrusions and pores, gradually grinding down to the target observed cross-section, followed by fine grinding to eliminate fine grinding marks. For rough polishing, use a velvet polishing cloth with 1.0 μm diamond suspension, polishing for 15 s in each of four directions. For fine polishing, use a plush polishing cloth with 0.5 μm diamond suspension, polishing repeatedly in multiple directions until no obvious scratches remain on the cross-section. The specimen is then thoroughly cleaned with absolute ethanol, dried, and hermetically stored to prevent contamination.
To investigate the microstructural evolution in the heat-affected zone of 316L stainless steel, the cross-section of the specimen is etched. Aqua regia consisting of concentrated hydrochloric acid and concentrated nitric acid at a volume ratio of 3:1 is used as the etchant, with an etching duration of 20 s to avoid overetching. After etching, the specimen is rinsed thoroughly with clean water, vacuum-dried, and hermetically stored to prevent secondary contamination.
Box-Behnken design is a three-level experimental design that places experimental points at the midpoints of each edge and at the center of a multidimensional cube, avoiding corner vertices. This approach efficiently reduces the number of required runs while still supporting the fitting of a quadratic model, making it particularly advantageous when experimental resources are constrained or extreme factor combinations are undesirable. In the COLR process, the treatment outcome is primarily determined by laser power, scanning speed, and rotation speed. Therefore, the effects of these three factors – laser power (P), scanning speed (V), and rotation speed (N) – on surface roughness (R) and remelting depth (D) were investigated. Each factor was varied at three coded levels: −1 (low), 0 (center), and +1 (high). The actual parameter values corresponding to these levels are listed in Table 4. The experimental design comprised 17 runs, consisting of 12 factorial points and 5 replicate center points, as shown in Table 5. These runs enabled fitting RSM models that relate the process parameters to the measured responses.
Table 4
The actual values and corresponding encoded values of roughness and melt depth parameters
| Factor | Symbol | Extreme value | ||
|---|---|---|---|---|
| −1 | 0 | 1 | ||
| P (W) | W | 120 | 150 | 180 |
| V (mm/s) | v | 4 | 5 | 6 |
| N (%) | r | 40 | 50 | 60 |
Table 5
Experimental design matrix and corresponding measurement results for roughness and melt depth
| No. | P (W) | N (%) | V (mm/s) | R (μm) | D (μm) |
|---|---|---|---|---|---|
| 1 | 120 | 40 | 5 | 1.99 | 50 |
| 2 | 180 | 40 | 5 | 0.65 | 239 |
| 3 | 120 | 60 | 5 | 1.56 | 40 |
| 4 | 180 | 60 | 5 | 0.85 | 195 |
| 5 | 120 | 50 | 4 | 1.32 | 48 |
| 6 | 180 | 50 | 4 | 0.8 | 228 |
| 7 | 120 | 50 | 6 | 2.13 | 46 |
| 8 | 180 | 50 | 6 | 0.72 | 210 |
| 9 | 150 | 40 | 4 | 0.86 | 136 |
| 10 | 150 | 60 | 4 | 0.81 | 94 |
| 11 | 150 | 40 | 6 | 1.2 | 136 |
| 12 | 150 | 60 | 6 | 0.83 | 95 |
| 13 | 150 | 50 | 5 | 0.97 | 107 |
| 14 | 150 | 50 | 5 | 0.99 | 106 |
| 15 | 150 | 50 | 5 | 0.95 | 103 |
| 16 | 150 | 50 | 5 | 1.01 | 104 |
| 17 | 150 | 50 | 5 | 0.98 | 105 |
3. Results and discussion
3.1. Morphology and depth
3.1.1. Surface morphology
Figures 4–6 show the three-dimensional surface morphologies (400× magnification) of the samples after COLR treatment under different parameter combinations. In these figures, each column corresponds to a constant rotation speed (40, 50, and 60% from left to right), and each row corresponds to a constant scanning speed (4, 5, and 6 mm/s from top to bottom). The exact correspondence between image labels and process parameters is listed in Table 6. This full-factorial parameter matrix allowed the individual and interactive effects of scanning speed and rotation speed on surface morphology to be examined at each power level. The images reveal the laser scanning path characteristics, surface micro-morphology, and the uniformity of the treated area.
Table 6
Parameters corresponding to image encoding under different power parameters
| 4 mm/s | 5 mm/s | 6 mm/s | |
|---|---|---|---|
| 40% | a | b | c |
| 50% | d | e | f |
| 60% | g | h | i |
Under the condition of a circular oscillating laser power of 120 W, the effects of different scanning speed and rotation speed on the surface morphology of the samples are shown in Figure 4. The experimental data show that the width of the laser scanning path is stably maintained in the range of 1,114–1,137 μm, and presents typical arc-shaped trajectory characteristics. Through comparison, it is found that with the increase of rotation speed and the decrease of scanning speed, the spacing between adjacent laser paths shows a decreasing trend, with the minimum spacing reaching 25 μm and the maximum spacing reaching 123 μm. It is worth noting that under specific parameter combinations, the surface morphologies of Figure 4(b), (c), and (f) shows obvious characteristics of insufficient melt flow, that is, discontinuous corrugated structures are formed at the edges of the scanning trajectories. The existence of these defects seriously affects the surface roughness and compactness of the samples after remelting.
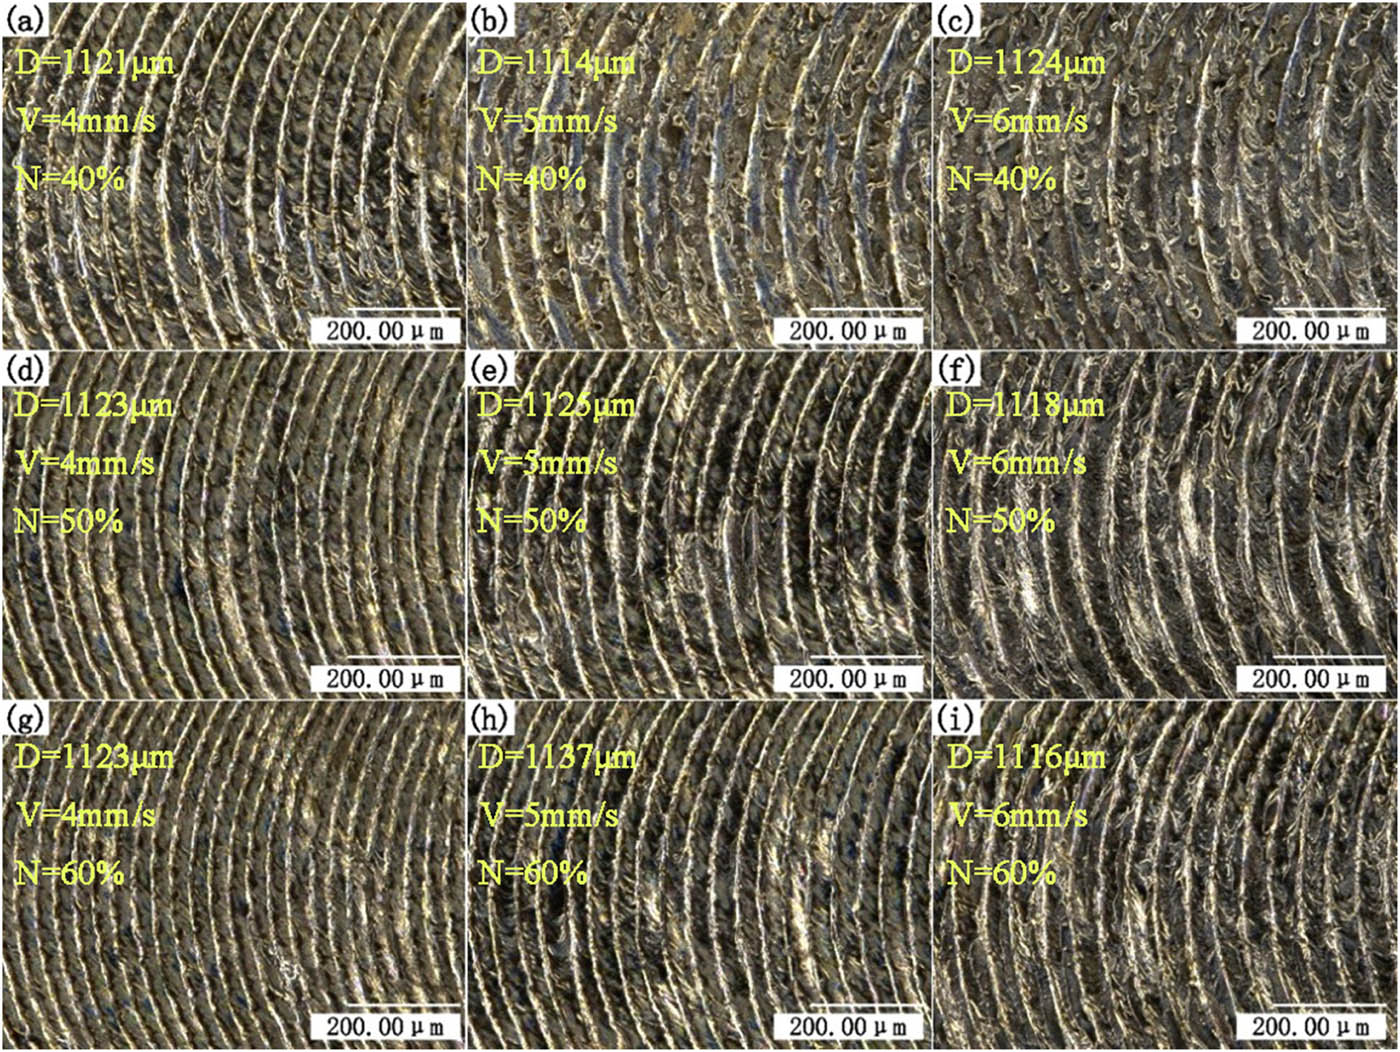
Figure 4
Surface morphology of specimens with different scanning speeds and rotation speeds under a power of 120 W, samples (a–i) correspond to the process parameters a–i listed in Table 6.
Figure 5 presents the two-dimensional surface morphology at higher magnification (800×) for the 120 W condition, revealing pronounced serrated undulations along the laser path. These undulations result from reduced melt fluidity under insufficient laser energy. The formation of such traces is closely linked to the hydrodynamic behavior of the molten pool. Under insufficient energy input and high scanning speed, the melt viscosity increases and fluidity decreases, preventing the liquid metal from spreading adequately. This leads to serrated undulations at the track edges and nonuniform thickness along the channel centerline, which compromise the compactness and surface roughness of the remelted layer.
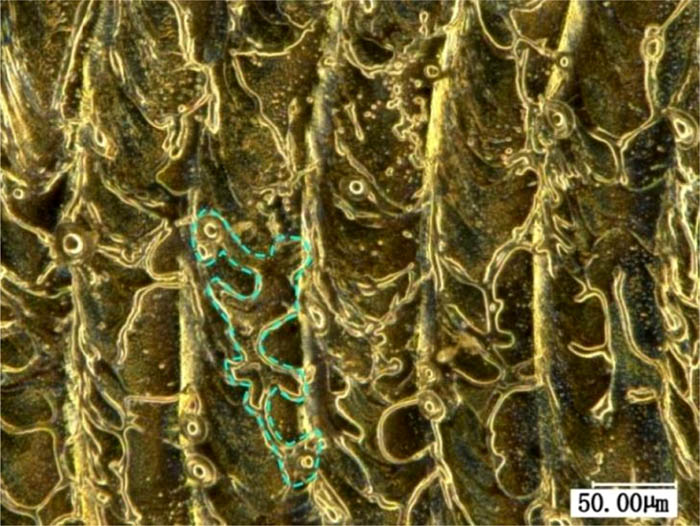
Figure 5
Sawtooth undulating morphology at 800× magnification under a power of 120 W.
Figure 6 shows the surface morphology of samples treated at 150 W under different scanning and rotation speeds. The laser scanning path width ranges from 1,154 to 1,185 μm, slightly wider than the 1,114–1,137 μm observed at 120 W. Compared with the low-power condition, the arc-shaped trajectories are more distinct and regular, and the channel surfaces remain smooth and continuous, free of the serrated defects associated with insufficient melting. However, at a scanning speed of 6 mm/s, black dot-like protrusions appear along the scanning path (Figure 6(c), (f), and (i)).
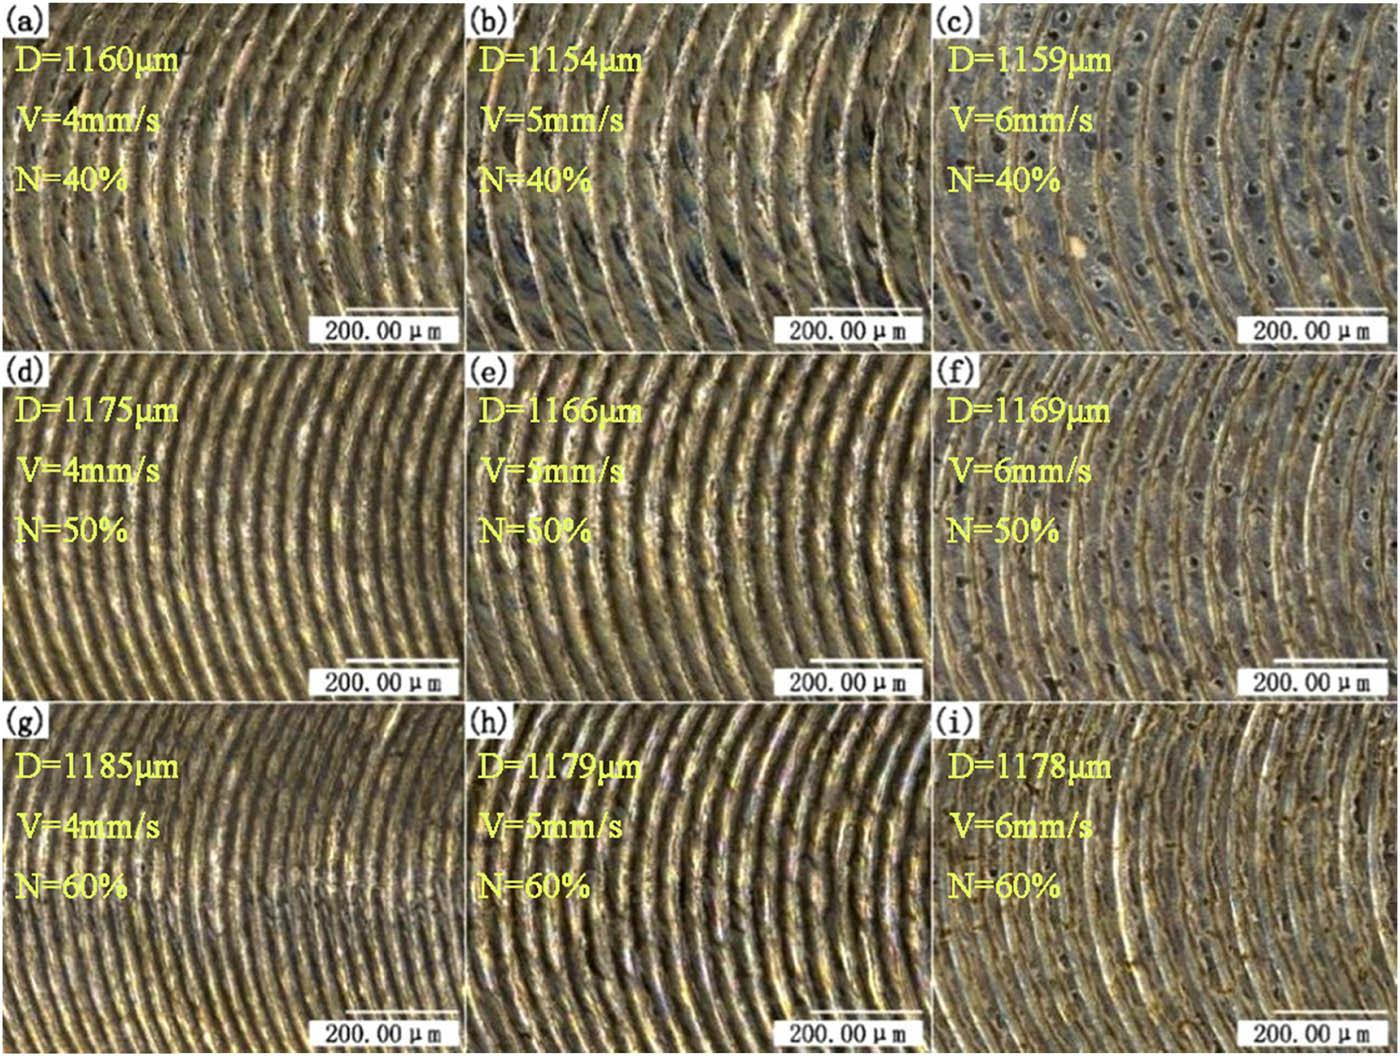
Figure 6
Surface morphology of specimens with different scanning speeds and rotation speeds under a power of 150 W, samples (a–i) correspond to the process parameters a–i listed in Table 6.
Figure 7 characterizes the black spot defects on the remelted surface. Extended depth-of-field observations show that in the red-framed region of Figure 7(a), the black spots exhibit irregular, roughly circular contours. Figure 7(b) presents the measured geometric parameters, with a lateral dimension of ∼23.41 μm and a vertical height of ∼1.00 μm. These micro-protrusions are attributed to insufficient local laser energy.
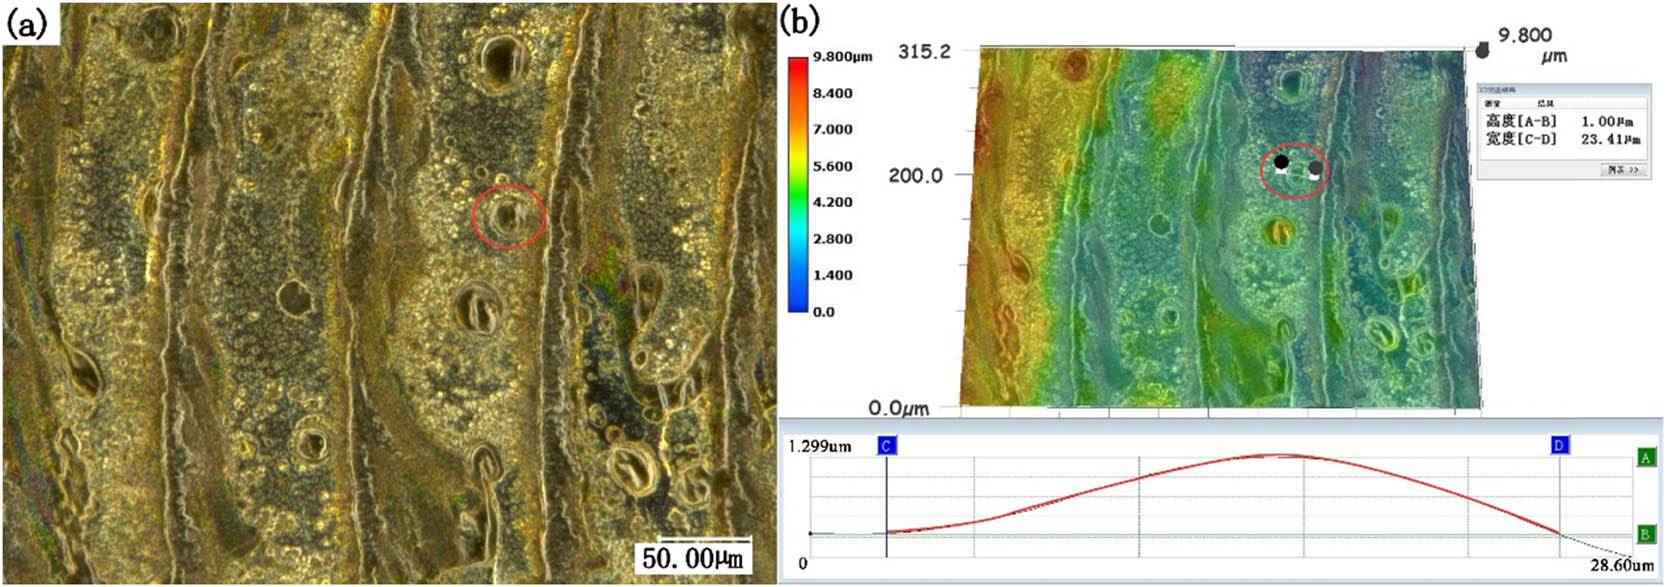
Figure 7
Black spot defects on the remelted surface: (a) two dimensional morphology and (b) three dimensional morphology and cross-sectional profile.
Figure 8 shows the two-dimensional surface morphology of samples treated at 180 W. The laser scanning path width ranges from 1,072 to 1,110 μm, slightly narrower than the 1,114–1,137 μm observed at 120 W. Two typical features are observed across the parameter combinations. At relatively high scanning speeds (Figure 8(b) and (c)), black spot-like protrusions appear on the surface; the size of these protrusions tends to increase as the scanning speed decreases. In specific regions, such as the upper-left corner of Figure 8(h) and the lower half of Figure 8(i), the scanning channel surface exhibits yellowish discoloration, indicative of local excessive ablation.
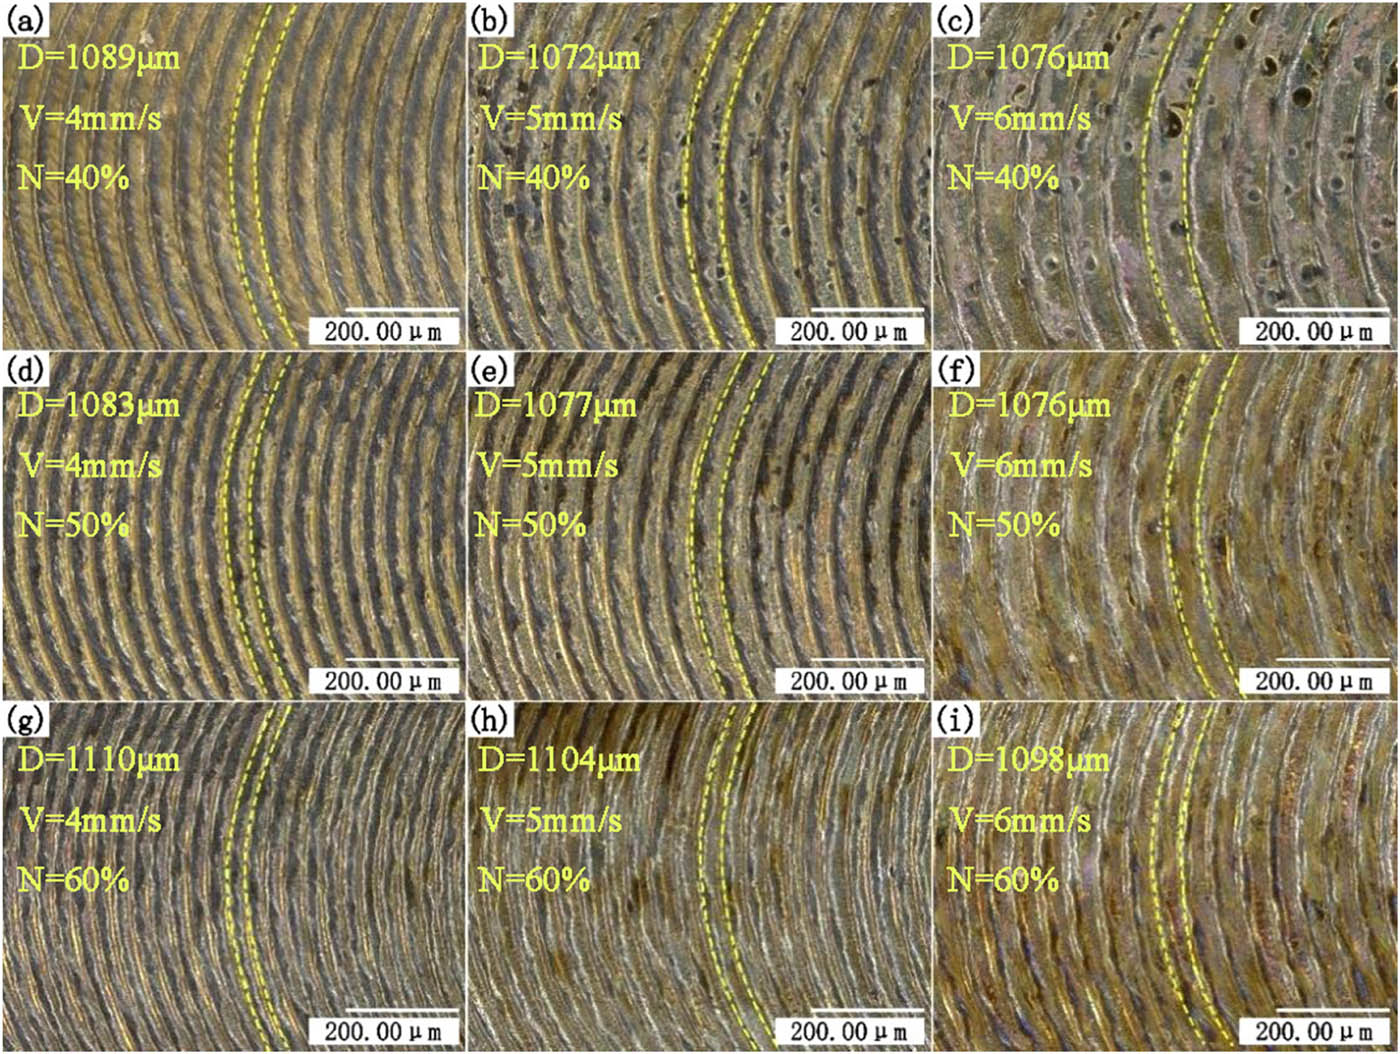
Figure 8
Surface morphology of specimens with different scanning speeds and rotation speeds under a power of 180 W, samples (a–i) correspond to the process parameters a–i listed in Table 6.
Figure 9 shows the morphological characteristics of the scanning channel edge after 180 W COLR treatment at 800× magnification. Observations reveal material spattering on both sides of the laser scanning trajectory, predominantly in the form of spherical particles approximately 30 μm in diameter. Localized areas of excessive ablation with yellowish-brown discoloration are also visible along the channel edges. At 180 W, spherical spatter was not completely eliminated even with circular oscillation. This is attributed to severe molten pool fluctuations driven by the high energy density. Simultaneously, the increased vapor recoil pressure on the molten pool surface intensifies Marangoni convection, further destabilizing the melt.
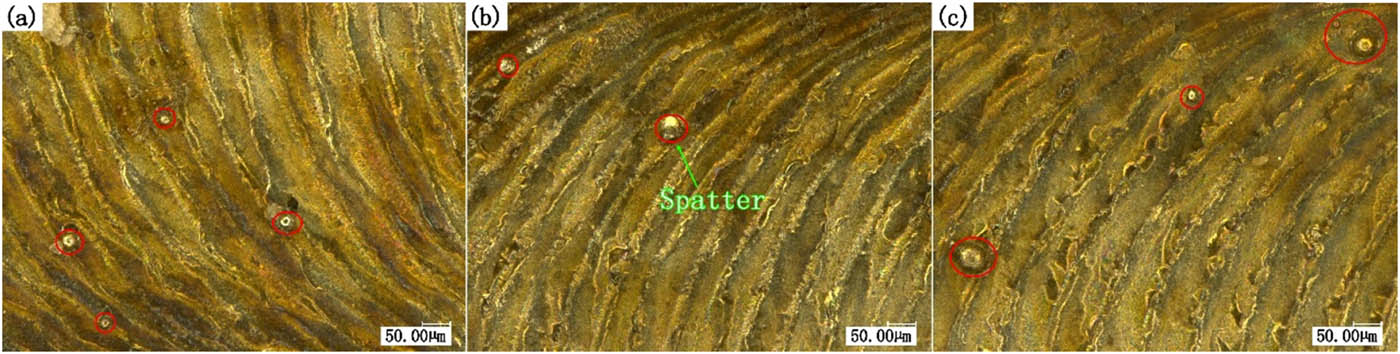
Figure 9
Surface splashing after 180 W power remelting: (a) bottom side and (b, c) top side.
3.1.2. Surface roughness
Figures 10–12 present the three-dimensional surface topographies (400× magnification) of the scanning paths after COLR treatment at different powers. The parameters corresponding to each figure code are listed in Table 6.
Figure 10 presents the three-dimensional surface morphology after COLR at 120. Extended depth-of-field observations reveal regular, arc-shaped laser scanning trajectories whose characteristics evolved systematically with the process parameters. Increasing the scanning speed and reducing the rotation speed led to shallower grooves and less distinct contours. For instance, grooves were clearly defined at 4 mm/s and 60% rotation, whereas they became noticeably shallower and less distinct at 6 mm/s and 40% rotation. The Ra values under this power ranged from 1.32 μm to 2.13 μm. This represents an approximately 71–82% reduction compared with the original substrate (Ra ≈ 7.3 μm).
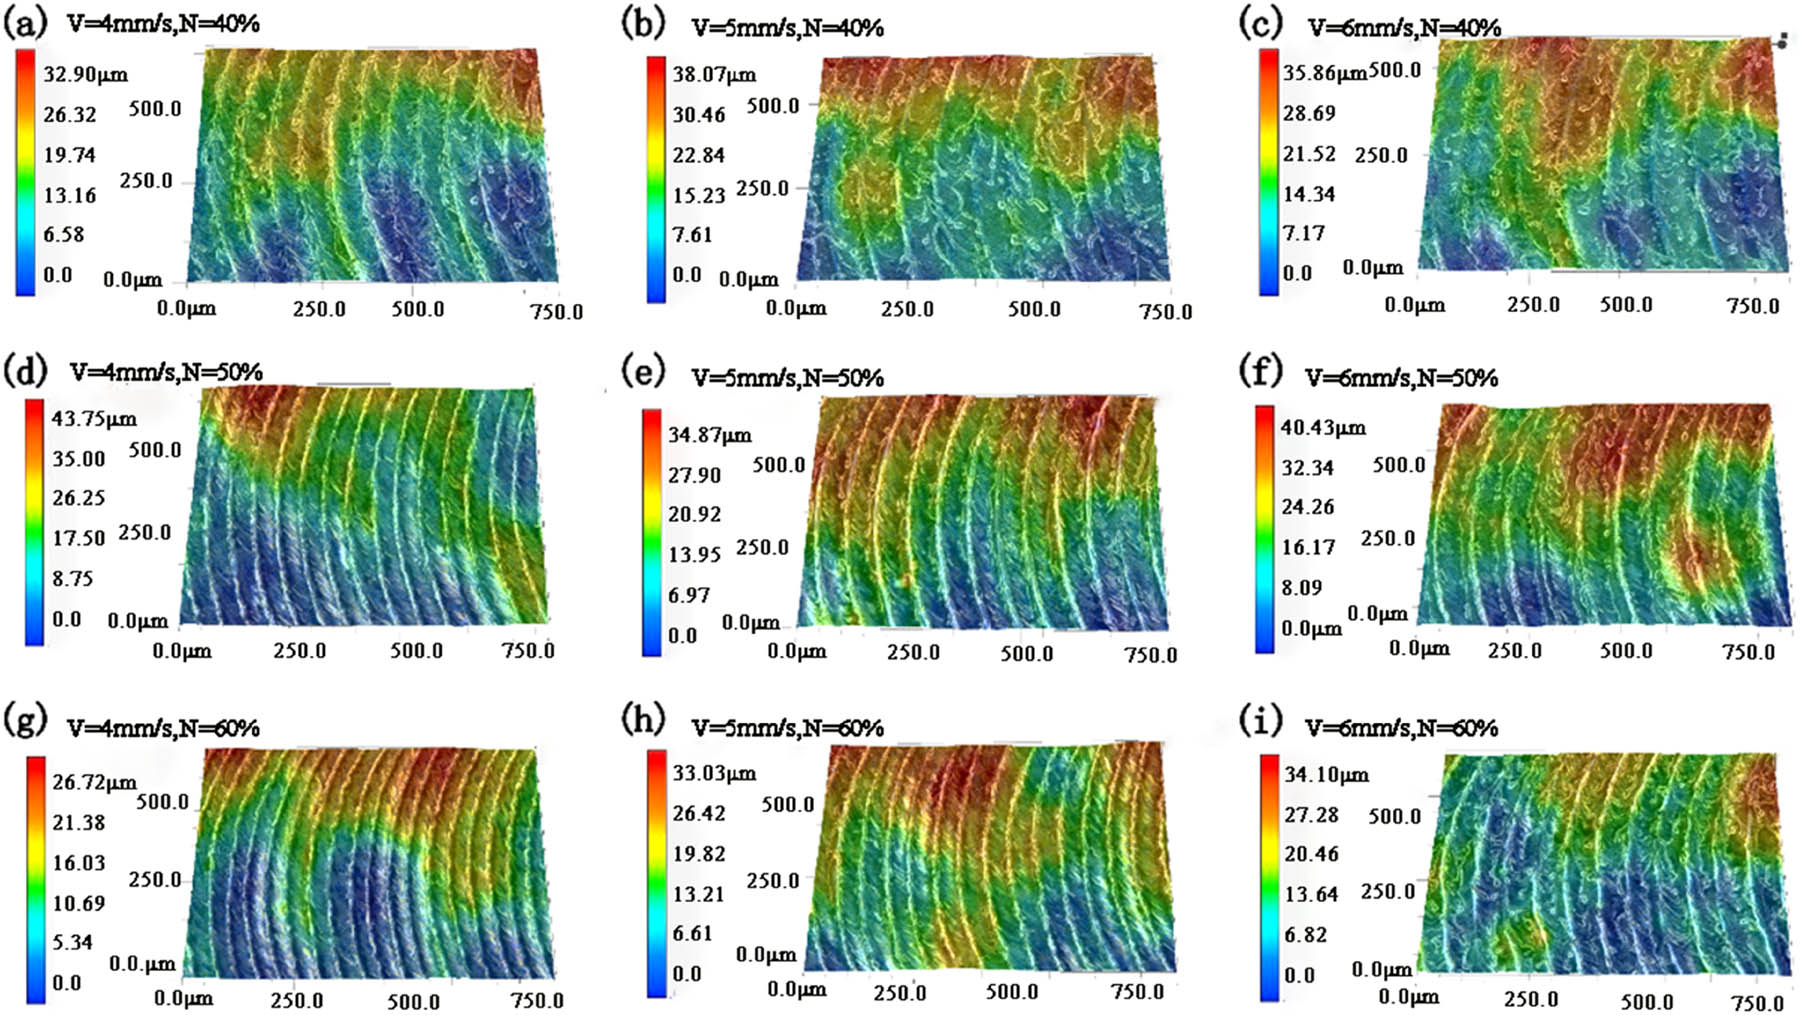
Figure 10
Three-dimensional morphology after 120 W power remelting, samples (a–i) correspond to the process parameters a–i listed in Table 6.
Figure 11 shows the three-dimensional surface morphology after COLR at 150 W. Compared with the 120 W condition, the laser scanning paths at 150 W displayed better surface morphology: the overall flatness improved and the serrated protrusions arising from insufficient melt fluidity were greatly reduced. The Ra values under this power ranged from 0.83 to 1.2 μm. This represents an 83–88% reduction compared with the original substrate (Ra ≈ 7.3 μm) and is also lower than the values obtained at 120 W (1.32–2.13 μm).
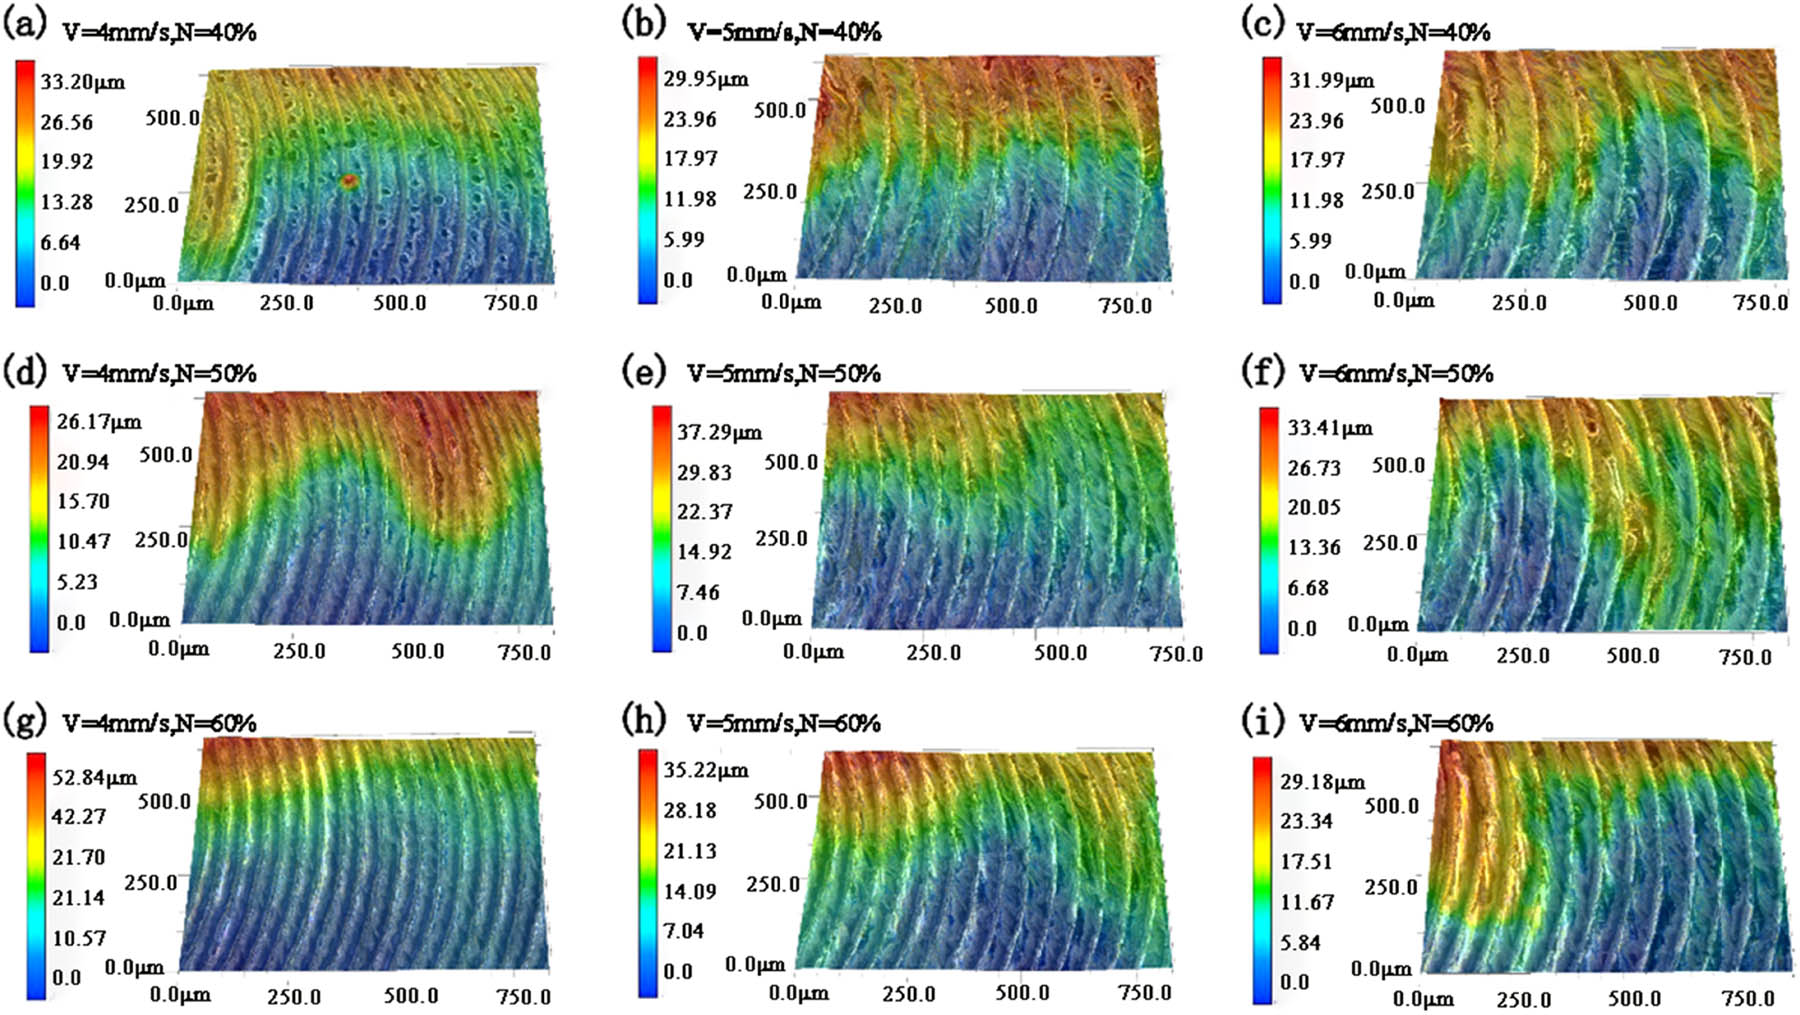
Figure 11
Three-dimensional morphology after 150 W power remelting, samples (a–i) correspond to the process parameters a–i listed in Table 6.
Figure 12 shows the three-dimensional surface morphology after COLR at 180 W. Compared with the results at 120 and 150 W, the ridge-like protrusions along the groove boundaries that were prominent at lower powers became less pronounced at 180 W. At 6 mm/s and 40% rotation (Figure 12(d)), the groove boundaries exhibited almost no convex traces, and the overall surface flatness was markedly improved. The Ra values under this power ranged from 0.65 to 0.85 μm, corresponding to an 88–91% reduction relative to the as-built substrate (Ra ≈ 7.3 μm) and are markedly lower than those at 120 W (1.32–2.13 μm) and 150 W (0.83–1.2 μm). The lowest roughness (Ra = 0.65 μm) was obtained at 180 W, 5 mm/s, and 40% rotation.
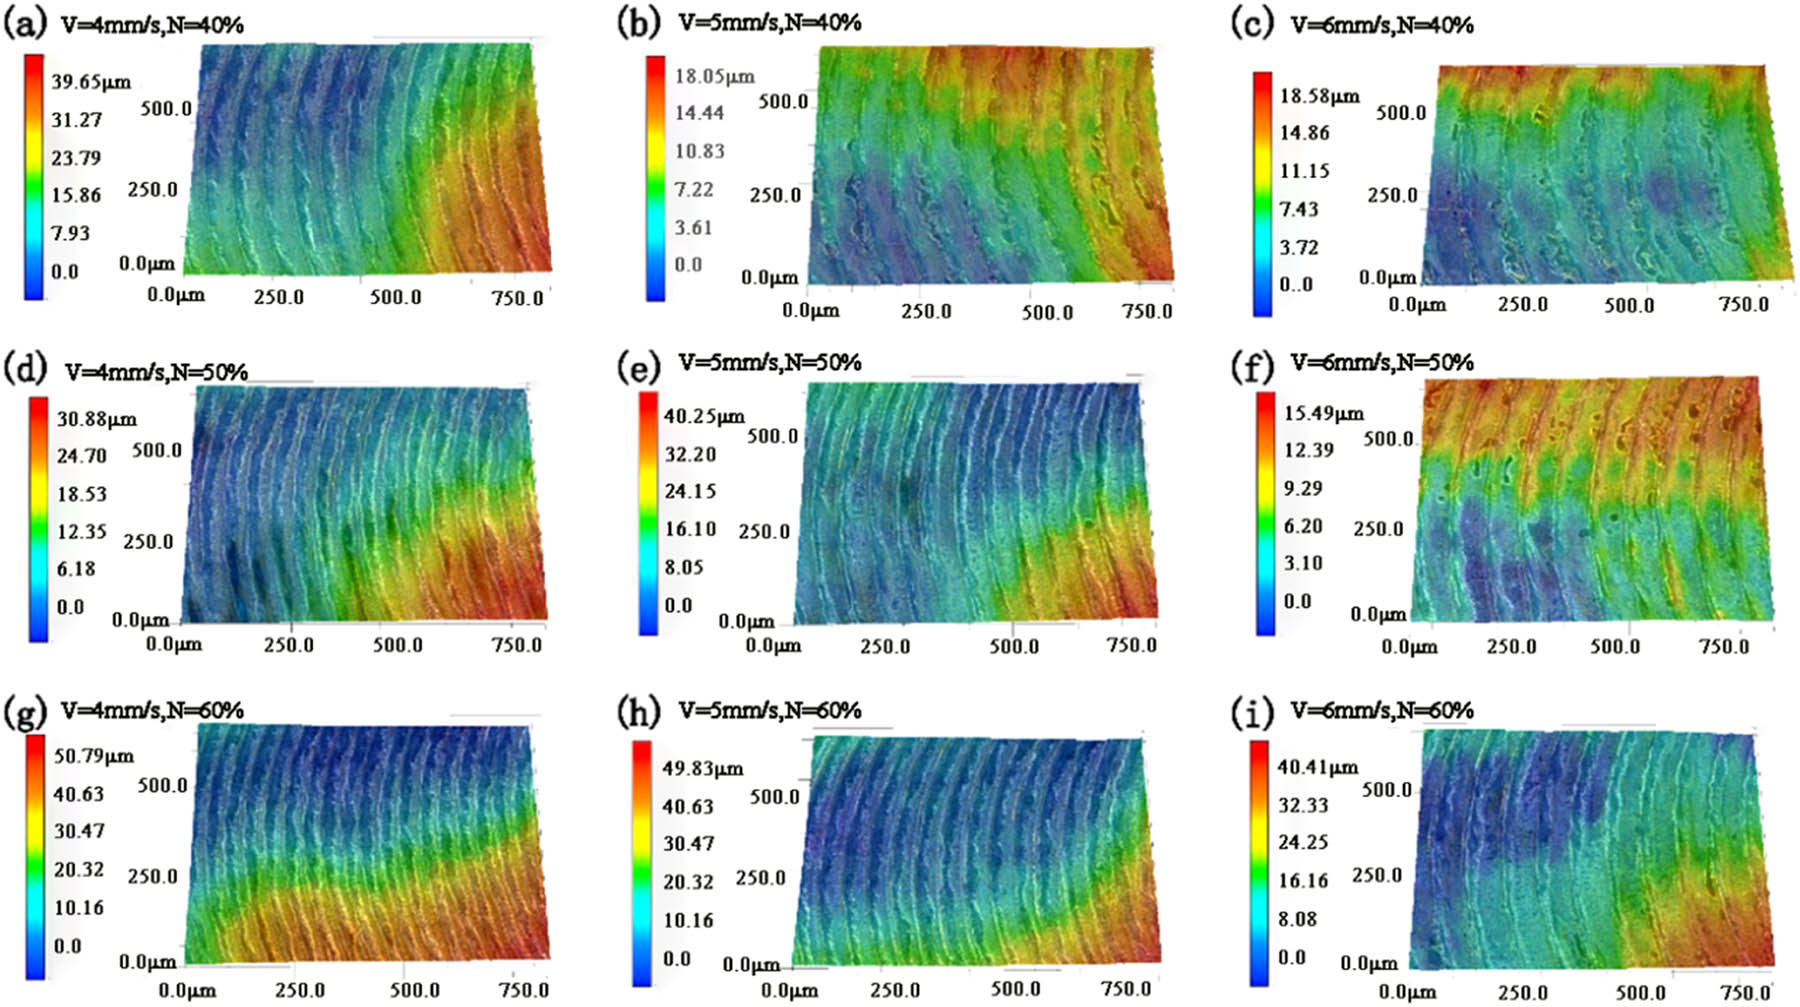
Figure 12
Three-dimensional morphology after 180 W power remelting, samples (a–i) correspond to the process parameters a–i listed in Table 6.
The aforementioned figures illustrate the effects of laser power, scanning speed, and rotation speed on the surface morphology of SLS-processed 316L stainless steel during COLR.
3.1.3. Molten pool morphology and depth
In COLR, laser power significantly influences the molten pool morphology. Figures 13, 15 and 17 present the cross-sectional molten pool morphologies at 120, 150, and 180 W, respectively (400× magnification). The corresponding scanning speed and rotation speed parameters are listed in Table 6.
Figure 13 shows the cross-sectional molten pool morphologies at 120 W under various scanning and rotation speeds. The molten pools are generally elongated and shallow, with widths ranging from 1,114 to 1,137 μm. Undercut defects appear at the molten pool–substrate interface in Figure 13(g) and (h), with depths of approximately 15–20 μm. Surface undulations are visible on all samples; as the rotation speed decreased from 50 to 40%, the ripple amplitude increased noticeably. Under low power or high scanning speed, the energy density is insufficient to fully melt the substrate, only achieving surface-layer melting. This increases the melt viscosity, reduces the surface tension gradient, and weakens Marangoni convection, all of which promote surface ripple formation.
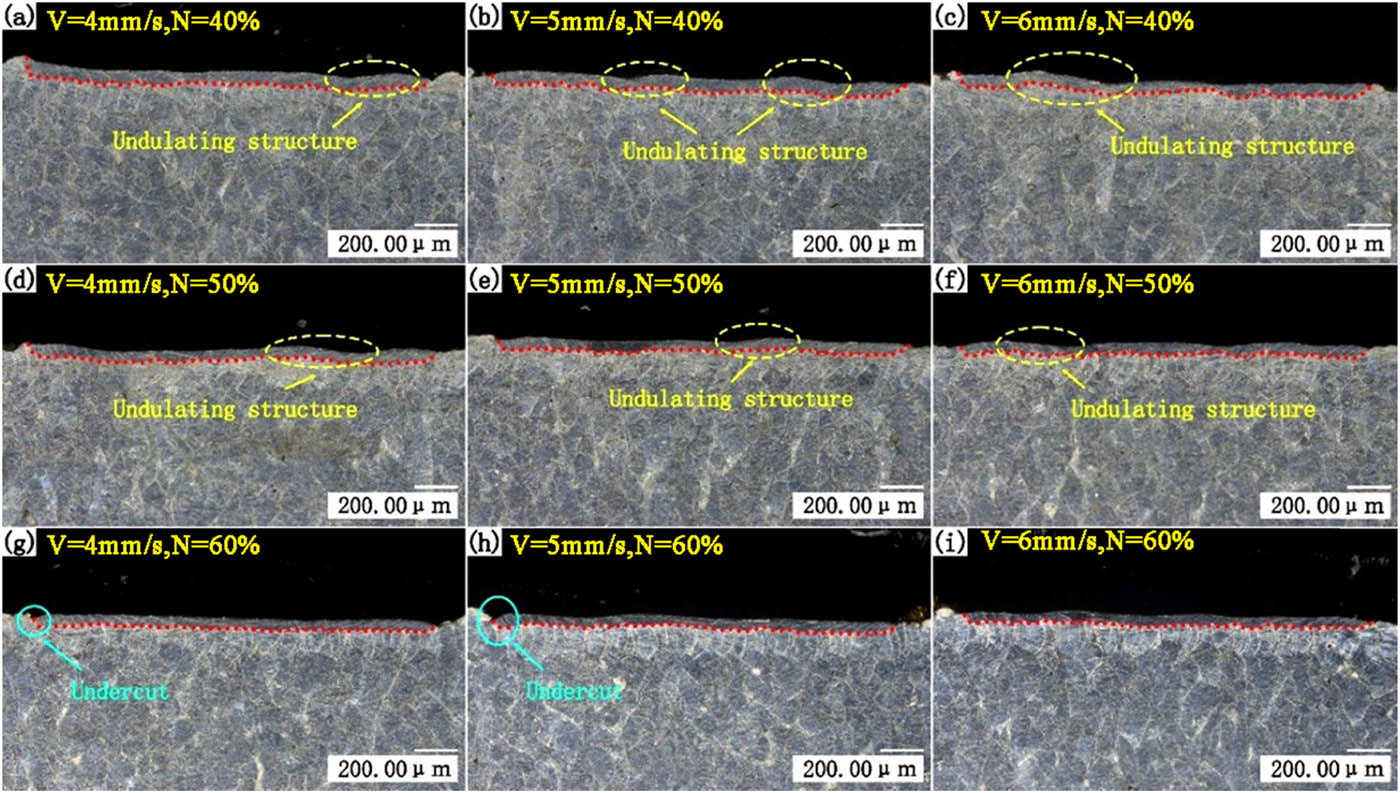
Figure 13
The morphology of the molten pool after 120 W power remelting, samples (a–i) correspond to the process parameters a–i listed in Table 6.
Figure 14 shows the cross-sectional morphology of the molten pool formed under COLR at 120 W, 5 mm/s, and 50% rotation. The molten pool exhibited a nearly symmetrical depth distribution: the left side was 48.99 μm, the right side 50.02 μm, and the central area 35.15 μm, giving a distinct concave-upward profile. Figure 14(b) and (c) shows the layered structure characteristic of COLR, formed by repeated melting–solidification cycles. These interfaces display a periodic wavy morphology, with the layer width increasing from the edges toward the center. In Figure 14(c), the layered region on the left side is noticeably wider than that on the right. This layered structure is primarily attributed to repeated heating by the oscillating beam and the shrinkage stresses generated during rapid solidification.
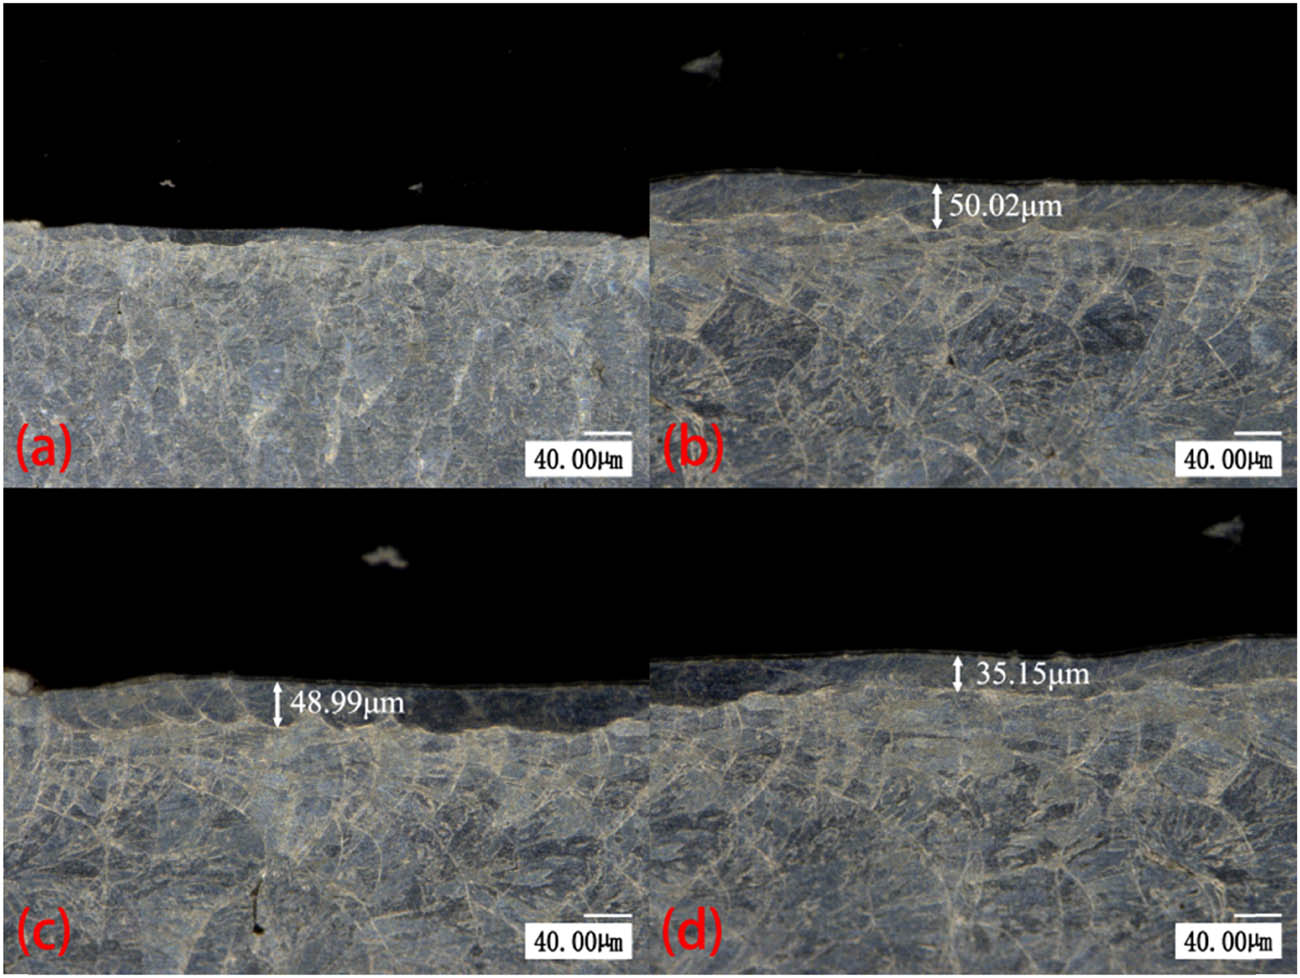
Figure 14
Remelting depth with 120 W, 5 mm/s, and 50% rotation: (a) overall morphology, (b) right side, (c) left side, and (d) central region.
Figure 15 presents the cross-sectional molten pool morphologies at 150 W under various scanning and rotation speeds. The molten pool width ranges from 1,154 to 1,185 μm, about 15–20% wider than that at 120 W. Compared with the low-power condition, the undercut defects at the melt pool edge were reduced, surface ripples were less pronounced, and the bottom morphology was flatter. This improvement is attributed to two factors. First, higher laser power promotes more complete melting, increases the melt depth, lowers the viscosity, and enhances fluidity. Second, forced convection induced by the circular beam stirring homogenizes the temperature field, resulting in a more planar molten pool.
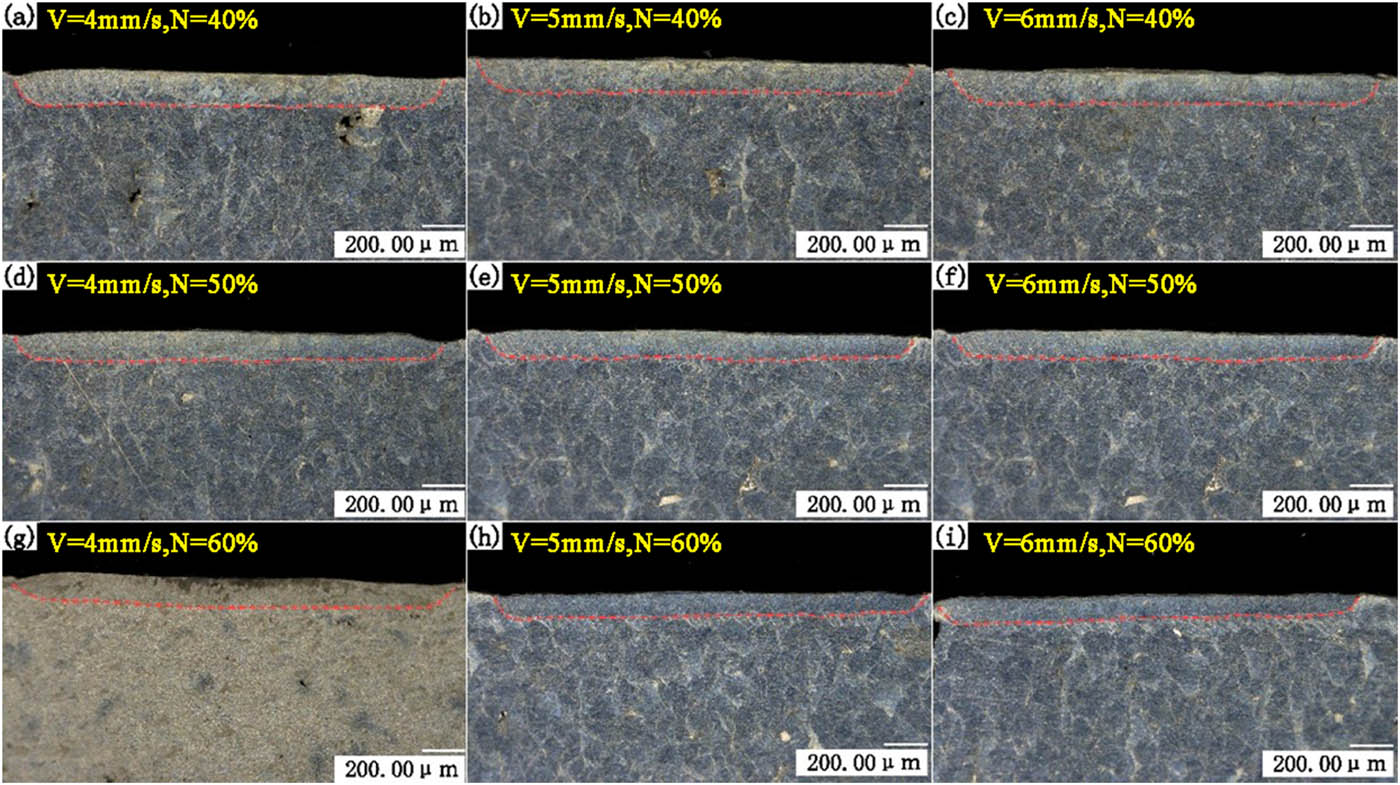
Figure 15
The morphology of the molten pool after 150 W power remelting, samples (a–i) correspond to the process parameters a–i listed in Table 6.
Figure 16 shows the cross-sectional morphology of the molten pool produced by COLR at 150 W, 5 mm/s, and 50% rotation. The depth distribution was relatively uniform: the center measured 111.62 μm, the left side 110.51 μm, and the right side 96.93 μm, yielding a variation of less than 15% across the width. Figure 16(b) and (c) shows that the layered structure, formed by multiple melting–solidification cycles, persisted at this power. Compared with the 120 W condition, the wavy bottom morphology was less pronounced, indicating that higher power improved molten pool stability. The improved penetration uniformity at 150 W is attributed to the higher energy density, which promotes adequate melt flow, and to the circular beam stirring, which homogenizes the temperature field.
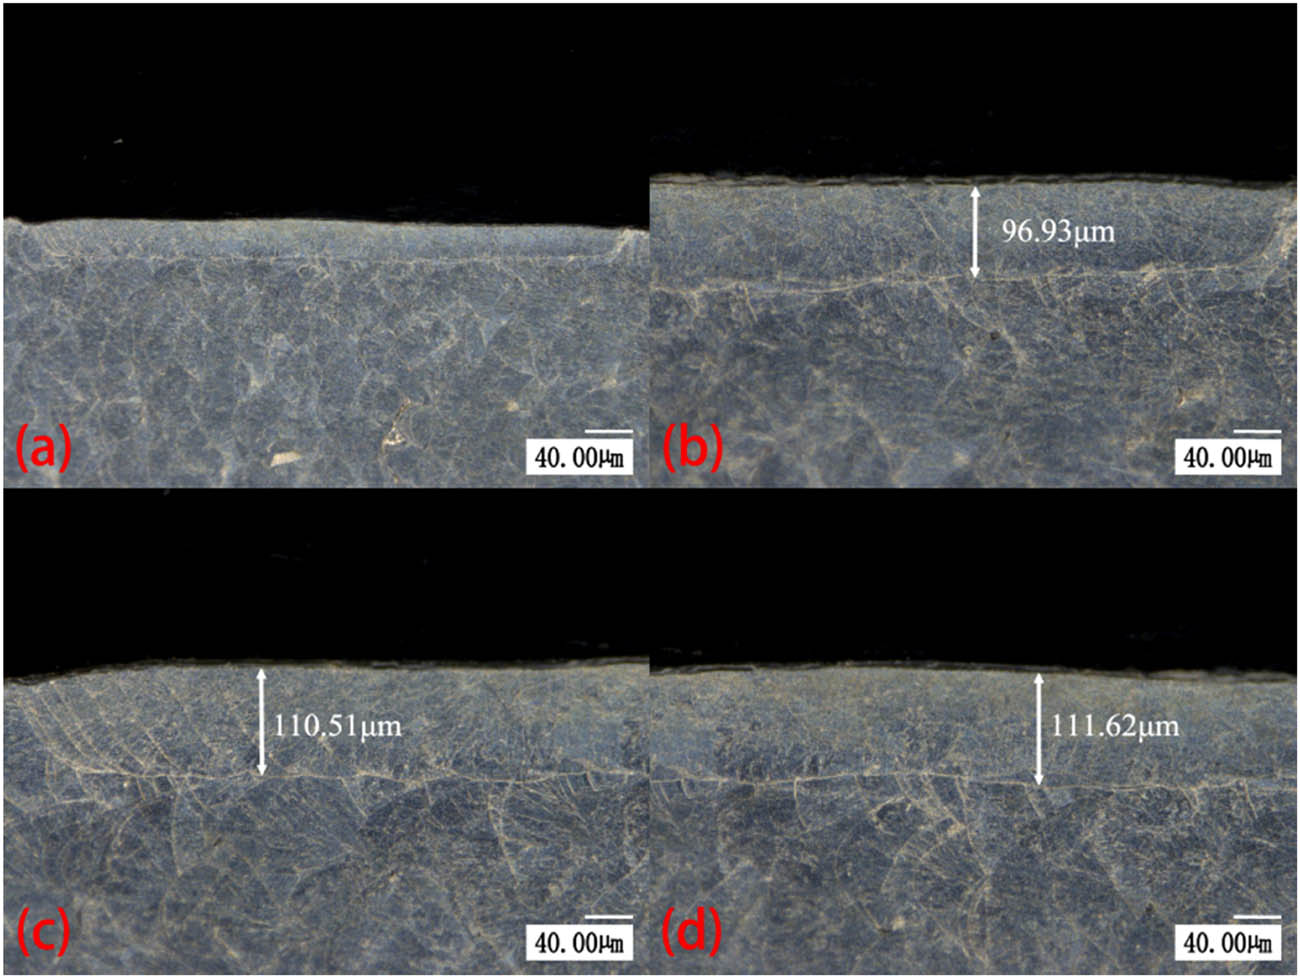
Figure 16
Remelting depth with 150 W, 5 mm/s, 50% rotation: (a) overall morphology, (b) right side, (c) left side, and (d) central region.
Figure 17 presents the cross-sectional molten pool morphologies at 180 W under different scanning and rotation speeds. The molten pool width ranges from 1,072 μm to 1,110 μm, indicating consistent process behavior. Compared with the low-power condition, undercut defects were reduced and surface ripples were less pronounced than at 120 W. Apart from some small local ripples on the left side at 6 mm/s, the depth uniformity was satisfactory across the remaining conditions. This improvement is attributed to two factors. First, the higher energy density promotes deeper melting and reduces melt viscosity. Second, the sufficient energy input enables effective stirring by the circular beam, which homogenizes the temperature field.
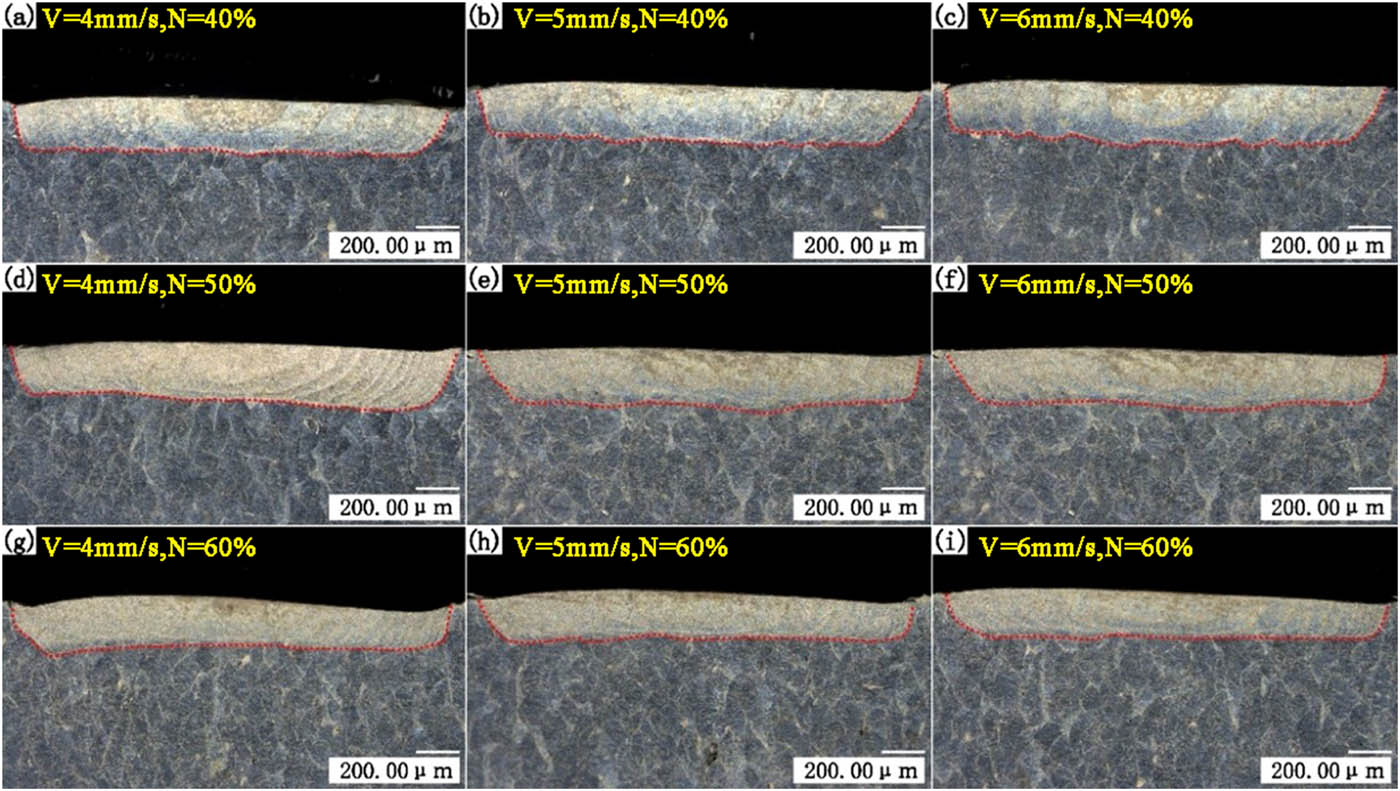
Figure 17
The morphology of the molten pool after 180 W power remelting, samples (a)–(i) correspond to the process parameters a–i listed in Table 6.
Figure 18 shows the cross-sectional morphology of the molten pool formed under COLR at 180 W, 5 mm/s, and 50% rotation. The depth distribution was generally uniform: the center measured 226.36 μm, the left side 230.18 μm, and the right side 200.48 μm, yielding a nearly flat molten pool surface with negligible depth variation. Figure 18(b) and (c) reveals layered structures on both sides of the molten pool, formed by repeated melting–solidification cycles. At this power, the boundaries between layers appeared less distinct than those observed at lower powers.
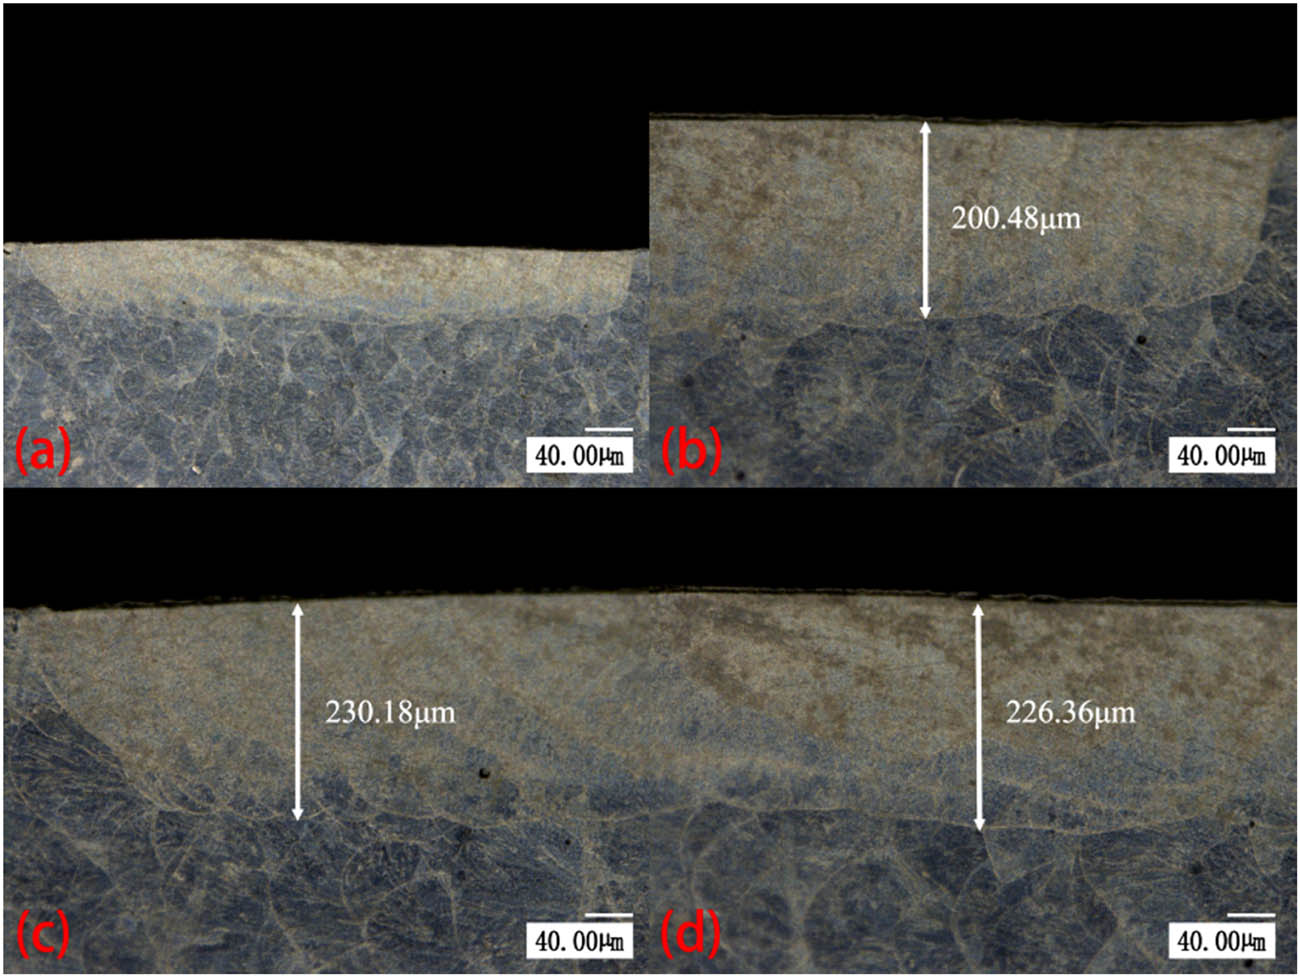
Figure 18
Remelting depth with 180 W, 5 mm/s, 50% rotation: (a) overall morphology, (b) right side, (c) left side, and (d) central region.
3.2. Response surface
3.2.1. Analysis of variance for response surface model
3.2.1.1. Analysis of variance for roughness
The analysis of variance (ANOVA) for the roughness model is summarized in Table 7. The model P-value is below 0.0001, confirming that the model is extremely significant. The strong agreement between the experimental and predicted values further verifies its high prediction accuracy. The results indicate that the single factors P, V, N; the interaction terms PN, VN; and the quadratic term P 2 all have significant effects (P < 0.05). The coefficient of determination R 2 is 0.992, meaning the model explains 99.2% of the variance. Although the model has a high signal-to-noise ratio (Adeq precision = 32.456), the noticeable difference between the adjusted R 2 (0.9817) and the predicted R 2 (0.8717) suggests the possibility of local overfitting.
Table 7
Variance analysis of roughness difference
| Source | Sum of squares | Df | Mean square | F-value | P-value | |
|---|---|---|---|---|---|---|
| Model | 2.90 | 9 | 0.3219 | 96.19 | <0.0001 | Significant |
| P | 1.98 | 1 | 0.0032 | 591.69 | <0.0001 | |
| N | 0.0528 | 1 | 0.0020 | 15.78 | 0.0054 | |
| V | 0.1485 | 1 | 0.0012 | 44.38 | 0.0003 | |
| PN | 0.0992 | 1 | 0.0001 | 29.65 | 0.0010 | |
| PV | 0.1980 | 1 | 0.0000 | 59.18 | 0.0001 | |
| NV | 0.0256 | 1 | 0.0002 | 7.65 | 0.0279 | |
| P 2 | 0.3917 | 1 | 0.0002 | 117.05 | <0.0001 | |
| N 2 | 0.0007 | 1 | 0.0000 | 0.1966 | 0.6709 | |
| V 2 | 0.0044 | 1 | 1.067E-06 | 1.33 | 0.2868 | |
| Residuals | 0.0234 | 7 | 0.0033 | |||
| Adeq precision = 32.456 | Adj. R 2 = 0.9817 | Pred. R 2 = 0.8717 | R 2 = 0.992 | |||
The presence of significant quadratic and interaction terms in the ANOVA indicated a nonlinear relationship between roughness and the process parameters. Therefore, a second-order polynomial model was fitted to the experimental data using Design-Expert software. The resulting quadratic model expresses roughness (R) as a function of the three factors – laser power (P), scanning speed (V), and rotation speed (N) – and is given by equation (1):
In the equation, η is the roughness of the sample (unit: μm).Equation (1) quantifies the direction and relative magnitude of each process parameter’s effect on roughness. Among the selected factors, laser power (P) had the strongest influence, followed by rotation speed (N) and scanning speed (V). Roughness decreased with increasing P and N, whereas it increased with increasing V. The diagnostic plot of actual versus predicted roughness (Figure 19) shows that all data points lie close to the 45° reference line, confirming strong agreement between the experimental data and the model predictions. This validates the adequacy of the quadratic model for predicting surface roughness within the investigated parameter space.
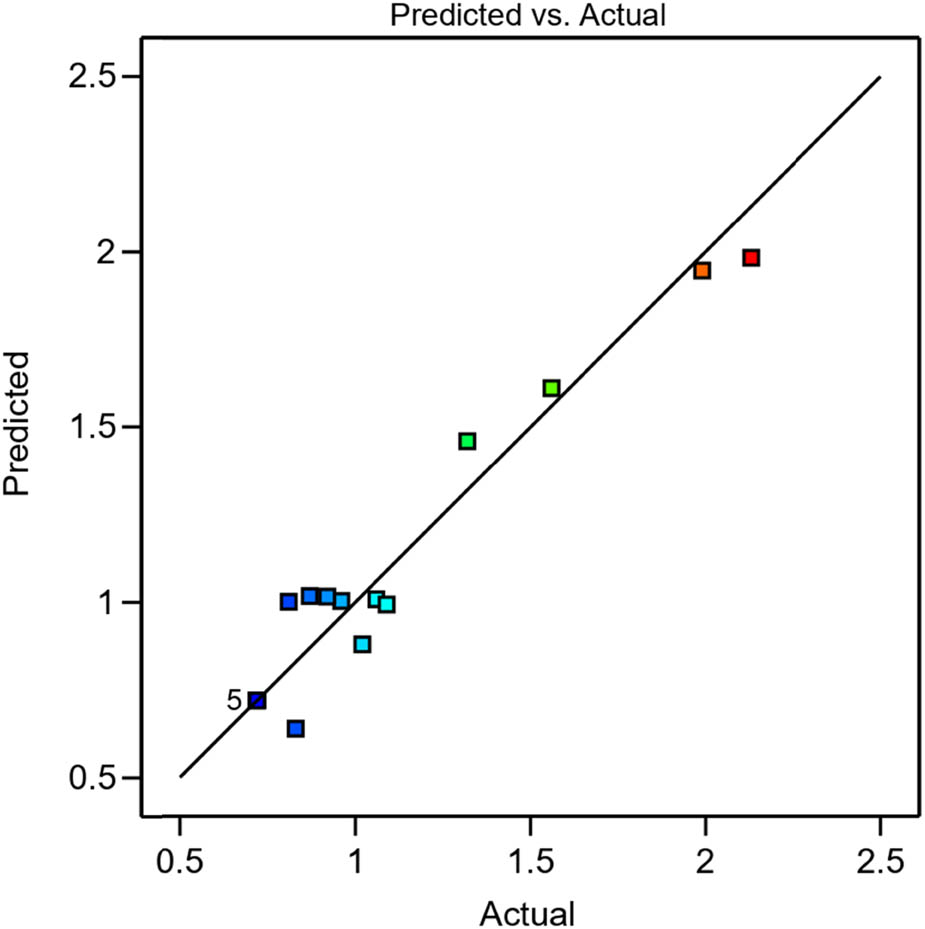
Figure 19
Comparison between actual and predicted roughness difference values.
3.2.1.2. Analysis of variance for remelting depth
The ANOVA results for the remelting depth model are presented in Table 8. The model was highly significant (P < 0.0001). The single factors P and N, the interaction term PN, and the quadratic terms P 2 and V 2 all had significant effects (P < 0.05). The model exhibited an R 2 of 0.9975, with Adj. R 2 and Pred. R 2 in close agreement. The Adeq Precision of 56.32, well above the minimum required value of 4, confirms the model’s predictive accuracy and reliability.
Table 8
Variance analysis of remelting depth
| Source | Sum of squares | Df | Mean square | F-value | P-value | |
|---|---|---|---|---|---|---|
| Model | 64139.87 | 9 | 7126.65 | 311.30 | <0.0001 | Significant |
| P | 59168.00 | 1 | 59168.00 | 2584.56 | <0.0001 | |
| N | 2346.13 | 1 | 2346.13 | 102.48 | <0.0001 | |
| V | 45.13 | 1 | 45.13 | 1.97 | 0.2031 | |
| PN | 289 | 1 | 289 | 12.62 | 0.0093 | |
| PV | 64 | 1 | 64 | 2.80 | 0.1384 | |
| NV | 0.2500 | 1 | 0.2500 | 0.0109 | 0.9197 | |
| P 2 | 1923.75 | 1 | 1923.75 | 84.03 | <0.0001 | |
| N 2 | 55.33 | 1 | 55.33 | 2.42 | 0.1640 | |
| V 2 | 133.22 | 1 | 133.22 | 5.82 | 0.0466 | |
| Residuals | 160.25 | 7 | 22.89 | |||
| Adeq precision = 56.2042 | Adj. R 2 = 0.9943 | Pred. R 2 = 0.9601 | R 2 = 0.9975 | |||
The test data were fitted, and based on the second-order polynomial equation, a quadratic polynomial nonlinear response surface mathematical model with remelting depth as the response quantity and P, V, and N as the response variables was established. The constructed remelting depth mathematical model is shown in equation (2):
ΔΦ represents the remelting depth treated by the circular oscillation mode (unit: μm).According to equation (2), laser power (P) had the strongest effect on remelting depth, followed by rotation speed (N) and scanning speed (V). Remelting depth increased with P but decreased with N and V. Figure 20 compares the measured and predicted remelting depths; all data points lie close to the 45° reference line, confirming excellent agreement between measured and predicted values. This close agreement validates the model’s goodness-of-fit and confirms its ability to capture the quantitative relationship between process parameters and remelting depth.
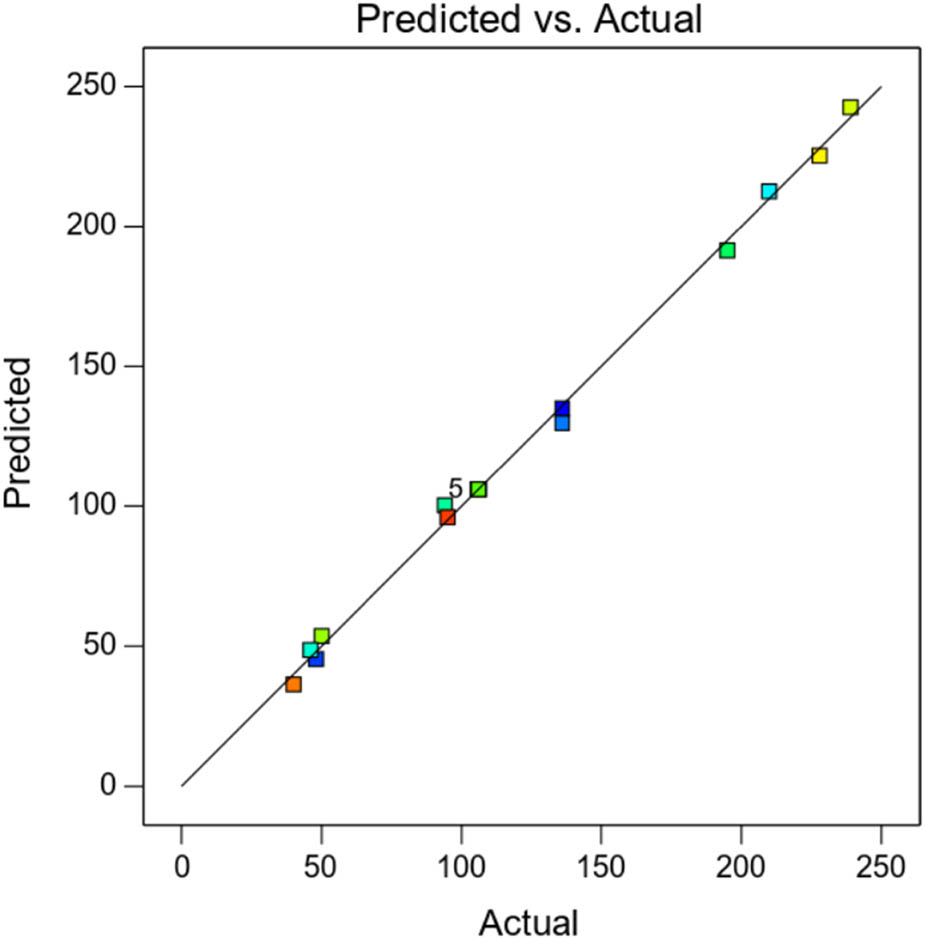
Figure 20
Comparison between actual and predicted values of the difference in depth of the molten pool.
3.2.2. Influence of process parameters on roughness
Figure 21 illustrates the individual effects of each process parameter on surface roughness around the design center. Roughness decreased markedly as laser power increased from 120 W to about 160 W, after which the decline leveled off. Rotation speed (N) exhibited a weak negative linear effect, while scanning speed (V) displayed a similarly weak positive linear effect. Overall, laser power was the dominant factor controlling surface roughness. Its strong influence is attributed to the increased energy density, which enhances surface melting and, together with the stirring action of the oscillating beam, promotes a smoother resolidified surface.
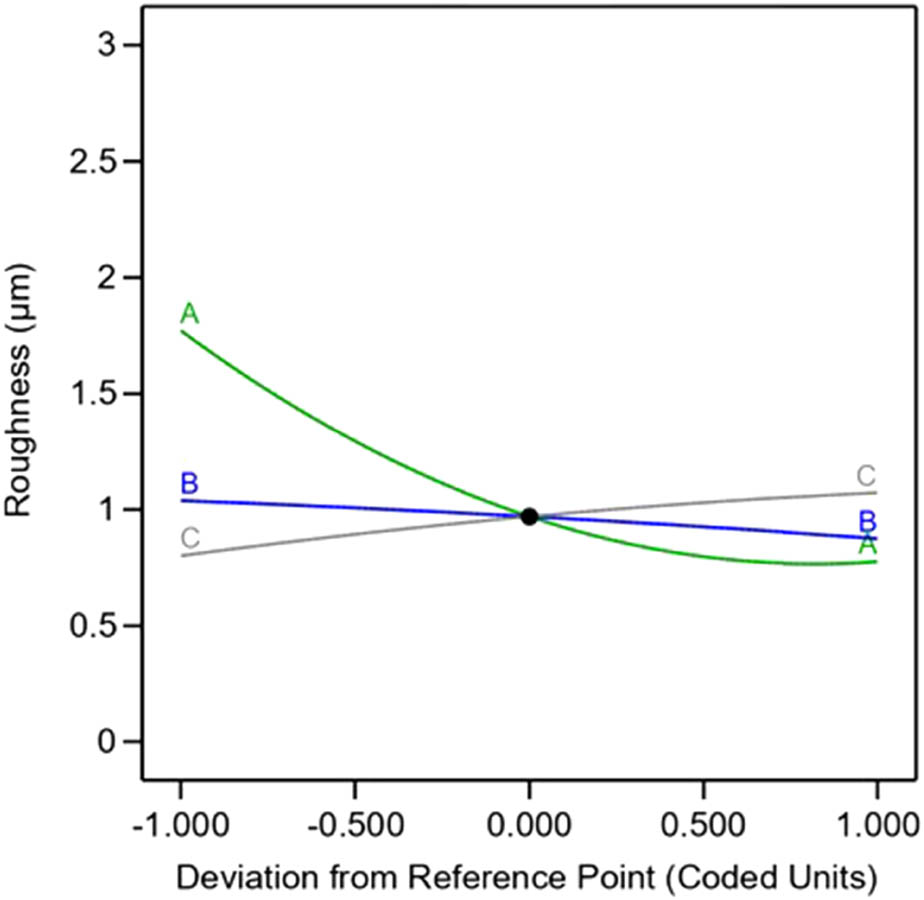
Figure 21
Disturbance diagram of roughness.
Figure 22 illustrates the interactive effect of laser power and scanning speed on surface roughness. Surface roughness reached a minimum at laser powers of 150–170 W and scanning speeds of 4–5.5 mm/s; beyond this power range, roughness increased slightly. Overall, roughness was more sensitive to laser power than to scanning speed. Higher laser power increases the energy density per unit area, promoting complete surface melting, whereas higher scanning speed shortens the irradiation time and reduces the total energy input. The contour and response surface plots confirmed a local minimum roughness region under these combined parameter windows.
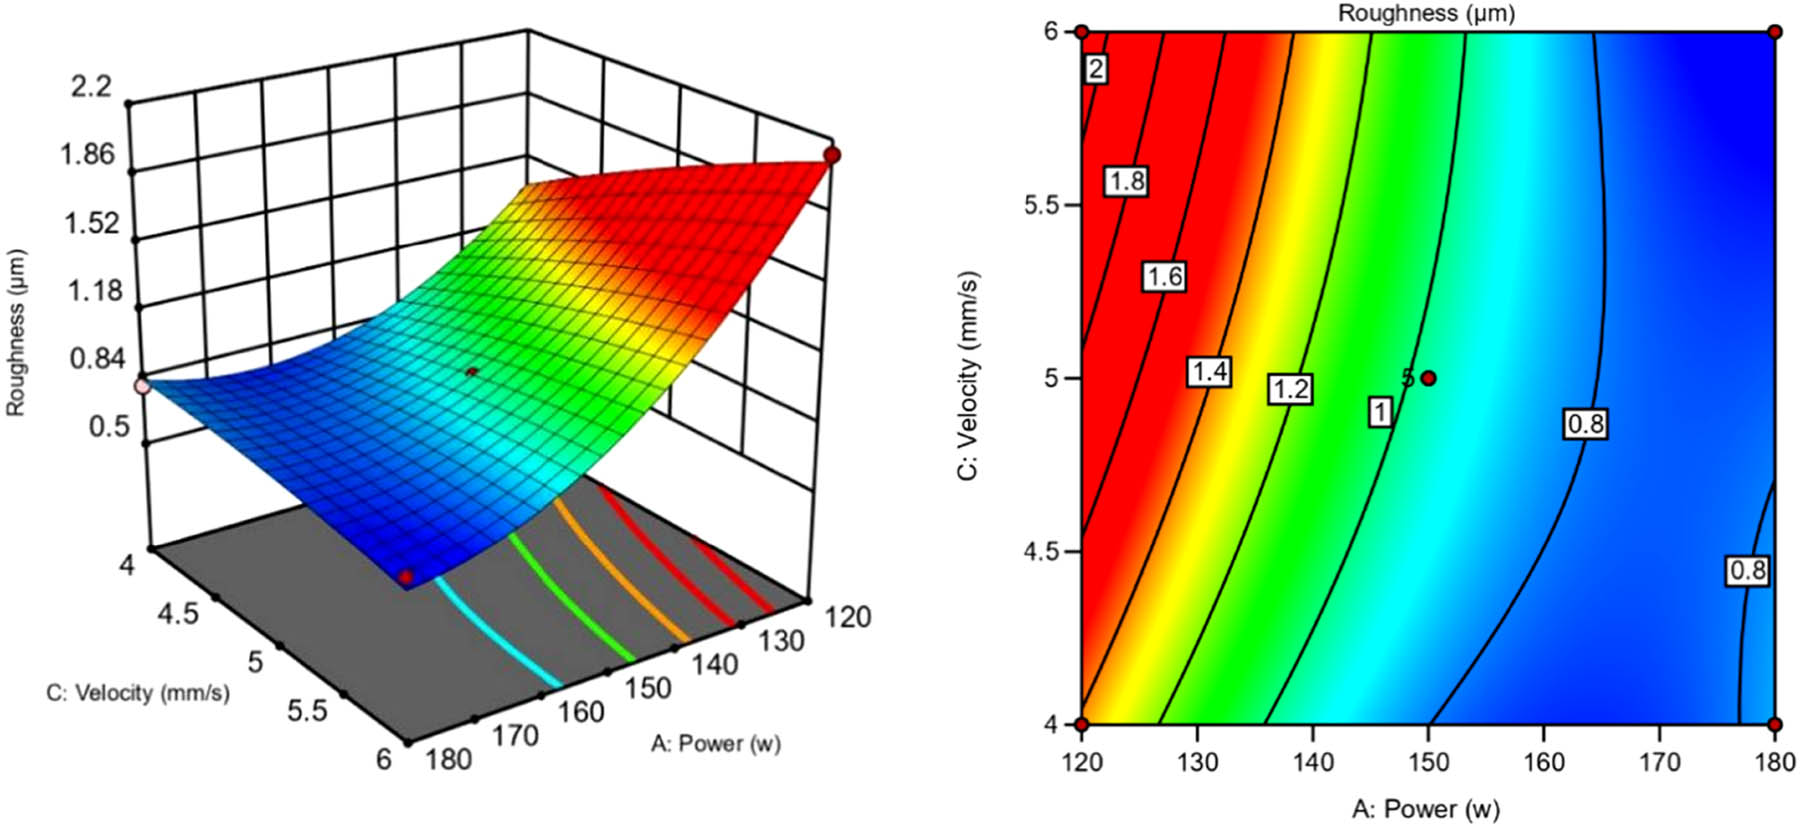
Figure 22
Contour lines and response surfaces of the interaction between laser power and scanning speed.
Figure 23 shows the interactive effect of laser power and rotation speed on surface roughness. As shown in Figure 23, roughness decreased with increasing laser power and rotation speed. This trend is attributed to two factors. Higher laser power and rotation speed increase the energy absorbed by the surface, promoting more complete melting. Simultaneously, higher rotation speed intensifies the stirring of the molten pool. The combined effect enhances melt fluidity, leading to a smoother surface and lower roughness. The lowest roughness values were obtained at laser powers of 150–180 W and rotation speeds of 50–60%.
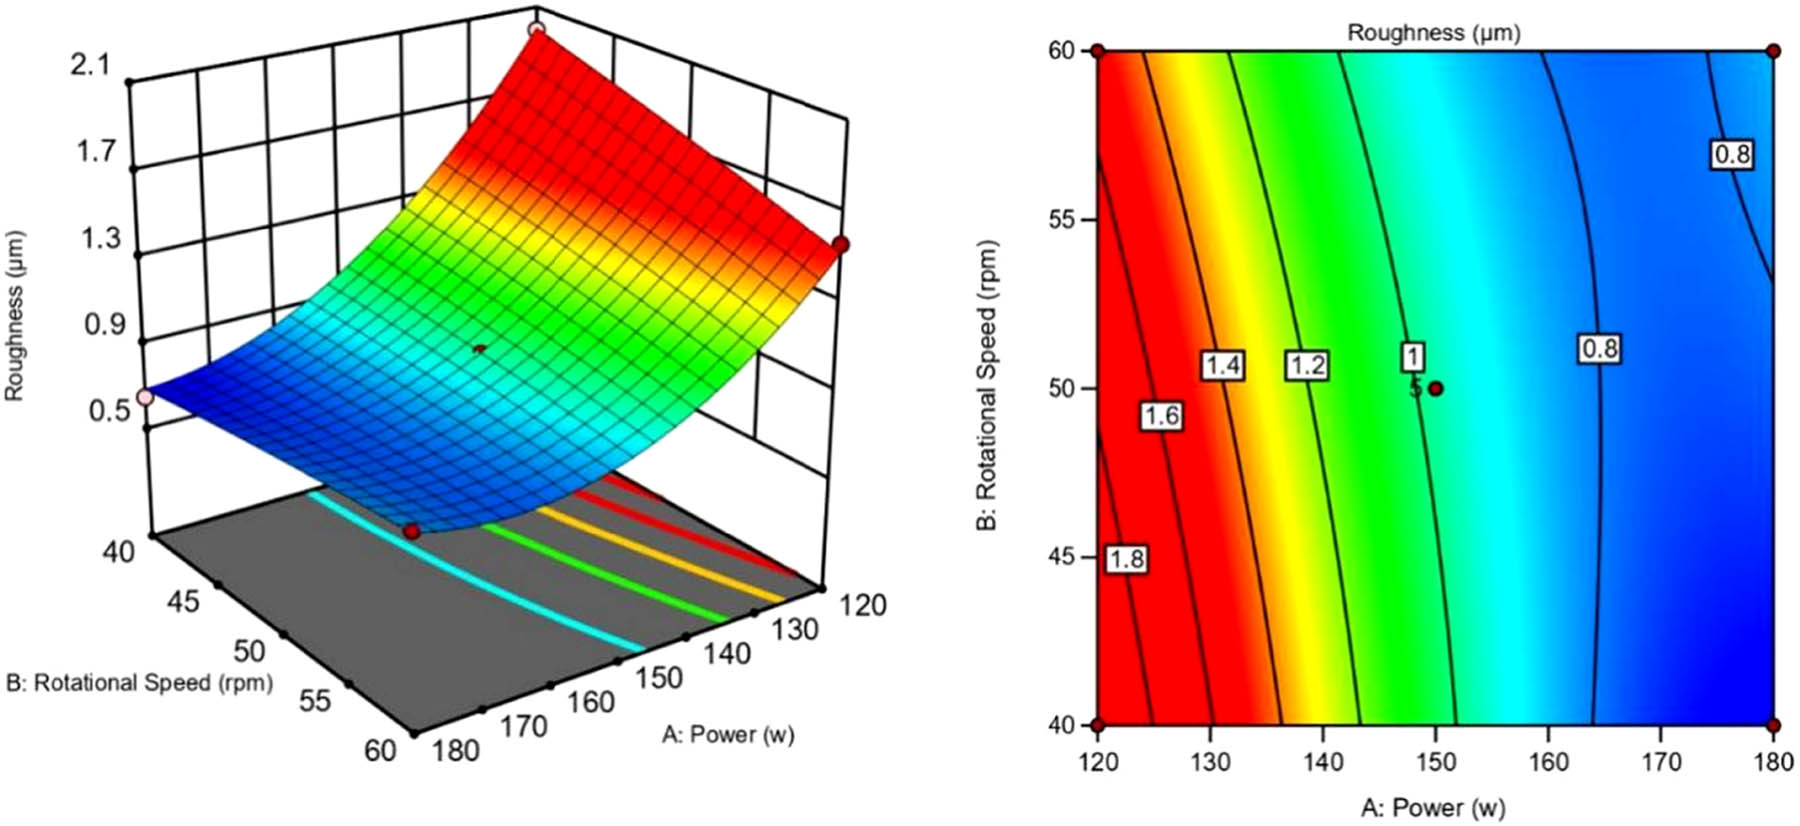
Figure 23
Contour lines and response surfaces of the interaction between laser power and rotational speed.
Figure 24 shows the interactive effect of scanning speed and rotation speed on surface roughness. Roughness was lowest at scanning speeds of 4–5 mm/s and rotation speeds of 50–60%. Compared with the interactions involving laser power (Figures 22 and 23), this interactive effect was considerably weaker.
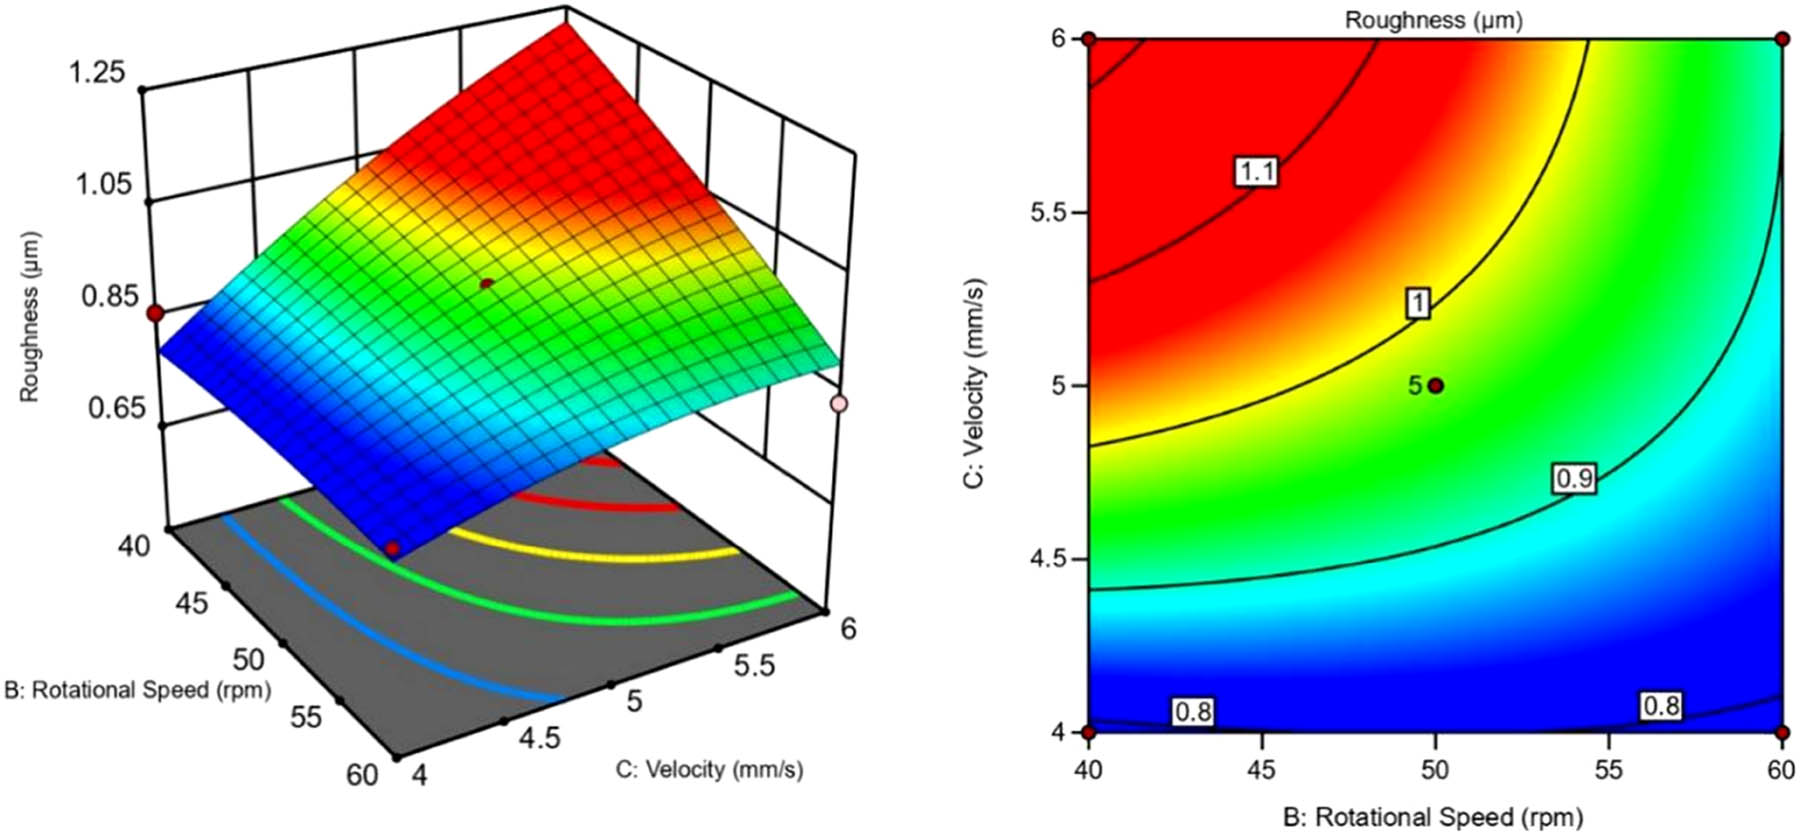
Figure 24
Interaction between scanning speed and rotational speed contour lines and response surfaces.
The aforementioned analysis indicates that low surface roughness is primarily driven by high energy density. High energy density results from a combination of high laser power, low scanning speed, and high rotation speed. Simultaneously, higher rotation speed intensifies the stirring of the molten pool, which helps eliminate near-surface defects and promotes a denser remelted layer. This combination not only reduces surface roughness but also improves the surface integrity of the remelted layer.
3.2.3. Influence of process parameters on remelting depth
Figure 25 illustrates the individual effects of each process parameter on remelting depth around the design center. Molten pool depth increased monotonically with laser power from 120 to 180 W. Rotation speed (N) exhibited a weak negative linear effect, whereas scanning speed (V) showed a negligible influence, with depth varying only slightly across the investigated range. Overall, laser power was the dominant factor governing remelting depth, with rotation speed and scanning speed playing secondary roles.
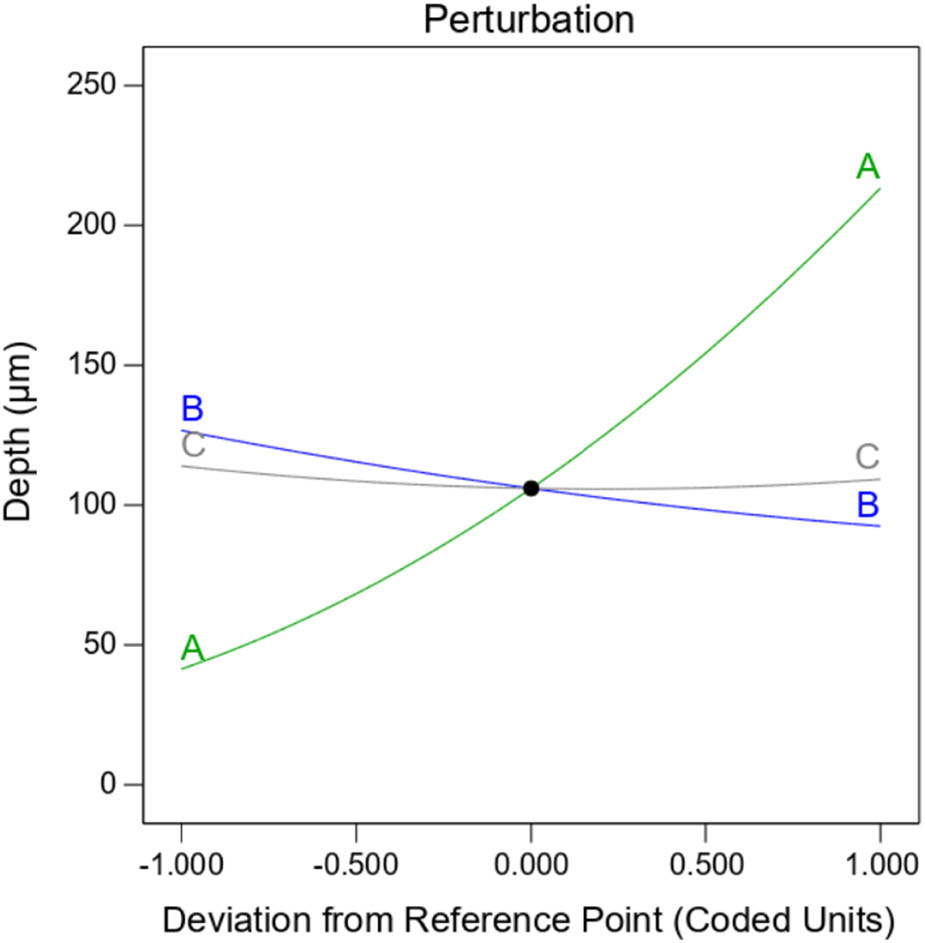
Figure 25
Disturbance diagram of molten pool depth.
Figure 26 shows the interactive effect of laser power and scanning speed on molten pool depth. Depth increased steadily as laser power rose from 120 to 180 W. In contrast, scanning speed had no significant effect on depth. This is because higher laser power increases the energy density, allowing more energy to be absorbed by the surface and promoting deeper melting. The shallowest depth was consistently found at 120 W, independent of scanning speed.
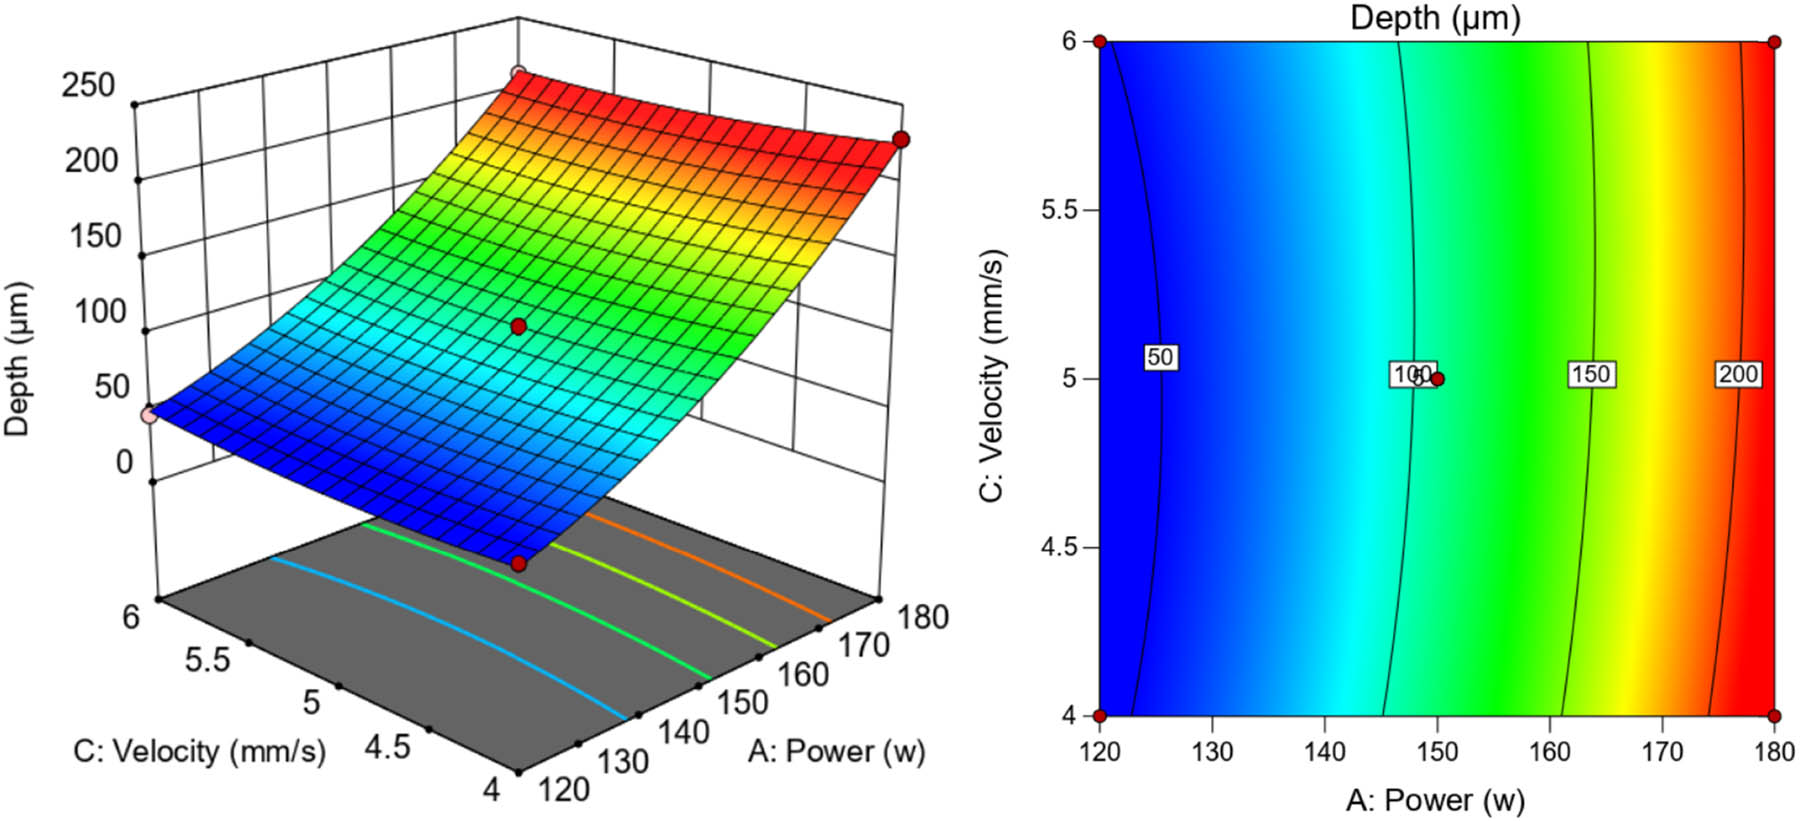
Figure 26
Contour lines and response surfaces of the interaction between laser power and scanning speed.
Figure 27 shows the interactive effect of laser power and rotation speed on molten pool depth. As shown in Figure 27, depth increased with higher laser power and lower rotation speed. Higher laser power and lower rotation speed increase the energy absorbed by the surface, thereby increasing the thermal penetration depth. Together, these two factors substantially promoted deeper remelting. The maximum depth was obtained at 180 W combined with the lowest rotation speed.
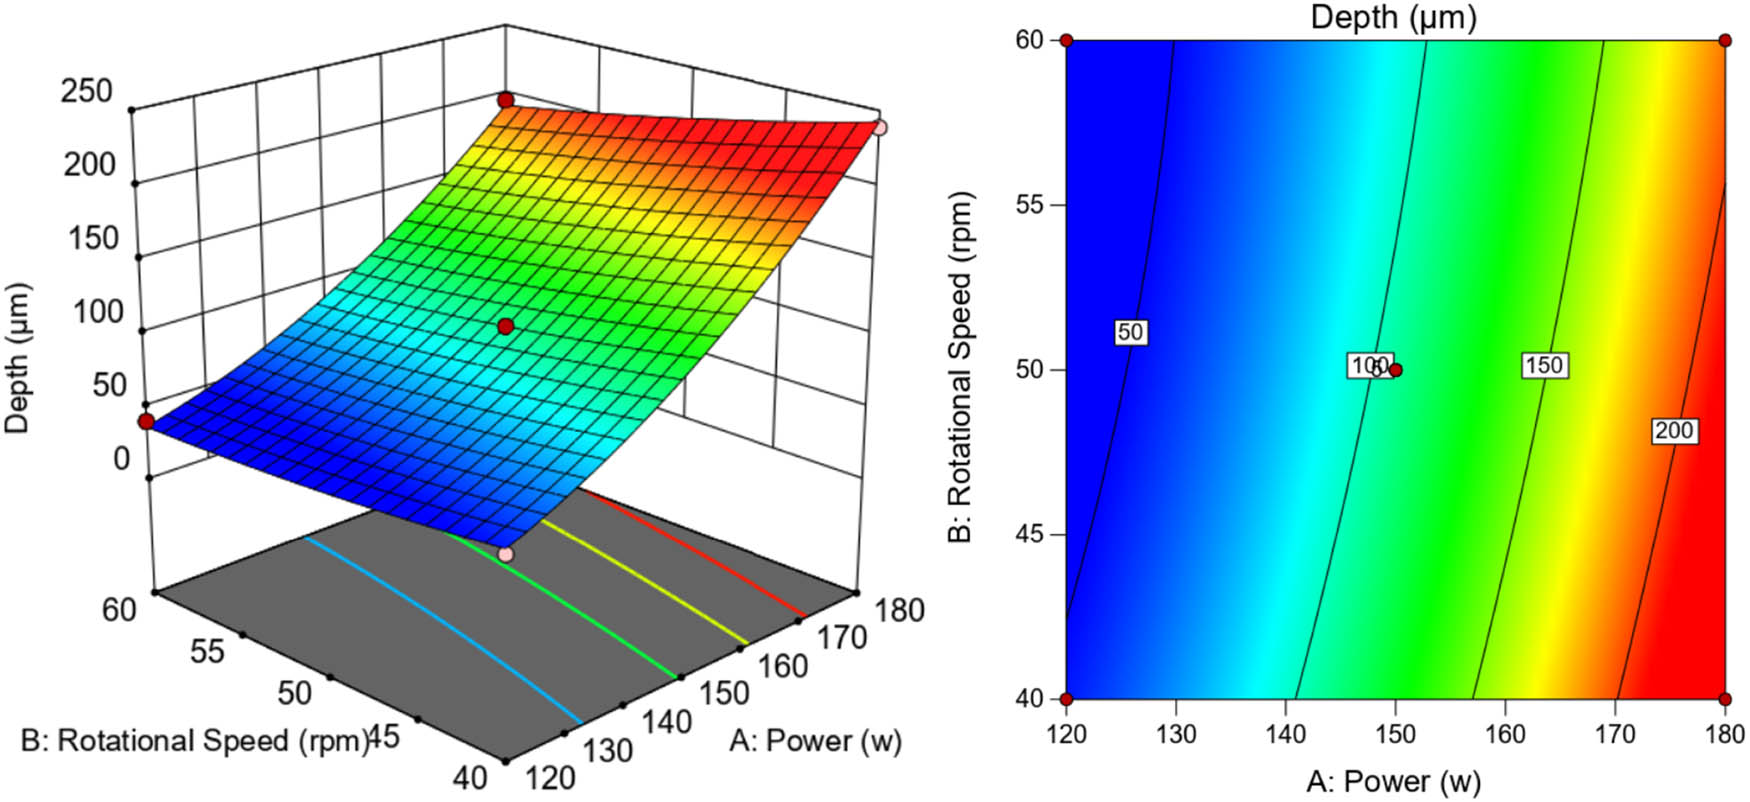
Figure 27
Contour lines and response surfaces of the interaction between laser power and rotational speed.
Figure 28 shows the interactive effect of scanning speed and rotation speed on molten pool depth. Depth was minimized at a combination of moderate scanning speed (5 mm/s) and high rotation speed (60%). Compared with the interactions involving laser power (Figures 26 and 27), this interactive effect was considerably weaker.
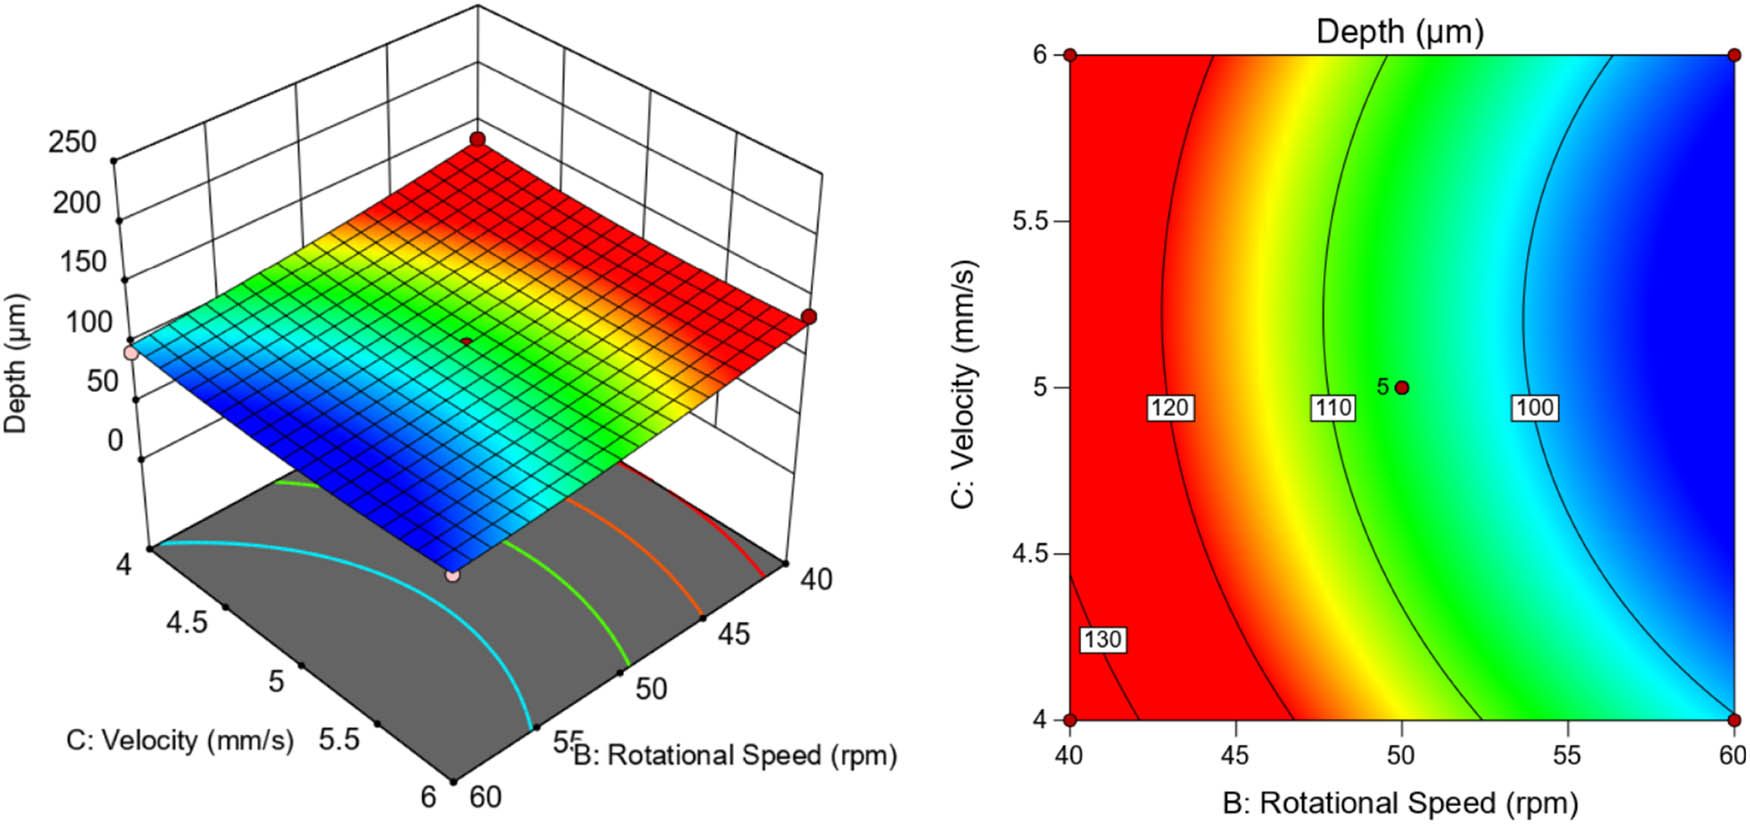
Figure 28
Interaction between scanning speed and rotational speed contour lines and response surfaces.
The aforementioned analysis indicates that the increase in molten pool depth with COLR is primarily driven by higher effective energy density. Specifically, higher laser power, lower scanning speed, and lower rotation speed all contributed to higher energy input. In addition, the circular beam stirring at an optimal rotation speed helped to stabilize the molten pool, promoting a consistent remelting depth.
3.3. Mechanical properties
3.3.1. Hardness test
Figure 29 presents the hardness test results under the parameters of laser power 180 W, scanning speed 5 mm/s, and rotation speed 40%. First, the hardness of the specimen matrix was measured at test points 4, 5, and 6 in Figure 29(b), with average values of 224, 218, and 223 HV, respectively. According to the hardness data of each test point in Figure 29, the average hardness values of test points 1, 2, and 3 in the molten pool region are 243, 249, and 242 HV, all higher than those of the matrix material. Therefore, compared with the matrix, COLR treatment can improve the hardness of additively manufactured 316L stainless steel.
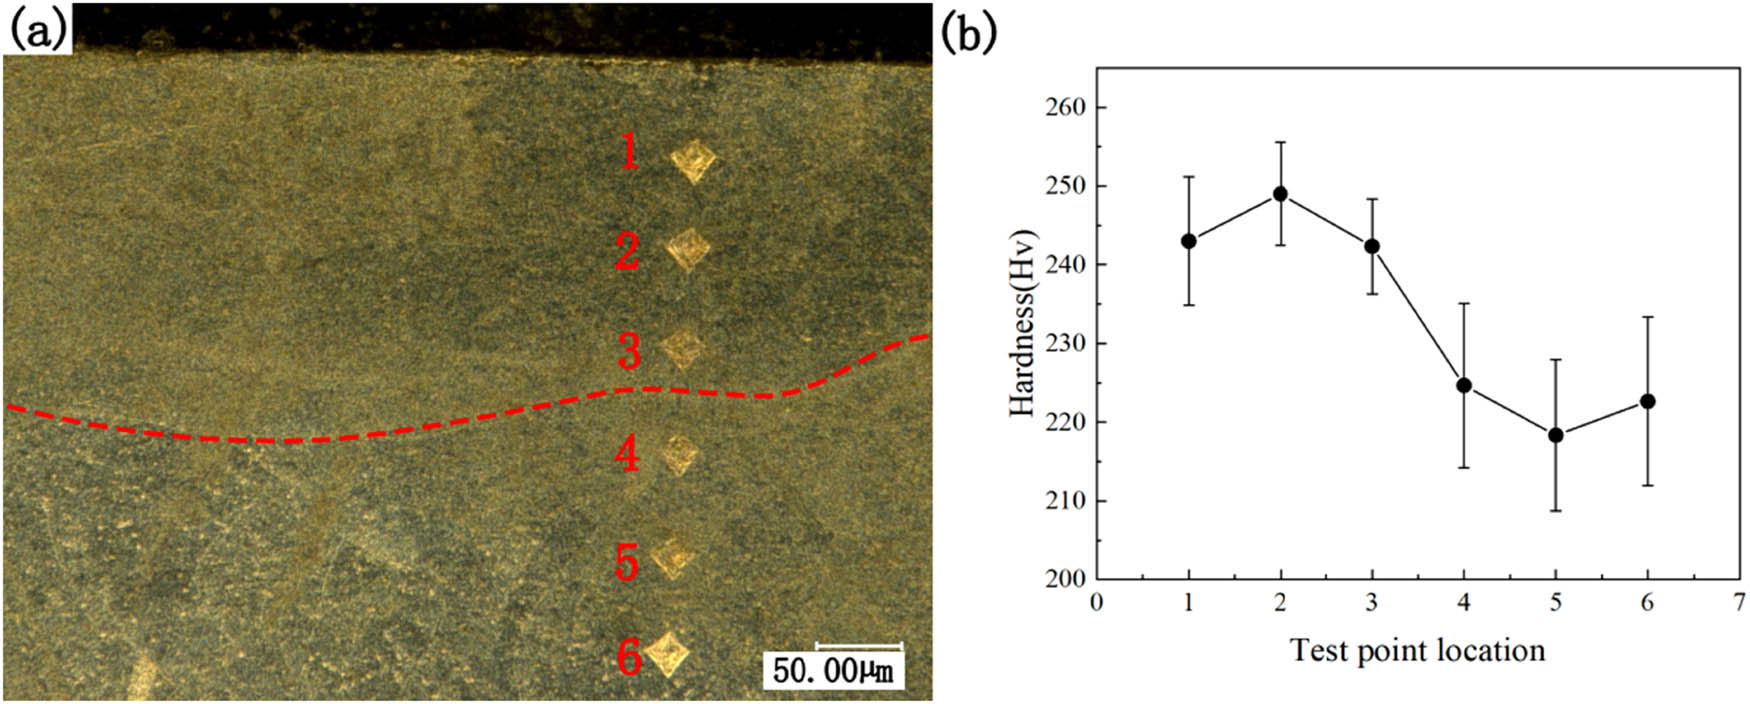
Figure 29
Microhardness test results: (a) longitudinal measurement locations and (b) line graph of measurement data.
3.3.2. Microstructure
Metallographic and SEM analyses were performed to characterize the molten pool morphology and substructure distribution resulting from COLR. Systematic SEM characterization was carried out on samples processed under different parameters to investigate the evolution of molten pool morphology and microstructural characteristics, providing a microstructural basis for understanding the underlying mechanisms. A distinct stratification was observed at the edge of the COLR-treated molten pool. The fusion lines bounding these layers were parallel near the top surface but converged at greater depths. This structure results from repeated melting and solidification cycles caused by the circular beam stirring, producing a distinct remelting zone, as shown in Figure 30.
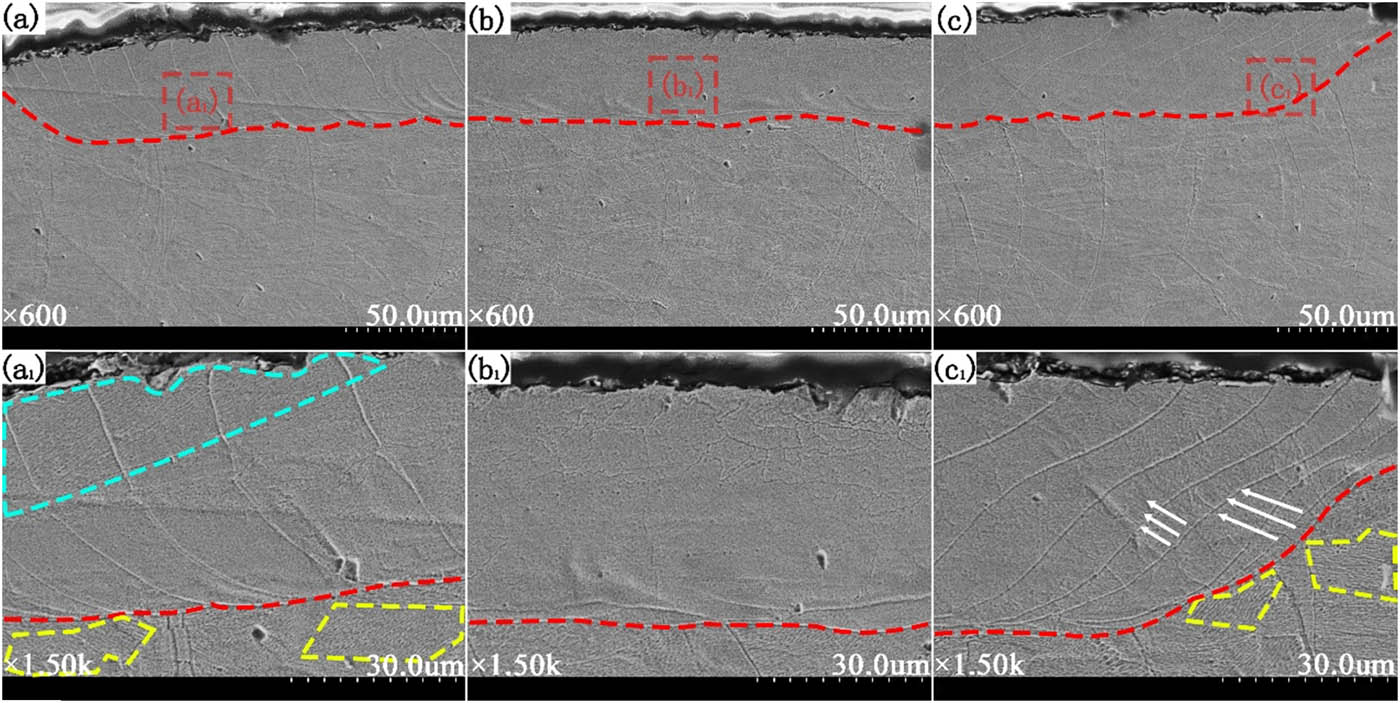
Figure 30
Microscopic morphology of heat affected zone after 120 W power remelting: (a) left side, (b) central region, (c) right side, (a1) magnified view of the a1 region in (a), (b1) magnified view of the b1 region in (b), and (c1) magnified view of the c1 region in (c).
Figure 30 shows the substructure morphology of the sample remelted by COLR at 120 W. In Figure 30(a), the region bounded by the red and yellow dashed lines contains numerous columnar crystals within the grains. These columnar crystals – also referred to as fibrous subgrains – exhibit a high aspect ratio and varied growth orientations. After COLR at 120 W, a limited number of these columnar crystals were observed, predominantly located in the edge region of the molten pool (Figure 30(a1) and (c1)). No equiaxed grains were observed within the molten pool. These columnar crystals displayed strong directionality, growing perpendicular to the melt pool–matrix interface and oriented toward the center.
Figure 31 shows the microstructural characteristics of the molten pool after COLR at 150 W. SEM observations revealed the distribution of the solidified structure. In Figure 31(a–c), the area above the red dashed line corresponds to the COLR molten pool, whereas the area below shows the microstructure of the base material.
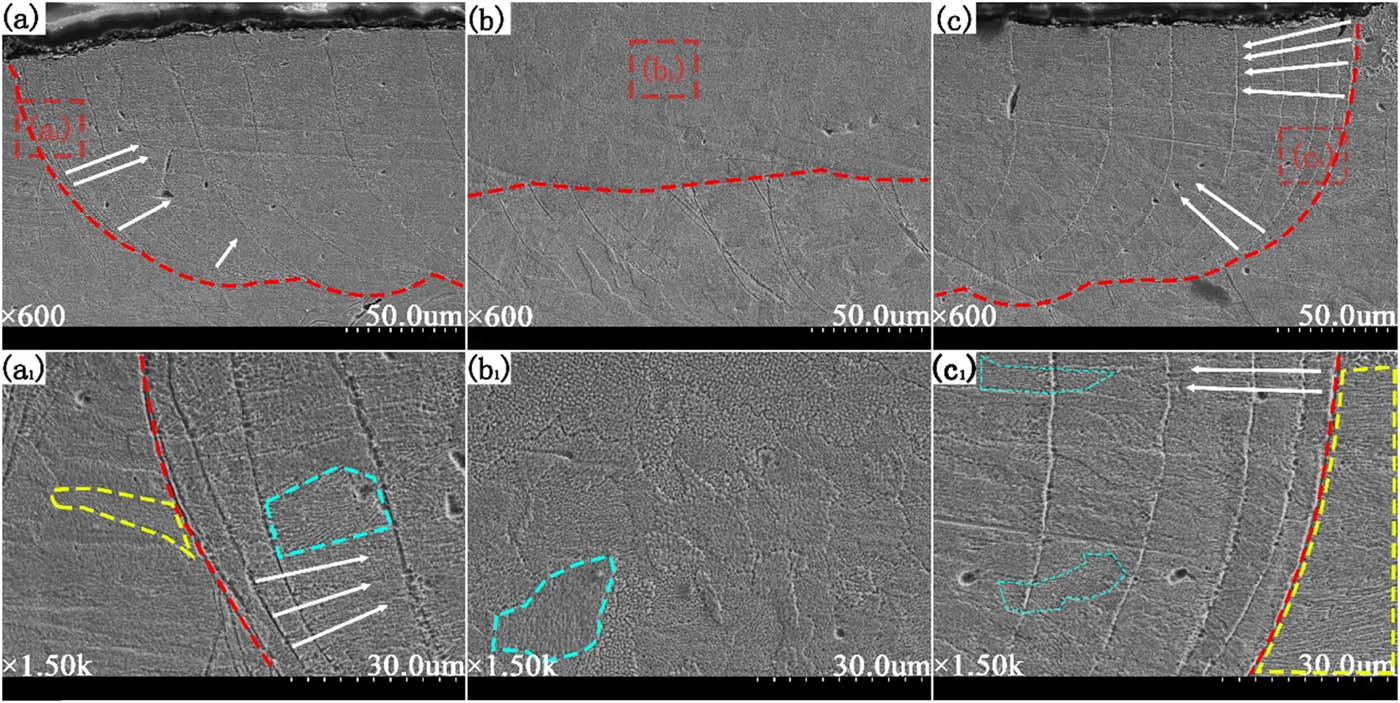
Figure 31
Microscopic morphology of heat-affected zone after 150 W power remelting: (a) left side, (b) central region, (c) right side, (a1) magnified view of the a1 region in (a), (b1) magnified view of the b1 region in (b), and (c1) magnified view of the c1 region in (c).
The center of the molten pool in Figure 31 consisted predominantly of equiaxed grains, interspersed with a small number of short columnar crystals (blue dashed box). This equiaxed morphology arises from the low-temperature gradient in the central region (Figure 31(b1)). In the region marked in Figure 31(c1), the columnar crystals displayed a multidirectional growth pattern. Most grew radially toward the center, whereas a few deviated from this orientation. These deviations are attributed to local compositional segregation or disturbances in the heat flow. Compared with the low-power (120 W) condition, the columnar crystals at the boundary were more densely distributed and coarser, and the grain boundaries appeared sharper. The grain size in the edge region was noticeably larger than that at the center. This size gradient reflects the spatial variation in cooling rate across the molten pool: under the current conditions, the edge region experienced a relatively lower cooling rate, allowing more extensive grain growth.
Figure 32 shows the cross-sectional microstructure of the sample after COLR at 180 W. SEM observations revealed the distribution of the solidified structure. In Figure 32(a–c), the area above the red dashed line corresponds to the COLR molten pool, whereas the area below shows the microstructure of the base material.
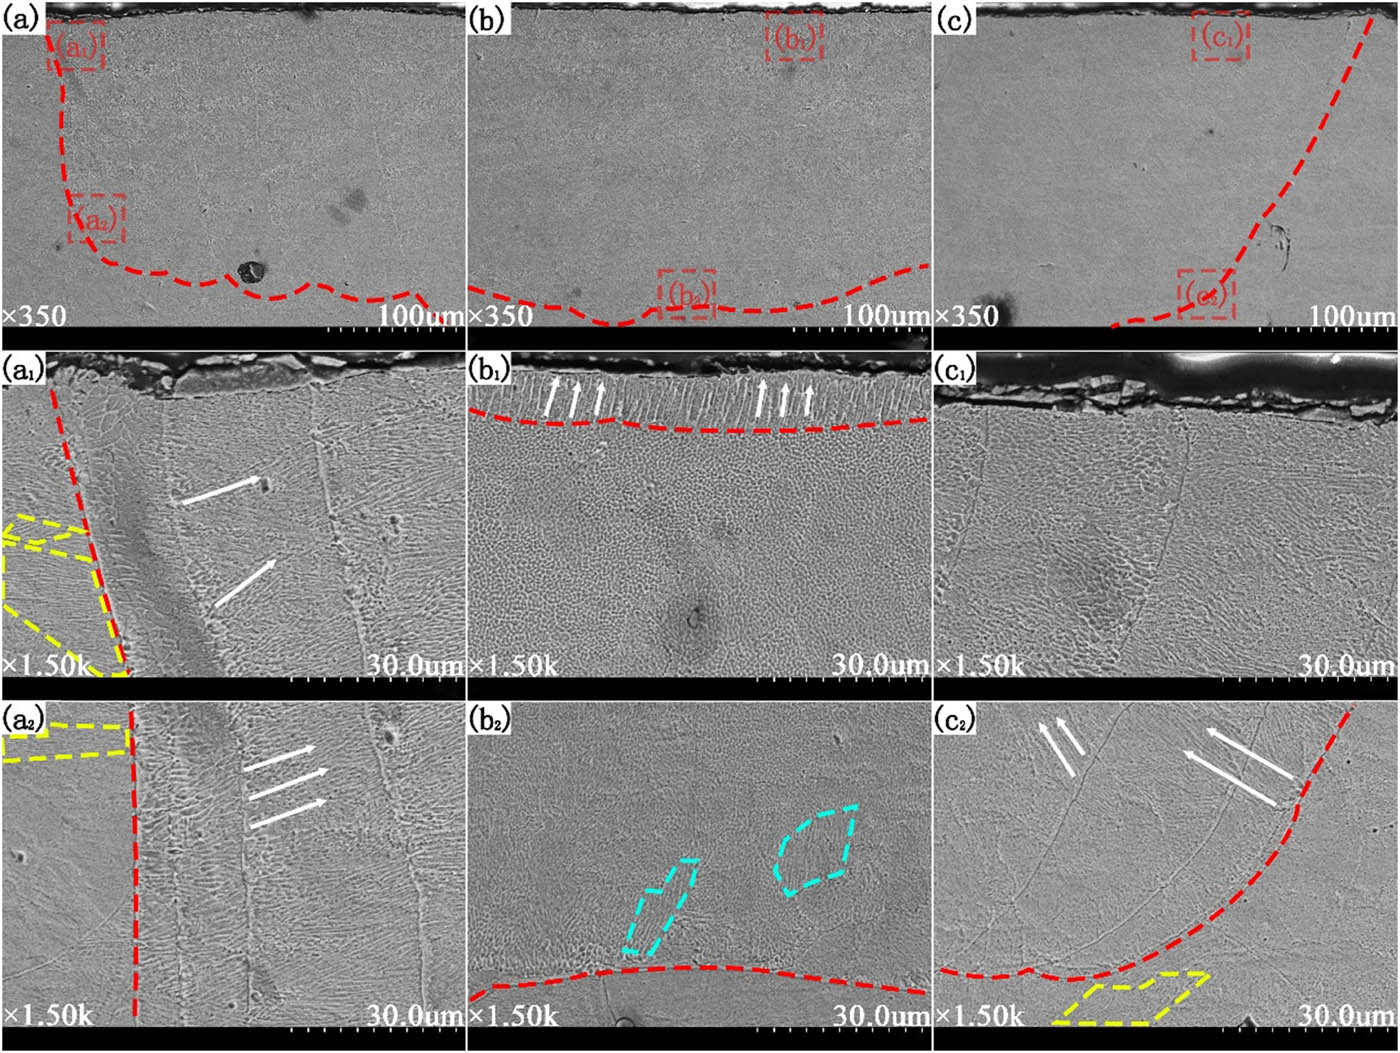
Figure 32
Microscopic morphology of heat-affected zone after 180 W power remelting: (a) left side, (b) central region, (c) right side, (a1) magnified view of the a1 region in (a), (b1) magnified view of the b1 region in (b), (c1) magnified view of the c1 region in (c), (a2) magnified view of the a2 region in (a), (b2) magnified view of the b2 region in (b), and (c2) magnified view of the c2 region in (c).
The center of the molten pool consisted mainly of equiaxed grains, with a thin layer of columnar crystals (∼10 μm thick) on the outermost surface (Figure 32(b1)). In the upper half of the molten pool, the edge of the remelting zone exhibited a multicolumnar grain structure. The grains in the remelting zone were noticeably coarser than the dendrites formed during initial solidification. Moreover, the remelted dendrites displayed a highly consistent growth orientation (Figure 32(a1), (b1), and (c1)). The bottom of the molten pool also consisted of equiaxed grains. The grain structure on both sides of the pool bottom was less distinct than that in the upper region, yet the growth direction remained oriented toward the center (Figure 32(a2), (b2), and (c2)).
4. Conclusions
This study applied COLR to postprocess SLS-fabricated 316L stainless steel, demonstrating its effectiveness in improving surface integrity and microstructure. The main conclusions are summarized as follows:
(1) COLR substantially improved the surface quality. Under the optimal parameters of 180 W, 5 mm/s, and 40% rotation, the surface roughness was reduced by approximately 91%, from ∼7.3 μm (as-built) to a minimum of 0.65 μm. Surface-adhered spherical particles, microcracks, and near-surface pores within the remelted layer were substantially reduced.
(2) Laser power strongly influenced the molten pool depth and microstructure. At 120 W, the pool was shallow (40–50 μm) and contained sparse columnar grains. At 150 W, the depth increased to 94–136 μm with a composite columnar-equiaxed structure. At 180 W, the pool reached 195–239 μm, with a thin (∼10 μm) columnar grain layer on the outermost surface of the central region.
(3) Surface morphology varied considerably with laser power. At 120 W, insufficient energy density produced serrated undulations. At 150 W, black spot-like micro-protrusions formed (∼23.41 μm in width and ∼1.00 μm in height). At 180 W, excessive energy density destabilized the molten pool, generating spatter particles at the track edges. Precise control of laser power is therefore essential for optimizing surface morphology.
(4) Under the optimal process parameters of 180 W, 5 mm/s, and 40% rotation, COLR treatment increased the average microhardness of the remelted zone from approximately 222 HV (substrate) to 249 HV, corresponding to an increase of approximately 12%. While this indicates a tendency for surface hardening, further replicate measurements across the full parameter space are needed to confirm statistical significance.
Limitations and future work. Defect characterization in this study relied on cross-sectional optical microscopy; future work employing X-ray CT or the Archimedes method is recommended for volumetric porosity quantification. Mechanical evaluation was limited to microhardness as an initial indicator; comprehensive tensile, fatigue, and corrosion testing across the full parameter space is needed to fully assess engineering applicability.
Funding information
Authors state no funding involved.
Author contributions
Conceptualization: G.L., P.L., and Z.S.; methodology: G.L., P.L., and Z.S.; software: G.L., P.L., and J.S.; validation: P.L., J.S., X.Z., and H.W.; formal analysis: G.L., P.L., J.S., and X.Z.; investigation: G.L. and Z.S.; resources: G.L., Z.S., and H.W.; data curation: J.S. and X.Z.; visualization: J.S. and X.Z.; writing – original draft preparation: J.S., X.Z., and H.W.; writing – review and editing: G.L. and Z.S.; supervision: Z.S.; project administration: G.L. and P.L.
Conflict of interest statement
The authors state that no conflict of interest.