
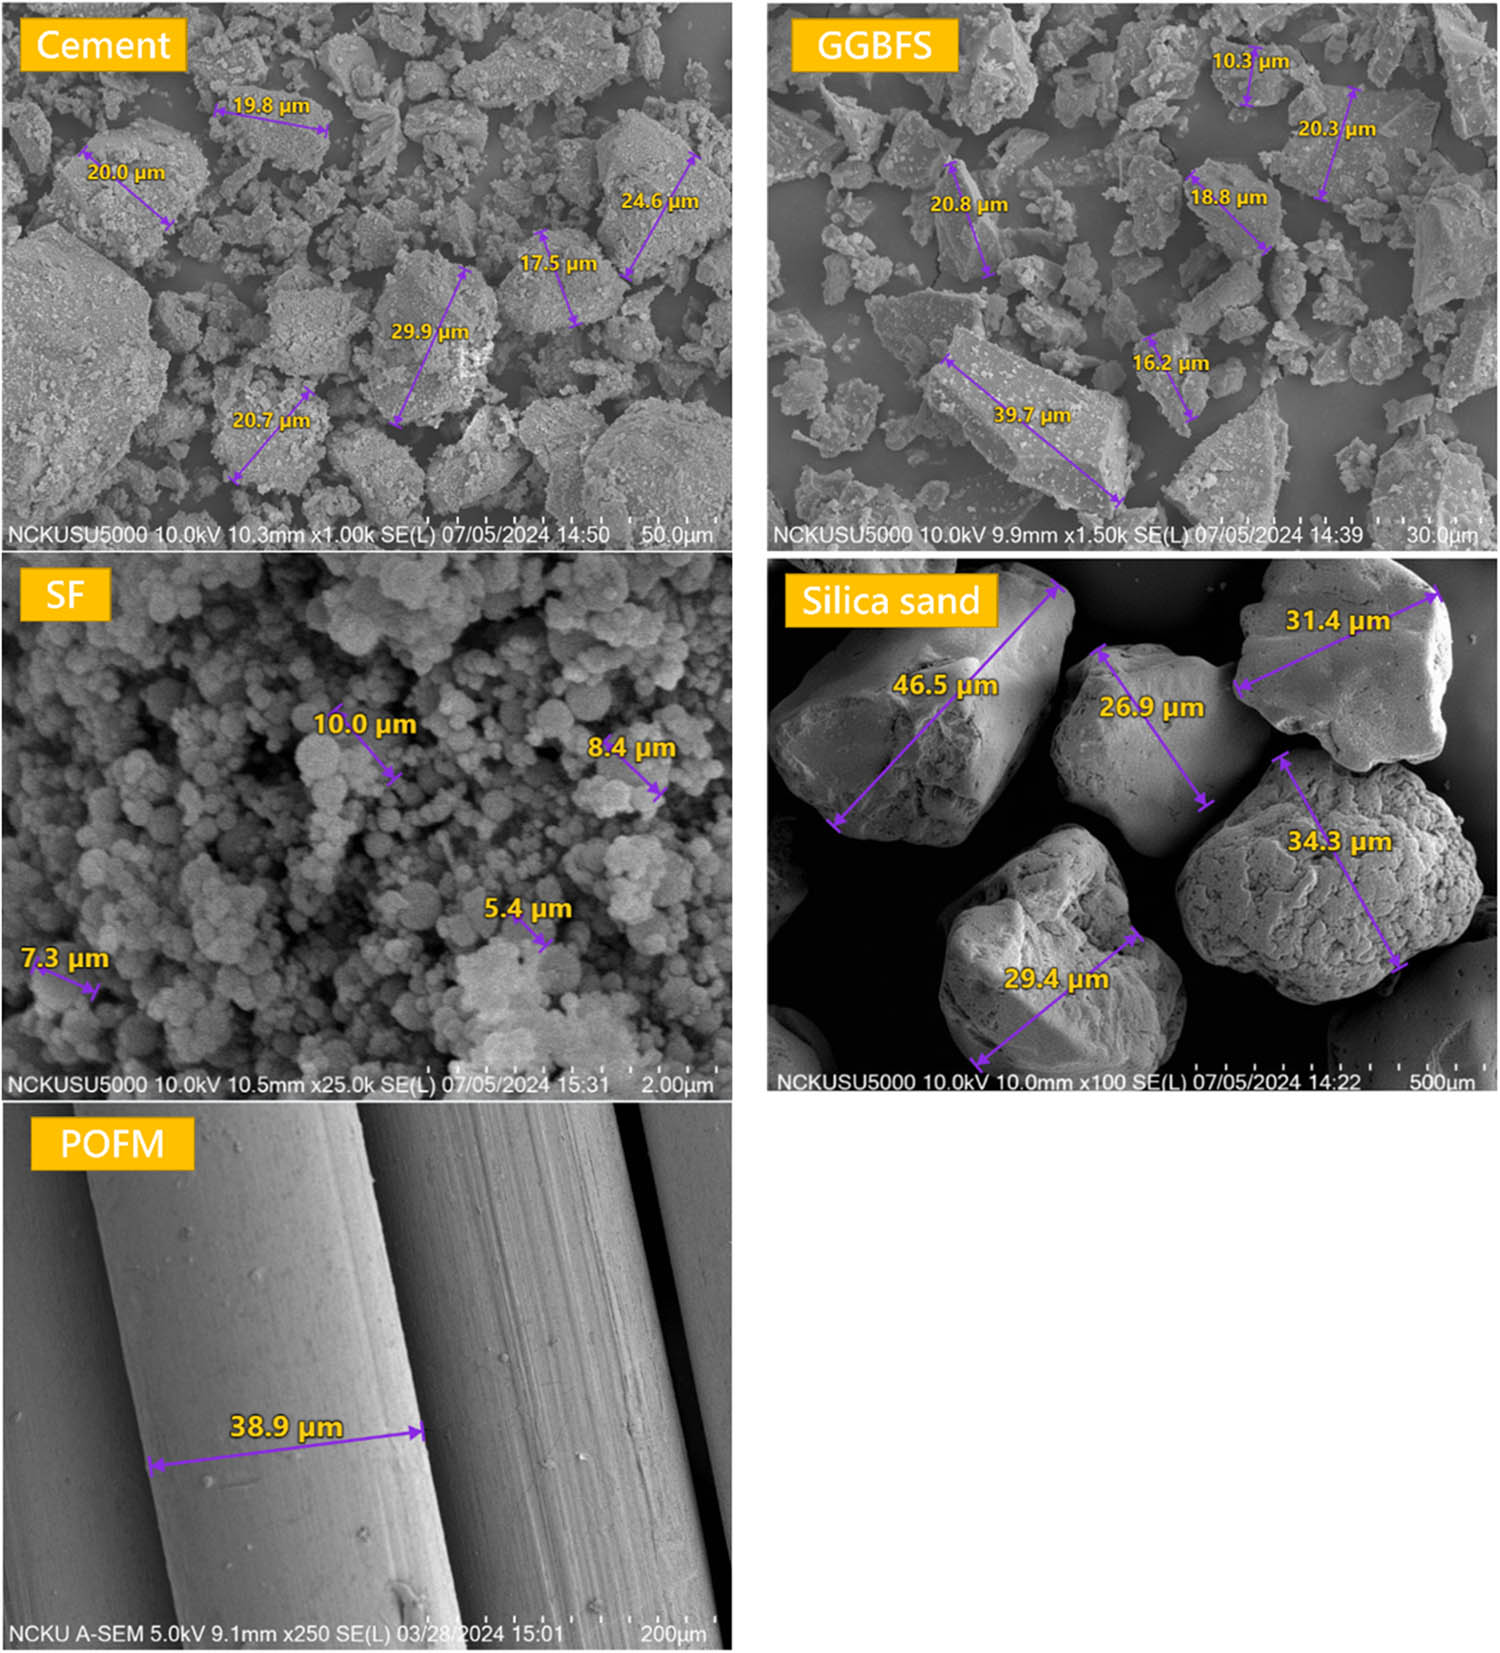
Figure 1
Scanning electron microscopy (SEM) image of materials.
Table 1
Chemical compositions of materials (wt%).
| Component | SiO2 | Al2O3 | Fe2O3 | CaO | MgO | SO3 | LOI | Na2O | K2O |
|---|---|---|---|---|---|---|---|---|---|
| Cement | 21.4 | 5.3 | 3.17 | 63.5 | 2.0 | 2.88 | 1.4 | 0.12 | 0.52 |
| GGBFS | 34.4 | 14.8 | 0.41 | 41.7 | 6.6 | 0.12 | −0.1 | 0.28 | 0.37 |
| SF | 90 | — | — | — | — | — | 3.0 | — | — |
| Silica sand | 99.5 | — | — | — | — | — | — | — | — |
Table 2
Physical properties of materials.
| Component | Specific gravity | Specific surface area (m2/kg) | Specific gravity and absorption of fine aggregates (%) |
|---|---|---|---|
| Cement | 3.13 | 370 | — |
| GGBFS | 2.90 | 460 | — |
| SF | 2.21 | 15,000 | — |
| Silica sand | 2.64 | — | 0.9 |
| POMF | 1.41 | — | — |
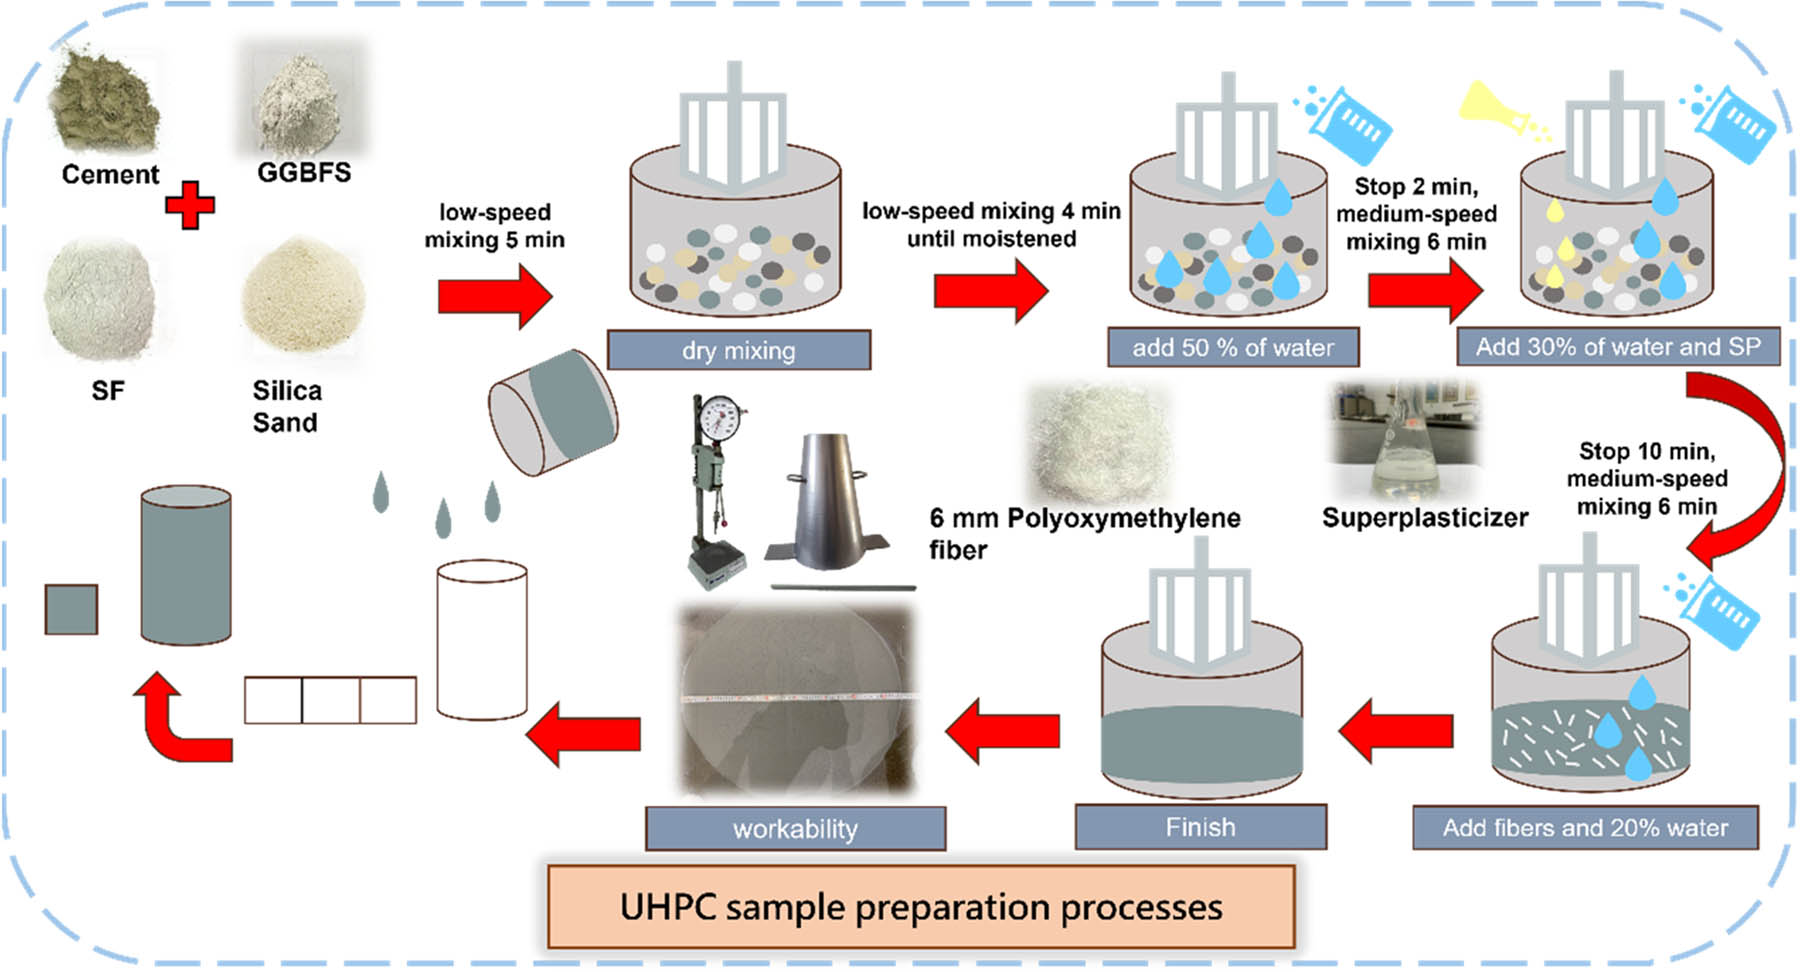
Figure 2
UHPC mixing process.
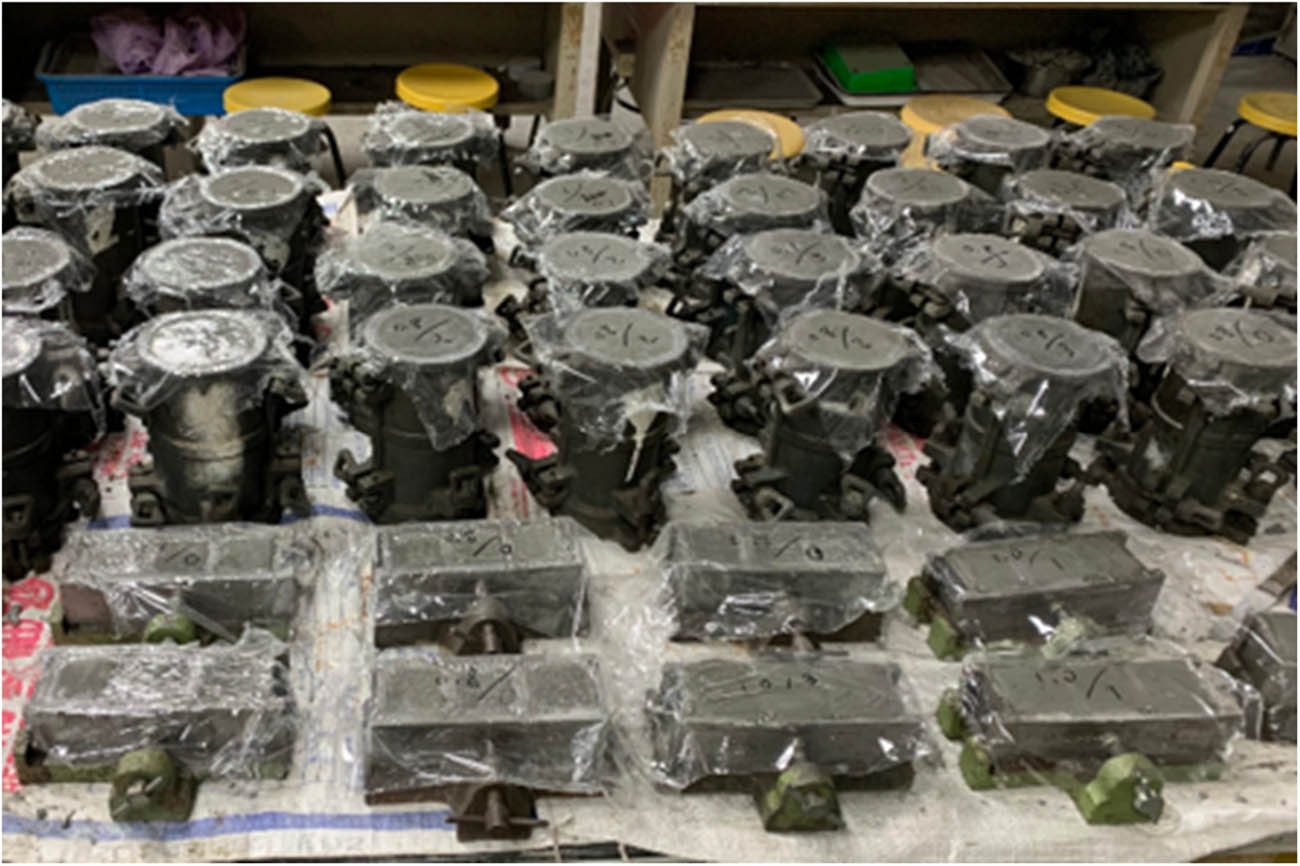
Figure 3
The test specimen was covered with cling film after filling.
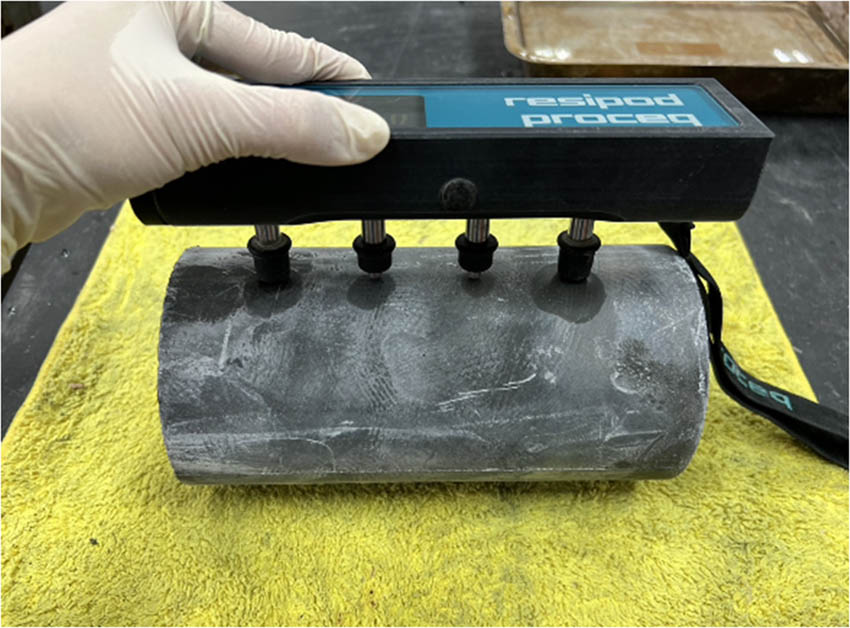
Figure 4
Surface resistivity measurement.
Table 3
AASHTO T358 surface resistivity of concrete testing.
| Chloride ion penetration | Surface resistivity (kΩ cm) |
|---|---|
| High | <12 |
| Moderate | 12–21 |
| Low | 21–37 |
| Very low | 37–254 |
| Negligible | >254 |
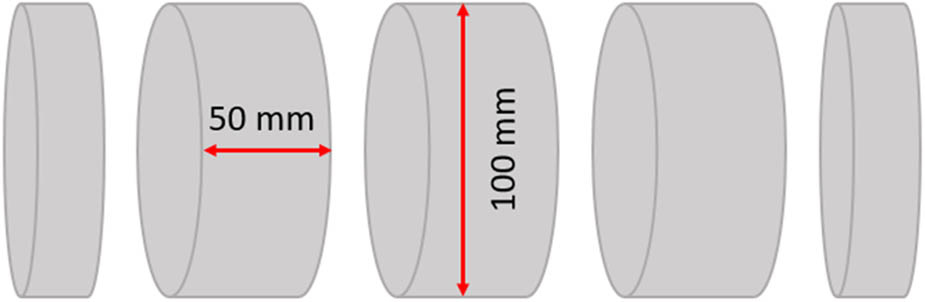
Figure 5
Schematic diagram of cutting a 100 mm × 200 mm specimen into three equal parts.
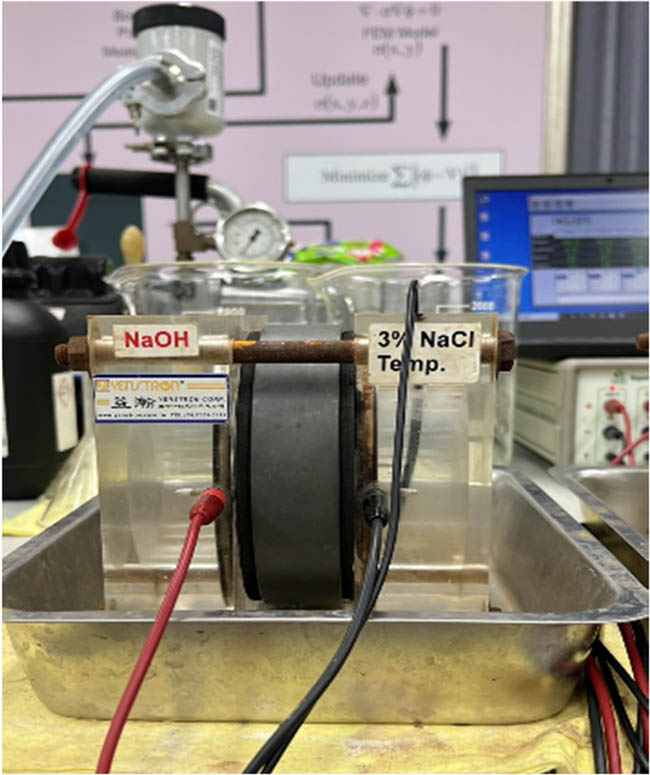
Figure 6
Rapid chloride ion penetration test.
Table 4
ASTM C1202 chloride ion penetrability based on charge passed.
| Charge passed (C) | Chloride ion penetration |
|---|---|
| >4,000 | High |
| 2,000–4,000 | Moderate |
| 1,000–2,000 | Low |
| 100–1,000 | Very low |
| <100 | Negligible |
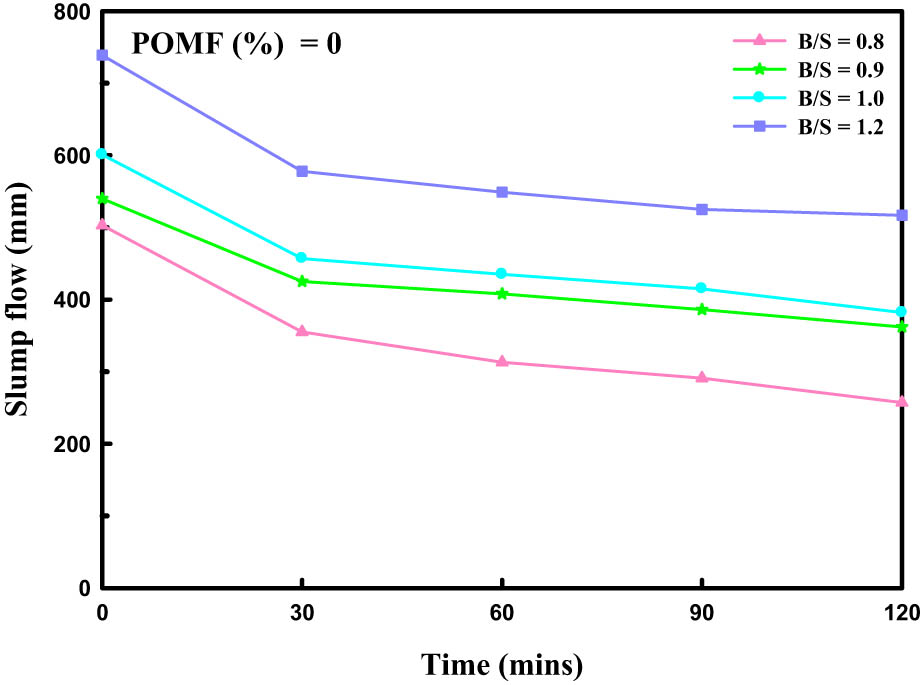
Figure 7
The relationship between slump and time of UHPC with different B/S ratios without adding POMF.
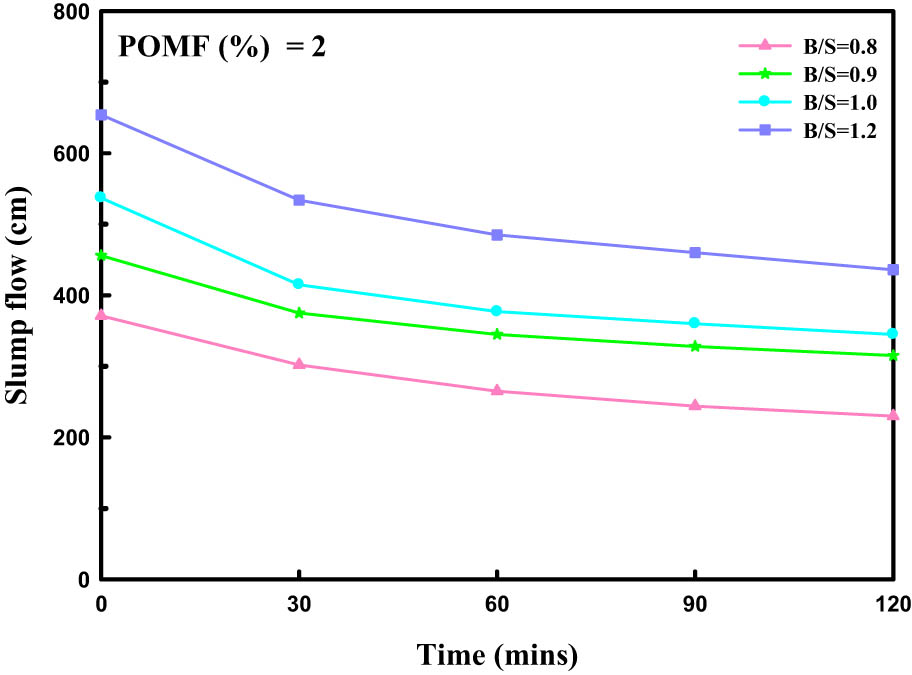
Figure 8
Relationship between slump and time of UHPC with different B/S ratios containing 2% POMF.
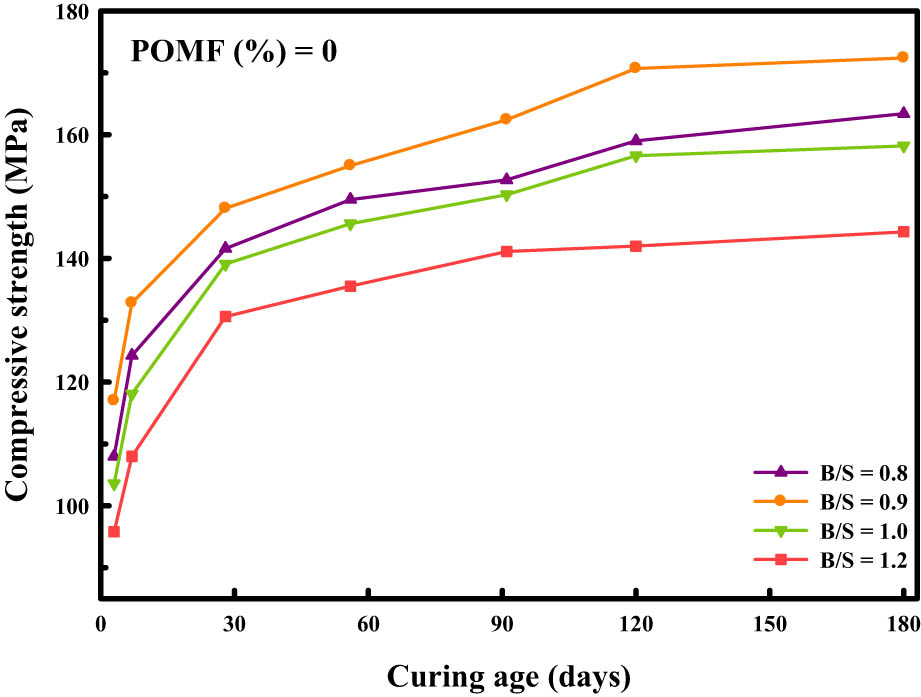
Figure 9
The relationship between compressive strength and age of UHPC with different B/S ratios without adding POMF.
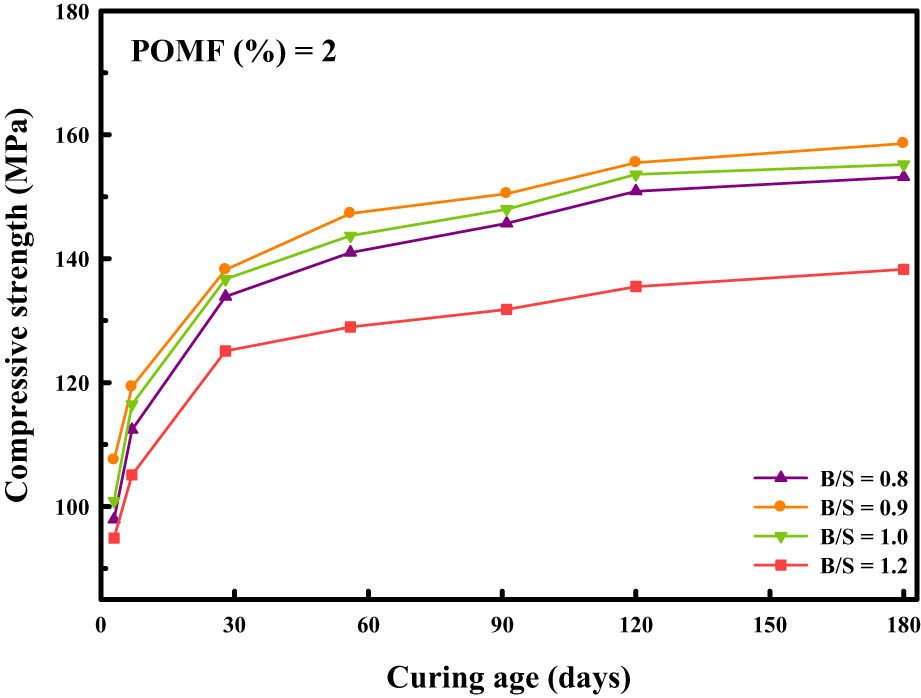
Figure 10
The relationship between compressive strength and age of UHPC with different B/S ratios containing 2% POMF.
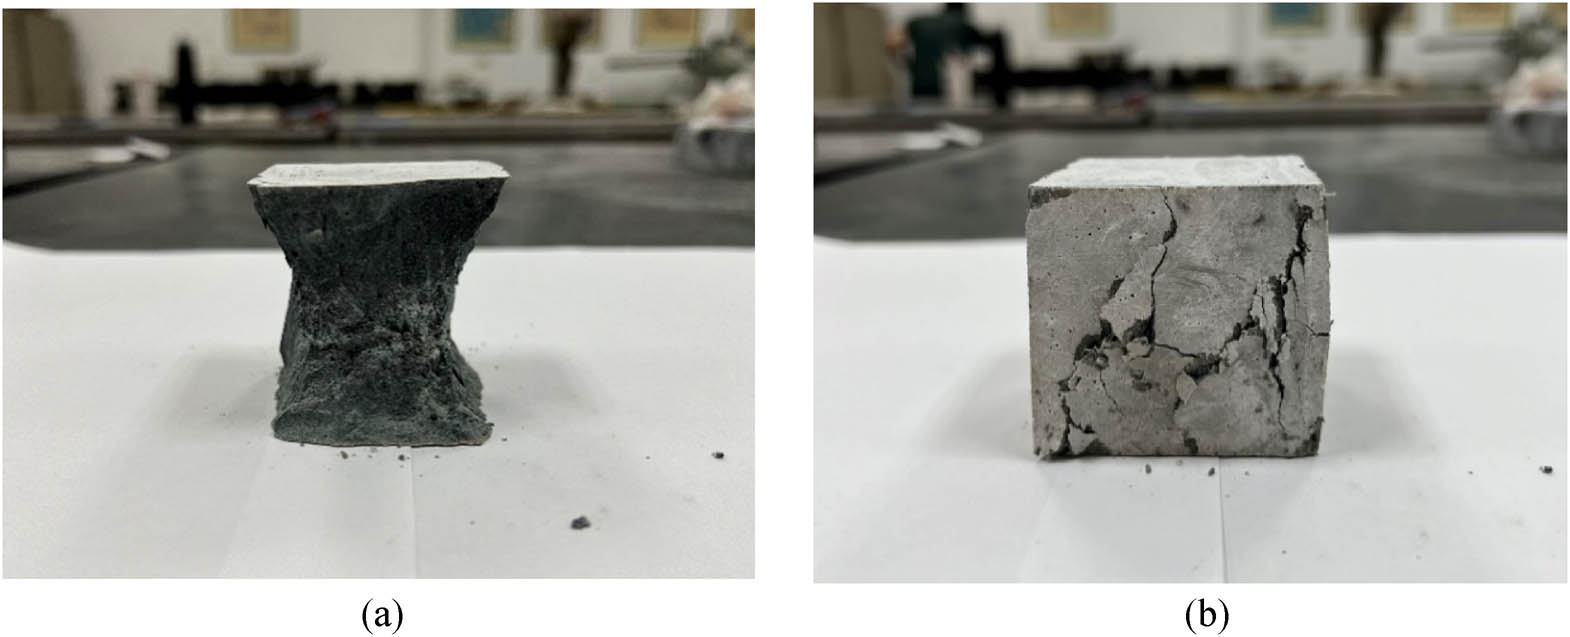
Figure 11
Failure mode of compressive test specimen. (a) No POMF added. (b) 2% POMF added.
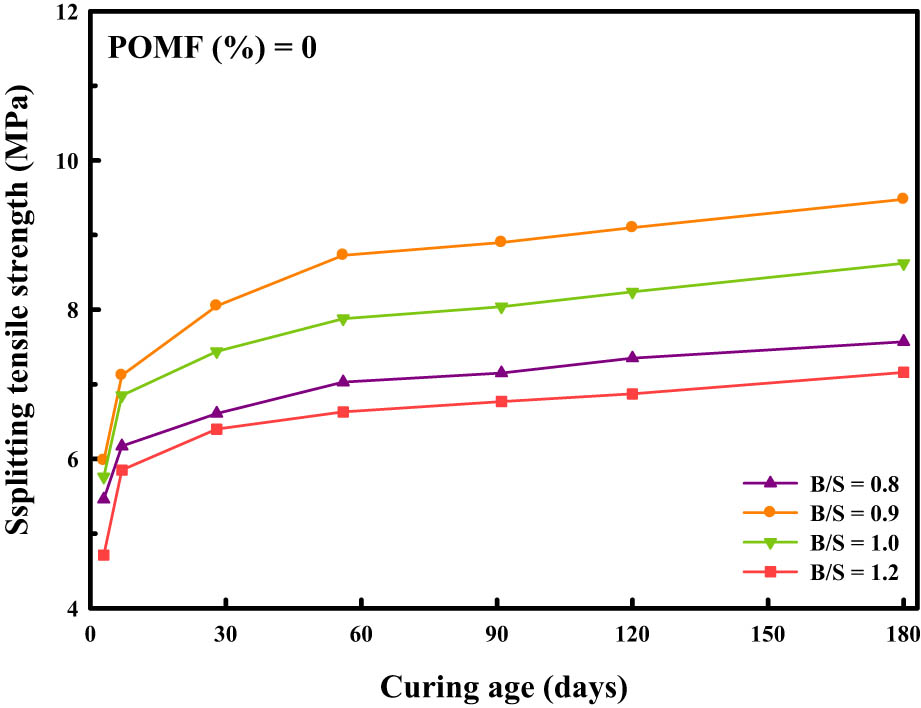
Figure 12
The relationship between splitting strength and aging of UHPC with different B/S ratios without adding POMF.
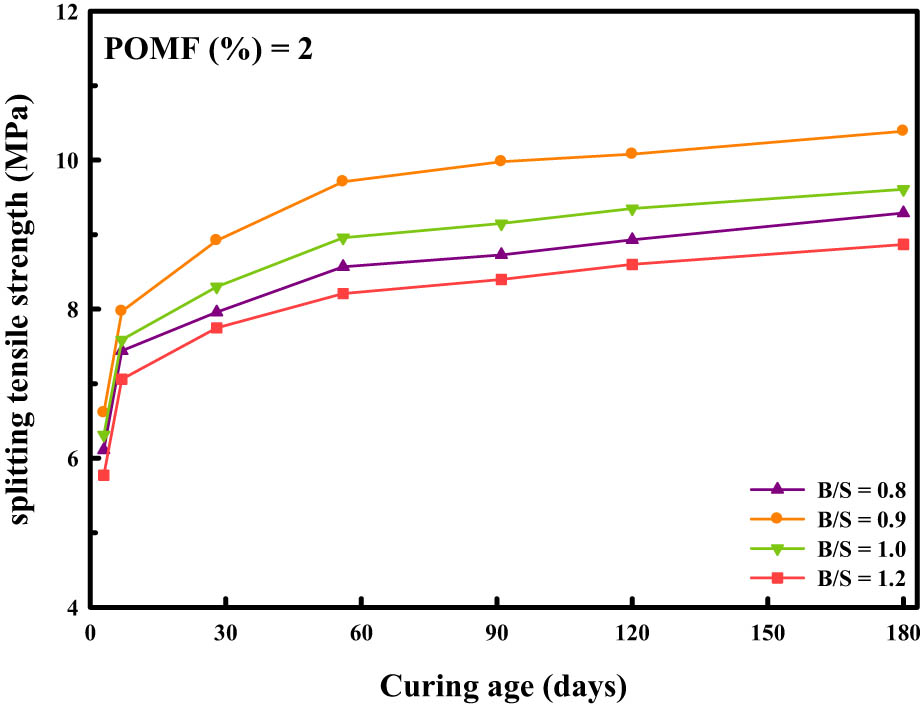
Figure 13
The relationship between splitting strength and age of UHPC with different B/S ratios containing 2% POMF.
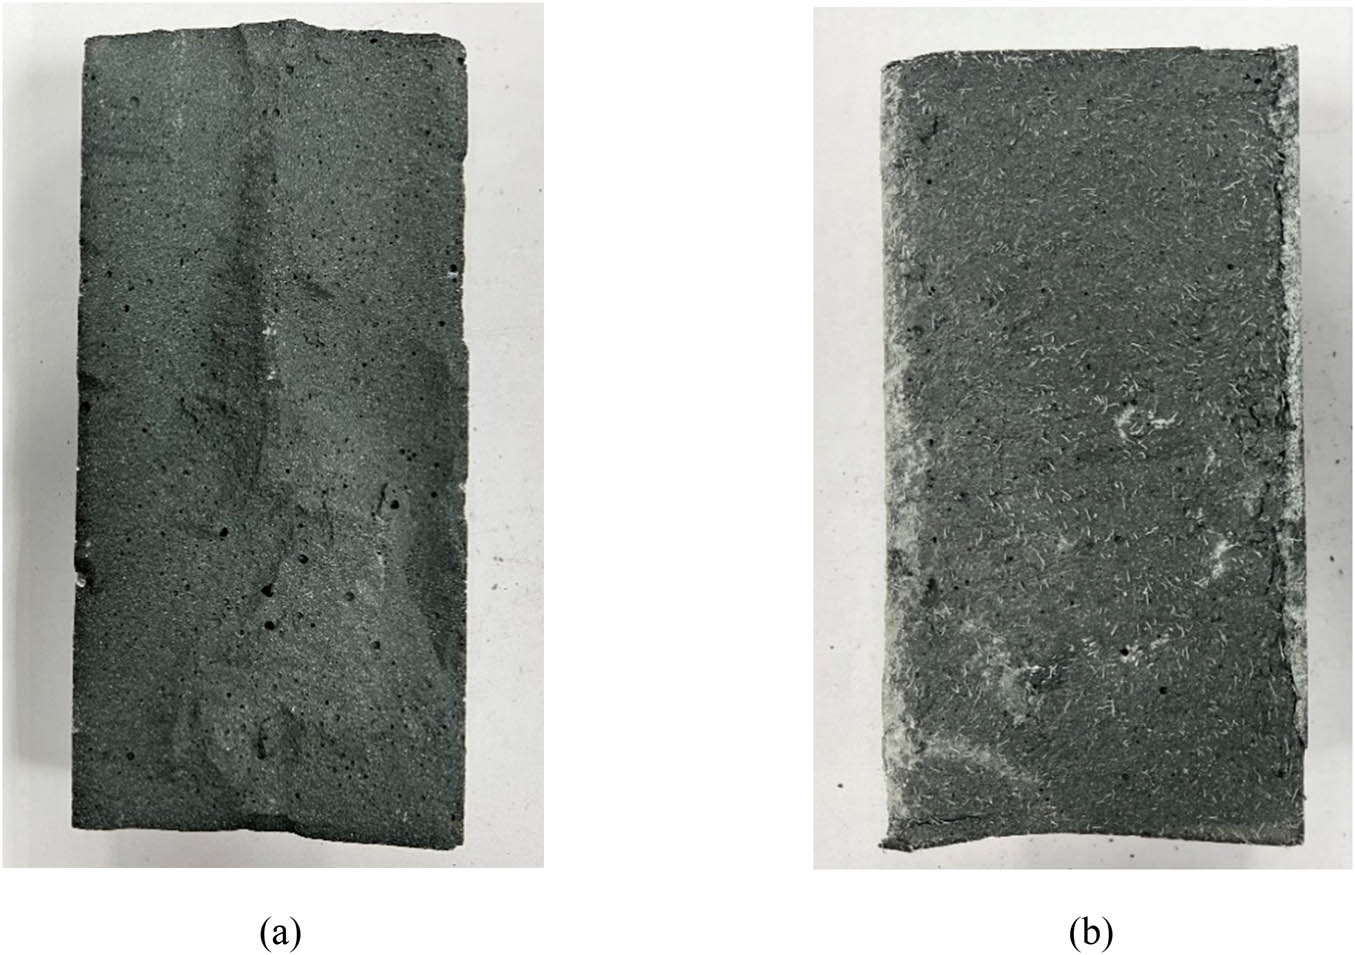
Figure 14
Splitting specimen profiles of different POMFs. (a) No POMF added. (b) 2% POMF added.
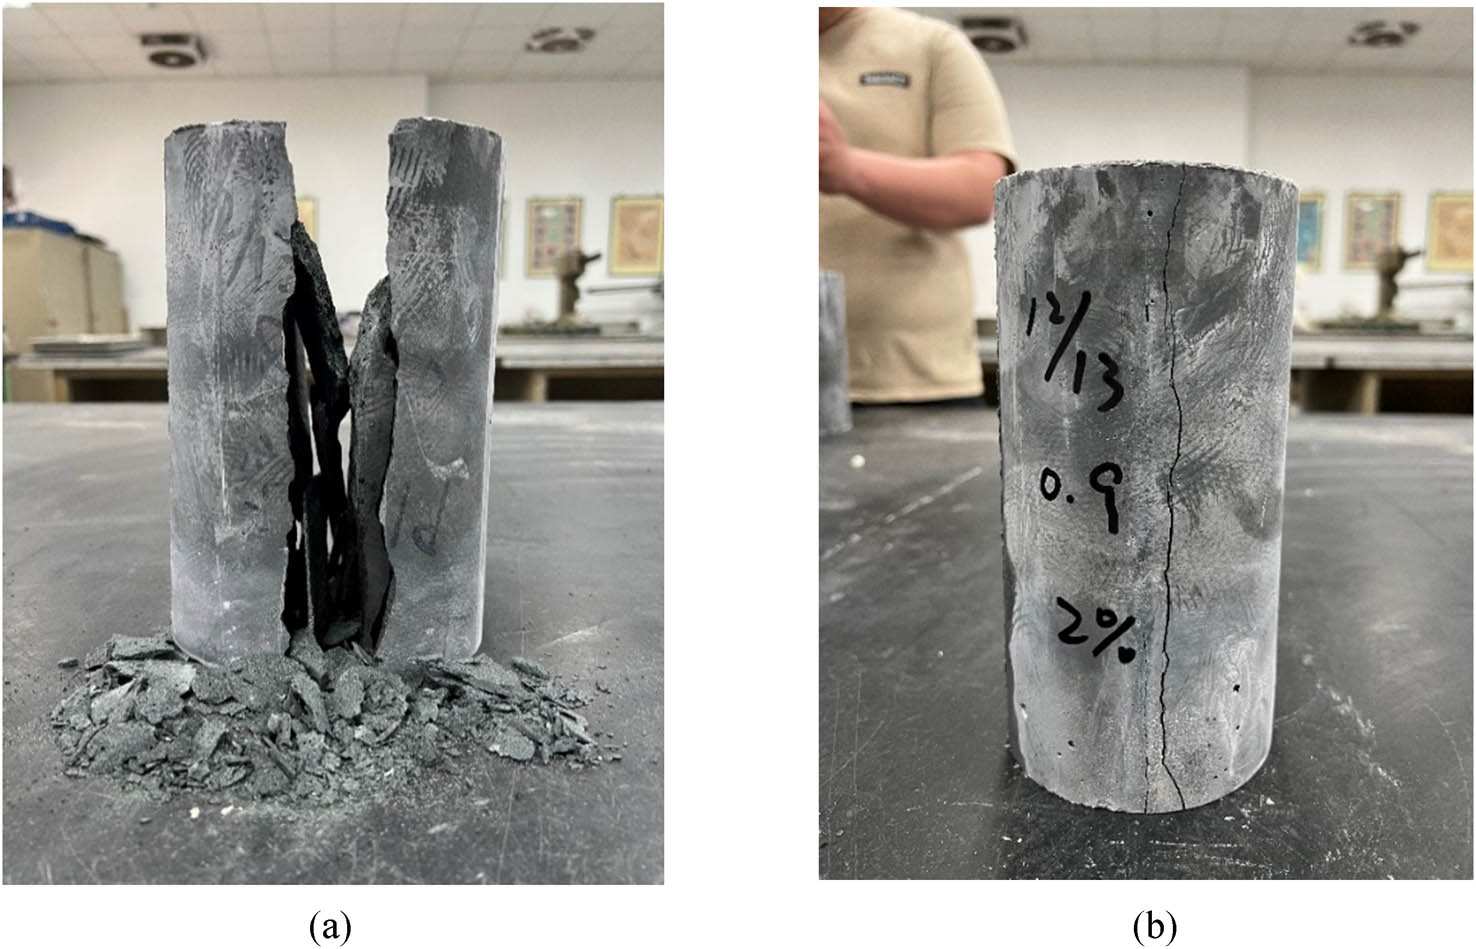
Figure 15
The failure modes of different POMF splitting specimens. (a) No POMF added. (b) 2% POMF added.
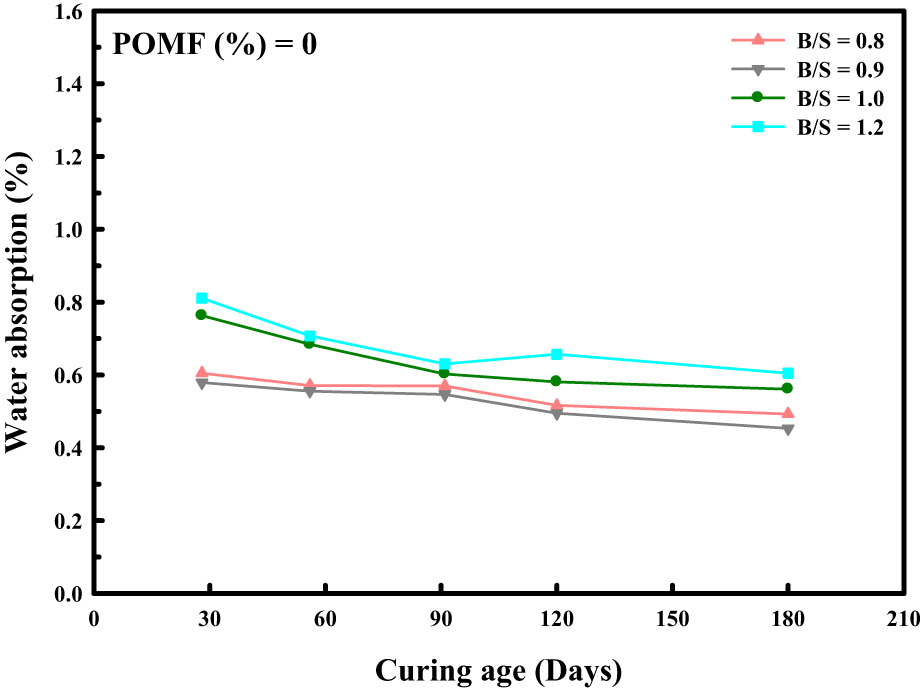
Figure 16
The relationship between water absorption and aging of UHPC with different B/S ratios without adding POMF.
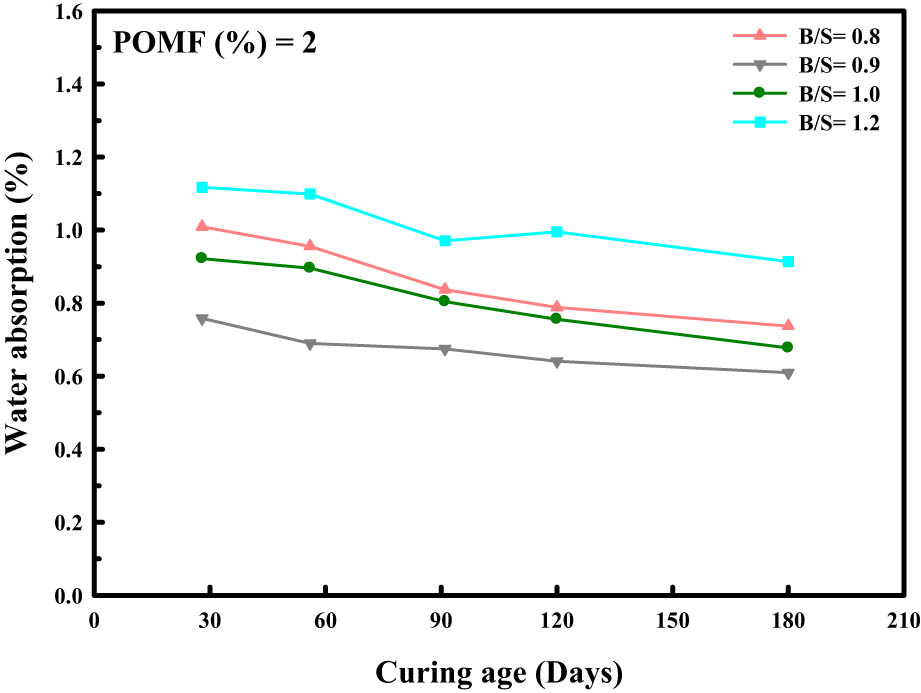
Figure 17
The relationship between water absorption and aging of UHPC with different B/S ratios containing 2% POMF.
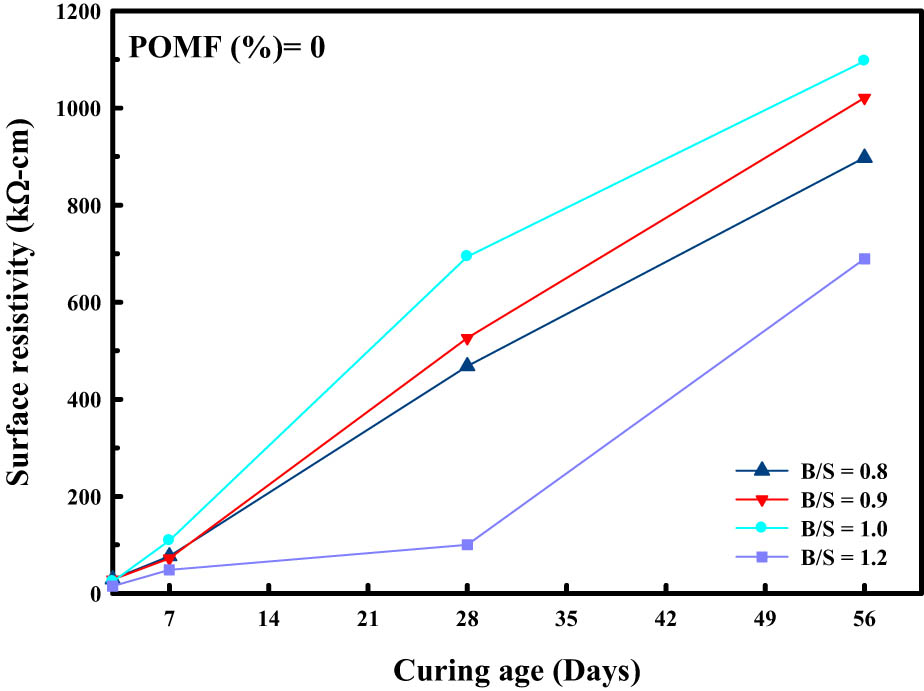
Figure 18
The relationship between surface resistivity and age of UHPC with different B/S ratios without adding POMF.
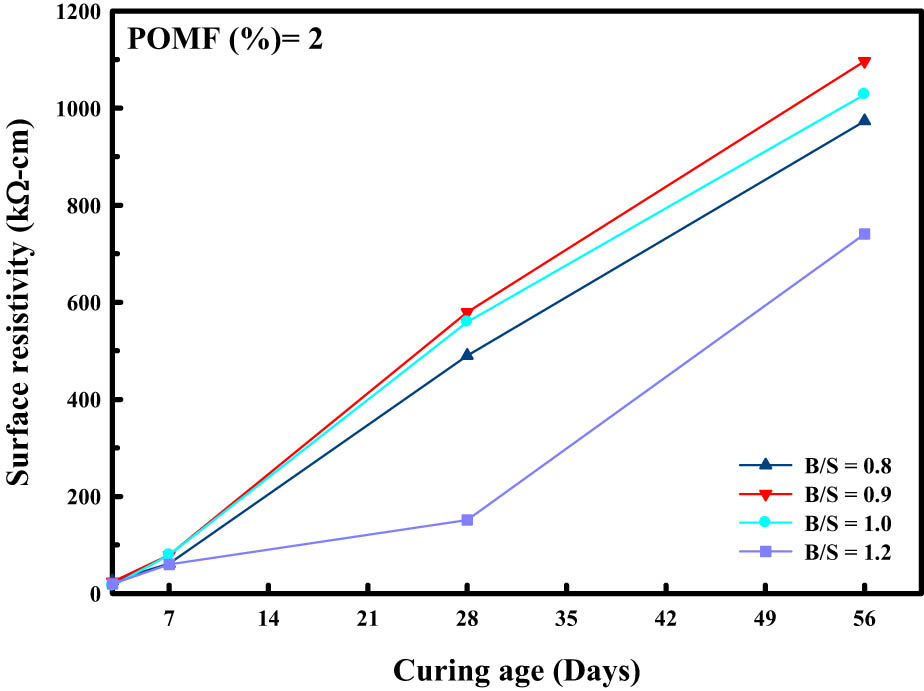
Figure 19
The relationship between surface resistivity and age of UHPC with different B/S ratios containing 2% POMF.
Table 5
Chloride ion penetrability based on charge passed test.
| Age (days) | 0.8P0 | 0.9P0 | 1.0P0 | 1.2P0 | 0.8P2 | 0.9P2 | 1.0P2 | 1.2P2 |
|---|---|---|---|---|---|---|---|---|
| 28 | 26 | 23 | 28 | 40 | 29 | 19 | 24 | 32 |
| 56 | 19 | 15 | 21 | 31 | 23 | 13 | 17 | 28 |
| 91 | 15 | 11 | 17 | 27 | 19 | 10 | 12 | 23 |
| 120 | 12 | 10 | 14 | 25 | 17 | 8 | 10 | 22 |
| 180 | 11 | 8 | 12 | 21 | 13 | 6 | 8 | 17 |
Unit: Coulomb, P: POMF.
Table 6
Sulfate weight loss rate.
| Age (days) | 0.8P0 | 0.9P0 | 1.0P0 | 1.2P0 | 0.8P2 | 0.9P2 | 1.0P2 | 1.2P2 |
|---|---|---|---|---|---|---|---|---|
| 28 | −046 | −0.21 | −0.71 | −2.63 | −0.70 | −0.31 | −0.71 | −1.12 |
| 56 | −0.66 | −0.60 | −1.20 | −0.88 | −0.90 | −0.77 | −1.20 | −0.66 |
| 91 | −0.87 | −0.51 | −0.58 | −0.96 | −0.73 | −0.65 | −0.58 | −0.69 |
| 120 | −0.75 | −0.65 | −0.61 | −0.85 | −0.53 | −0.90 | −0.61 | −0.67 |
| 180 | −0.69 | −0.86 | −0.67 | −0.81 | −0.46 | −1.07 | −0.67 | −0.58 |
Unit: %, P: POMF.
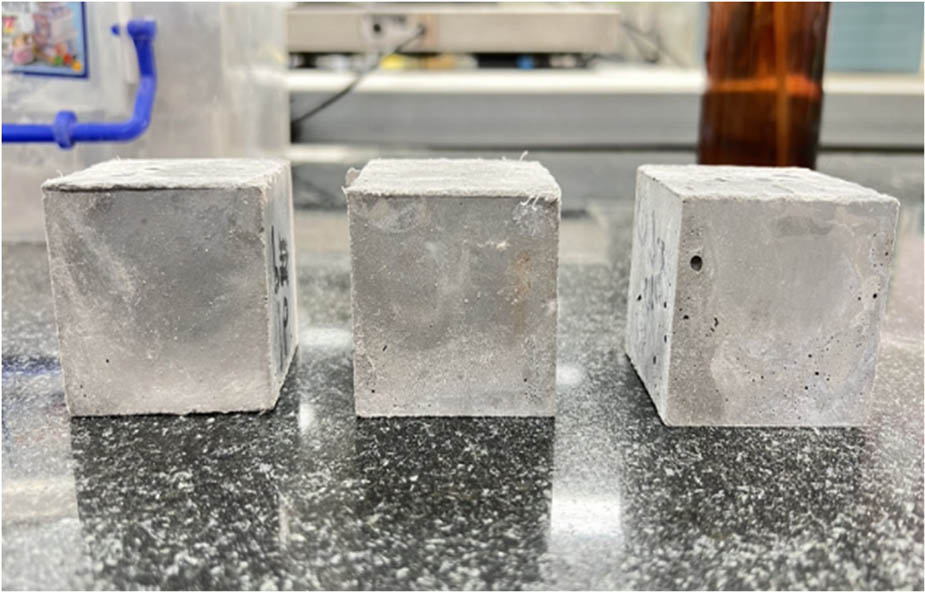
Figure 20
Sample soaked in sulfate solution (180 days).
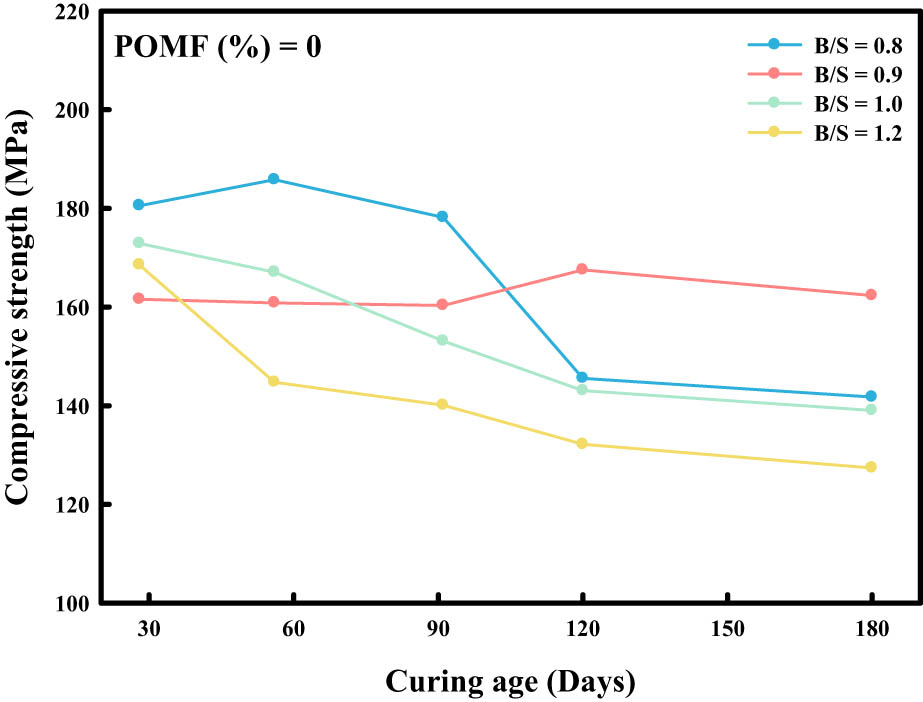
Figure 21
The relationship between the age and compressive strength of UHPC with different B/S ratios without adding POMF.
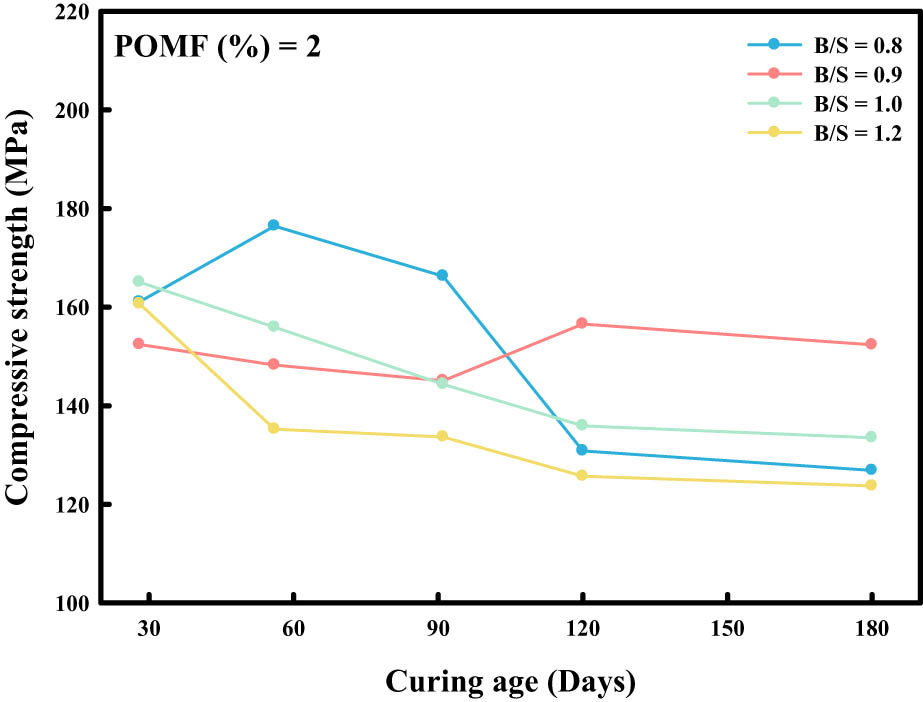
Figure 22
The relationship between UHPC aging and compressive strength with 2% POMF for different B/S ratios.
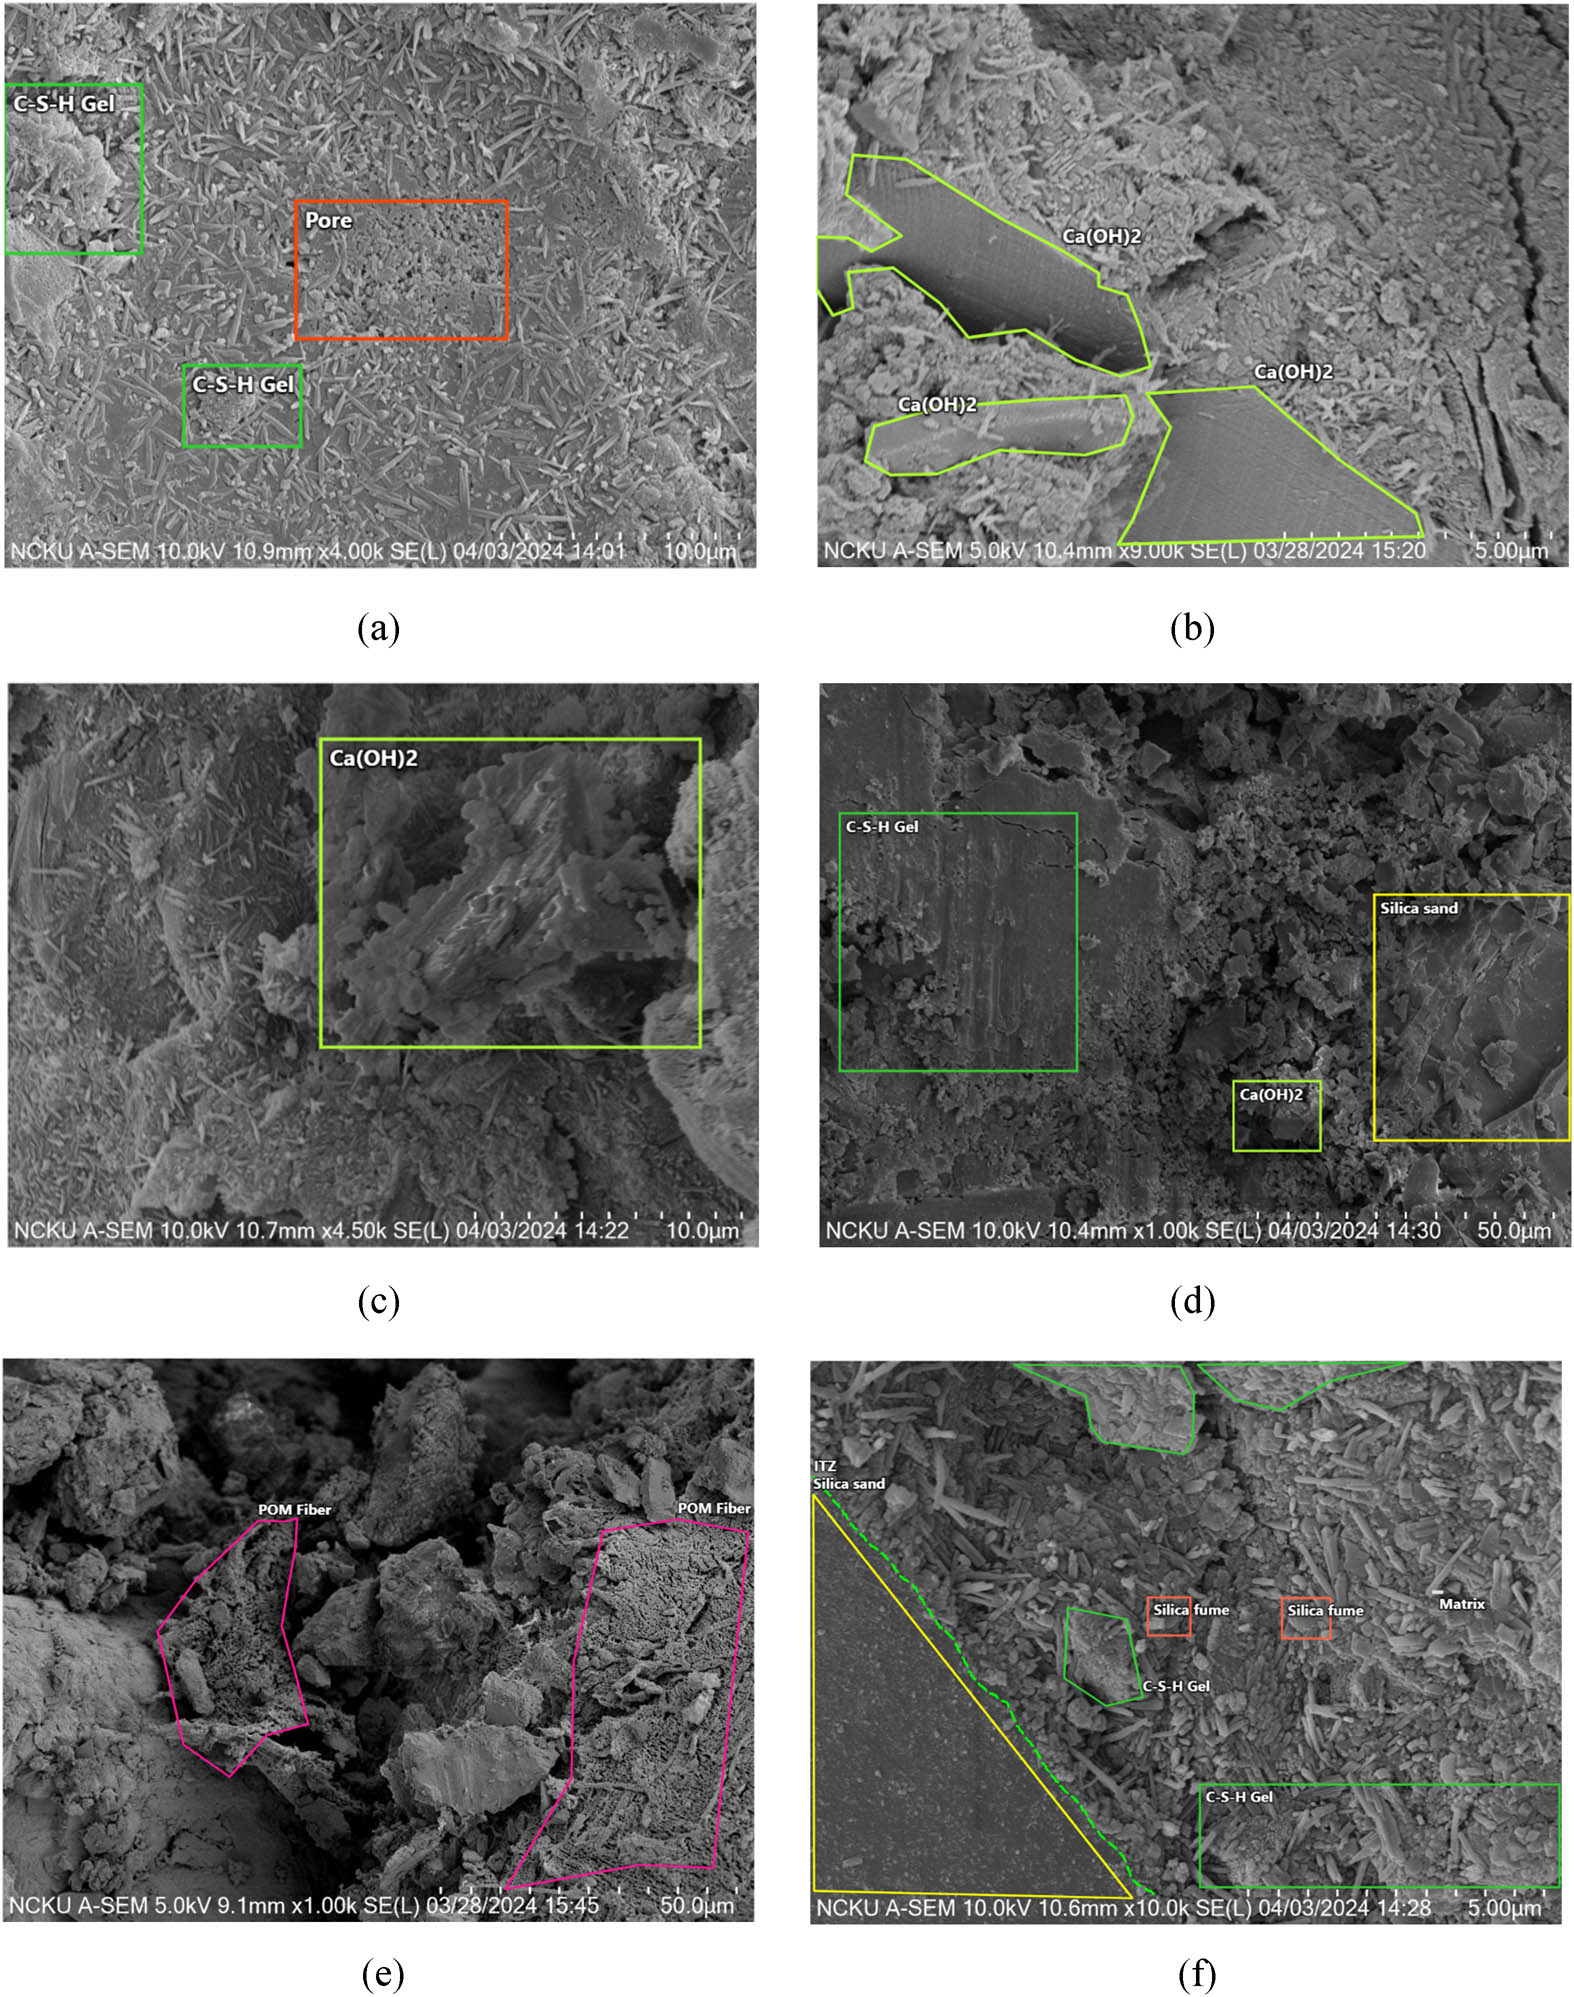
Figure 23
SEM image of UHPC. (a) SEM at 3 days of age. (b) SEM at 7 days of age. (c) SEM at 28 days of age. (d) SEM at 56 days of age. (e) Adhesive properties between POMF and substrate. (f) ITZ of silica sand and substrate.