High-temperature aircraft engine applications require alloys having low density, oxidation resistance, corrosion resistance, strength and creep resistance. Ni-based superalloys are the most common materials for jet engine parts. Main problems of the superalloys are their relatively high cost and high density. Industrial superalloys, such as Ni-based Inconel 718 and Ni-based Inconel 625, consist of face centered cubic (γ) matrix and some Ni3Ti or/and Ni3Al (γ I ) precipitates, which enhance the strength of the face centered cubic (γ) matrix [1,2,3,4,5,6,7,8,9,10,11,12,13,14,15].
High entropy alloys are novel materials and have potential for the aircraft engine applications. High entropy alloys have 5–13 principle elements in near-equal atomic contents and tend to forma a solid-solution. Mixing entropy reaches a high value when the alloying elements are in equal compositions, and this high entropy leads to solid solution formation instead of brittle intermetallic compounds. High entropy alloys main effects are sluggish-diffusion, high-entropy, cocktail effect, severe lattice distortion. In addition, entropy of mixing, valence electron concentration, atomic diameter differences, melting temperatures, and mixing enthalpy values are useful for microstructure prediction in the high entropy alloys. Chen et al. [9] were investigated the effect of valance electron concentration (VEC) on the strength and ductility of the high entropy alloys. High VEC values produced face centered cubic (fcc) lattice structure with high ductility, while low VEC values produced body centered cubic (bcc) lattice structure with low ductility and high strength. Al and Cr additions enhanced the stability of body centered cubic phase, while Ni and Co alloying enhanced the stability of face centered cubic phase. The authors found that, VEC, higher than 8.0 produced fcc structure, while VEC lower than 6.8 produced bcc structure.
High temperature mechanical properties of the high entropy alloys are not strong enough for engine applications. Alternative strengthening methods, such as aging, must be employed in order to enhance the mechanical properties. At high temperatures in jet engine working conditions, diffusion induced phase transformation and creep must be prevented. In general, face centered cubic phase with lower diffusion rate than the body centered cubic phase must used at elevated temperatures. As industrial Ni-based superalloys consist of (γ I ) precipitates in face centered cubic (γ) matrix for creep resistance, same microstructure, (γ I ) precipitates in fcc (γ) matrix should be formed in the high entropy alloys. However, amount of the γ I phase (precipitates) should be controlled by the increase in the mixing entropy. So, Ni composition of the high entropy alloy should be 35% or higher. As the Ni contents and microstructures of the Ni-reach high entropy alloy are close to industrial Ni-based superalloys, this alloys could be defined as high entropy superalloys (HESA). High-entropy superalloy joins the high entropy alloys with the superalloys in order to develops novel elevated temperature material. Yeh et al. [1] prodeced HESA for high temperature applications with higher Fe and Ti contents than superalloys. Lower price and lower density values were obtained than than industrial superalloys. The HESA specimens were produced by vacuum arc melting method. Jones et al. [2] produced and investigated refractory HESA. Microstructure of the specimens consisted of bcc matrix and B2 precipitates. AlMo0.5NbTa0.5TiZr (20Al-10Mo-20Nb-10Ta-20Ti-20Zr) refractory HESA specimens were produced bu vacuum arc melting method. Tsai et al. [3] studied the high temperature oxidation mechanism of AlCoCrFeNiTiNb based HESA produced by vacuum arc melting. Nb addition increased the oxitadion resistance. Its found that, the Nb addition encreased the oxidation resistnce. Senkov et al. [4] produced AlMo0.5NbTa0.5TiZr0.5, AlNbTa0.5TiZr0.5, Al0.5Mo0.5NbTa0.5TiZr and Al0.25NbTaTiZr refractory HESA by vacuum arc melting. Nili-Ahmadabadi et al. [5] produced precipitation hardenable HESA by double vacuum melting. Microstructure was investigated after homogenization, hor rolling, annealing and aging. Aging was studied with solutionizing and without solutionizing. Mechanical properties of the direct aged specimens were higher than solutionized-aged specimens. Yurchenko et al. [6] investigated Nb30Mo30Ti20Co20 refractory HESA specimens. The specimens were supplied as a rod, which was produced by vacuum casting method. Solutionizing heat treatment at 1,200°C temperature provided semi-coherent Co-based and Ti-based B2 precipitates, and fcc Ti-based precipitates in Nb-based and Mo-based bcc matrix.
Mechanical alloying (MA) includes material transfer (diffusion) in order to obtain a uniform alloy [16,17]. Powder injection molding is a powder metal forming technology used for production of small-medium sizes complex products. Powder injection molding overcomes the shape limitation of traditional powder metallurgy, productivity of hot isostatic pressing and cold isostatic pressing, cost of machining, and high tolerance of casting. Powder injection molding includes feedstock preparation by blending metal powder and binder, granulation, powder injection molding, debinding, sintering steps. Hong et al. [15] were produced Ni46Co22Al12Cr8Fe8Ti3Mo1 HESA by traditional powder metallurgy. Kim et al. [13] CoCrFeMnNi high entropy alloys were produced by powder injection moulding (PIM). Effect of heating rate on the mechanical properties and segregation was investigated. Gas atomised CoCrFeMnNi powders were used as a raw material. Optimum metal loading was 66%. Meza et al. [14] were produced high entropy alloys by using industrial superalloy powders (Inconel 625). Lattice structure of the high entropy alloy was face centered cubic. Polymer based binder was polyethyleneglycol-cellulose acetate butyrate.
In this study, AlCoCrFeMnNiTi based refractory-free HESA were prepared by PIM for aviation applications. Heat treatment was performed to enhance high temperature mechanical properties. Traditional Ni-based superalloys are expensive and heavy due to expensive alloying elements with high density. Elevated temperature strength, oxidation resistance and creep resistance of the high entropy alloys are low for aviation applications. HESA would be cheaper and lighter than superalloys and would have higher strength, creep resistance and oxidation resistance than high entropy alloys. HESA includes more light elements (Al and Ti), and lesser expensive elements (Co and Ni). Also, there is no heavy and expensive refractory elements (W, Nb, Mo, Ta). There is grain-coarseing, and segregation in HESA produced by vacuum arc melting. HESA with finer grain sizes and low segregation could be produced by using MA-PIM. Although there are studies on the production of HESA by vacuum arc melting or traditional powder metallurgy, there is no study on the production of HESA by PIM. There is no any study on the seven element Al-Co-Cr-Fe-Mn-Ni-Ti high entropy alloy system in the literature.
In the present study Al-Co-Cr-Fe-Mn-Ni-Ti based HESA were produced. Table 1 shows the chemical compositions of the HESA. Al, Co, Cr, Fe, Mn, Ni and Ti elements were selected due to their melting temperature, electrical conductivity, density, corrosion resistance, mechanical properties, price. Al, Co, Cr, Fe, Mn, Ni and Ti elements were used in the range of 3–38 wt%. Al, Co, Cr, Fe, Mn, Ni, Ti elements were selected in order to develop light, cheap HESAs with creep resistance and strength. HESA includes more light elements (Al and Ti), and lesser expensive elements (Co and Ni). Also, there is no heavy and expensive refractory elements (W, Nb, Mo, Ta).
Chemical compositions of the HESA.
| Alloy | Chemical Composition (wt%) | |||||||
|---|---|---|---|---|---|---|---|---|
| Al | Co | Cr | Fe | Mn | Ni | Ti | ||
| (1) | Al15Co9Cr16Fe20Mn4Ni33Ti3 | 15 | 9 | 16 | 20 | 4 | 33 | 3 |
| (2) | Al15Co4Cr16Fe20Mn4Ni38Ti3 | 15 | 4 | 16 | 20 | 4 | 38 | 3 |
| (3) | Al20Co4Cr16Fe20Mn4Ni33Ti3 | 20 | 4 | 16 | 20 | 4 | 33 | 3 |
| (4) | Al20Co9Cr16Fe15Mn4Ni33Ti3 | 20 | 9 | 16 | 15 | 4 | 33 | 3 |
| (5) | Al20Co9Cr11Fe20Mn4Ni33Ti3 | 20 | 9 | 11 | 20 | 4 | 33 | 3 |
| (6) | Al24Co6Cr11Fe23Mn3Ni30Ti3 | 24 | 6 | 11 | 23 | 3 | 30 | 3 |
| (7) | Al25Co5Cr10Fe25Mn3Ni27Ti5 | 25 | 5 | 10 | 25 | 3 | 27 | 5 |
Entropy of mixing (ΔS
mix), enthalpy of mixing (ΔH
mix), atomic size misfit (δ), parameter Ω, VEC parameters could be used in order to evaluate high entropy alloy formation. Entropy of mixing (ΔS
mix) of the proposed HESAs is calculated by equation (1), where R is the gas constant and C
i
is the atomic ratio (molar fraction). There is no any interaction forcess between alloy atoms in the ideal solid solutions. The mixing enhalpy is zero, and the mixing entropy is given by the configurational entropy of the alloying atoms. In addition, interaction forces are insufficient to affect the mixing entropy in the regular solid solution. In the HESAs mixing entropy (ΔS
mix) must be in the range of 11 ≤ ΔS
mix ≤ 19 (J/K mol) for solid solution formation rather than intermetallic formation. ΔS
mix is the highest for alloys with nearly equal atomic ratios. ΔS
mix has vibrational, electronic, configurational, and magnetic components. In the present study, only configurational entropy is considered [18,19].
The atomic size misfit parameter (δ), which estimates the amount of lattice strain in the alloy, is calculated by equation (2), where r
i
is the atomic radius. Atomic size misfit (δ) parameter must be in the range of 0 ≤ δ ≤ 8.5 for solid solution formation. High δ parameter leads distortion in the lattice, by increasing the free energy, which decrease the stability of solid solution [18,19].
VEC parameter of the HESAs is calculated by equation (3) by using VEC values of atoms. Crystal structure of the alloys can be predicted by VEC value. Crystal structure types are as follows: VEC > 8.00 fcc (face centered cubic), VEC < 6.87 bcc (body centered cubic), 6.87 < VEC < 8.00 fcc-bcc dual phase [8,9,18,19].
The enthalpy of mixing (ΔH
mix) is calculated by equation (4), where ΔH
mix is mixing; and C
i
and C
j
are the atomic ratios of the ith and jth components. For a binary mixture, ΔH
mix is negative if the A and B atoms are attractive to each one. ΔH
mix is positive if the atoms are repulsive. Criteria for solid solution is −10 < ΔH
mix <5 (kJ/mol). A high negative ΔH
mix increases the likelihood of formation of intermetallics. Positive ΔH
mix indicates lower mixing of different atoms in the liquid state, which leads to separation of alloying elements in the solid state. Only if enthalpy of mixing is close to zero alloying elements could be distributed and could form solid solution [18,19].
Dimensionless stability parameter (Ω) is calculated by using equation (5), where T
m is the melting temperature. Ω > 1 means that the effect of the ΔS
mix is greater than ΔH
mix, and the high-entropy phase tends to form. Solid solution formation is possible only if Ω > 1 is satisfied [18,19].
Table 2 shows the parameters of the atoms used in the production of HESA, while Table 3 shows the mixing enthalpy values (kJ/mol) of the binary alloys. In the present study seven HESA were produced. HESA with high VEC value (maximum fcc content) and simultaneously high ΔS mix was preferred. In general, fcc structure is necessary for creep resistance. ΔS mix and δ values of the HESA were similar.
Parameters of the atoms.
| Al | Co | Cr | Fe | Mn | Ni | Ti | [Refs.] | |
|---|---|---|---|---|---|---|---|---|
| Mass Number | 26.982 | 58.933 | 51.996 | 55.845 | 54.938 | 58.693 | 47.867 | [18,19] |
| r (nm) | 0.1431 | 0.1251 | 0.1249 | 0.1241 | 0.1350 | 0.1245 | 0.1461 | [18,19] |
| T m (K) | 933 | 1,768 | 2,180 | 1,811 | 1,519 | 1,728 | 1,941 | [18,19] |
| VEC | 3 | 9 | 6 | 8 | 7 | 10 | 4 | [18,19] |
Mixing enthalpy values (kJ/mol) of the binary alloys [18,19].
| Al | Co | Cr | Fe | Mn | Ni | Ti | |
|---|---|---|---|---|---|---|---|
| Al | — | −19 | −10 | −11 | −20 | −22 | −60 |
| Co | −19 | — | −4 | −1 | −5 | 0 | −28 |
| Cr | −10 | −4 | — | −1 | 2 | −7 | −7 |
| Fe | −10 | −1 | −1 | — | 0 | −2 | −17 |
| Mn | −20 | −5 | 2 | 0 | — | −8 | −11 |
| Ni | −22 | 0 | −7 | 2 | −8 | — | −35 |
| Ti | −60 | −28 | −7 | −17 | −11 | −35 | — |
Table 4 shows the thermodynamic parameters calculated by equations (1)–(5). As the VEC value is slightly lower than 8.0 and higher than 6.87 for all alloys, bcc and fcc mixed microstructure is supposed to form. As the VEC values of the the alloys are close to fcc microstructure area mainly fcc phase could be formed in the microstructure. The values of atomic size misfit parameters (δ) are within the range of solid solution formation. The values of enthalpy of mixing (ΔH mix) are within the range of solid solution formation for alloy 1 and alloy 2. Since the system contains seven elements, entropy of mixing (ΔS mix) is higher than threshold. ΔS mix values of alloys 1, 2, 3, 4, 5, 6, and 7 are suitable. The values of stability parameter Ω of alloys are within the range of solid solution formation. As a result, the Al15Co9Cr16Fe20Mn4Ni33Ti3 (alloy 1) and Al15Co4Cr16Fe20Mn4Ni38Ti3 (alloy 2) were most suitable for their high VEC value (maximum fcc content), high δ, high Ω, suitable ΔH mix, high ΔS mix.
Calculated parameters of the AlCoCrFeMnNiTi based HESAs.
| HESA | VEC (e/a) | δ (%) | ΔS mix (J/K mol) | ΔH mix (kJ/mol) | Ω |
|---|---|---|---|---|---|
| Al15Co9Cr16Fe20Mn4Ni33Ti3 | 7.985 | 6.79 | 13.78394 | −10.898 | 2.222 |
| Al15Co4Cr16Fe20Mn4Ni38Ti3 | 8.041 | 6.79 | 12.97311 | −11.183 | 2.035 |
| Al20Co4Cr16Fe20Mn4Ni33Ti3 | 7.791 | 6.77 | 13.47905 | −12.521 | 1.866 |
| Al20Co9Cr16Fe15Mn4Ni33Ti3 | 7.850 | 6.74 | 13.94583 | −12.765 | 1.892 |
| Al20Co9Cr11Fe20Mn4Ni33Ti3 | 7.954 | 6.74 | 13.80207 | −12.338 | 1.917 |
| Al24Co6Cr11Fe23Mn3Ni30Ti3 | 7.747 | 6.70 | 13.64152 | −13.223 | 1.753 |
| Al25Co5Cr10Fe25Mn3Ni27Ti5 | 7.575 | 6.67 | 13.86842 | −15.053 | 1.561 |
First-principles calculation was used to study the mechanical properties. Cambridge sequential total energy package (CASTEP) code, which is a first-principles quantum mechanical based code, was used for the calculations [20,21,22,23,24,25,26,27,28,29]. CASTEP is a first-principles plane wave pseudo-potentials method based on DFT. Generalized gradient approximation of Perdew-Burke-Ernzerhof was employed in order to describe the exchange correlation energy. Vanderbilt type ultrasoft pseudopotential was used. Cut-off energy is set to 500 eV and 8 × 8 × 8 k-points were used for structure optimization. Face centered cubic structure was used for alloys.
In the present study, seven Al-Co-Cr-Fe-Mn-Ni-Ti based refractory element-free HESA were prepared by MA-PIM. Average particle sizes metal powders were 34 μm. Elemental metal powder mixture was ball-milled (mechanical alloying) with ZrO2 grinding 6 mmvballs for 35 h at 400 rpm. ZrO2 to metal ratio was 10/1.
Polymer system contained 70% polyethylene, 28% paraffin, 2% stearic acid. Feedstock consisted of 45% of binder and 55% of metal. PIM was carried out at 185°C. After the PIM step, binder from green specimens was removed in hot hexane (chemical debinding). Thermal removal of the binder from the green specimens was carried out in a furnace at 400°C for 60 min (thermal debinding). Sintering process of the brown specimens was carried out at 1,250°C for 60 min in vacuum (MTI, USA). Figure 1 illustrates the HESA production steps by MA-PIM method.

HESA production by PIM method.
In the present study, heat treatment for production of precipitates consisted of a solution treatment and aging. Solution treatment was carreid out above the solvus temperature at 1,150°C for 8 h for dissolution of alloying elements. Precipitation hardening (aging) was carried out at temperatures between 700 and 1,000°C for 5 h for production of precipitates. Titanum was added to the HESA for the formation of coherent fine intermetallic precipitates. After the solution treatment in the vacuum, alumina tube was removed out from the heating zone and the specimens were quenched. Figure 2 shows the aging heat treatment by using sliding-flange tube furnace.

Aging heat treatment by using sliding-flange tube furnace.
Microstructural characterization of the HESA was performed by scanning electron microscope (SEM). Hardness of the specimens was determined by using a micro-vickers hardness test (Zwick Roell). Wear resistance of the specimens was measured by pin-on-disc method (Devotrans, Turkey). Electrical conductivity was investigated by using eddy current device (WeldCheck). Young’s modulus values of the specimens were determined by using ultrasonic device (General Electric, USA), by using following equation (6). V
T and V
L are transverse and longitudinal velocity, and ρ is density [30].
Electrochemical corrosion tests were carred out using a potentiostat (Interface 1000, Gamry) in 5% NaCl solution. Tafel and linear polarization resistance tests were employed for corrosion rate. Electrochemical impedance spectroscopy (EIS) tests were carried out in order to investigate the electrochemical corrosion properties of the HESA specimen and to investigate behaviour of surface. EIS result was fitted by an electrical equivalent circuit model.
Elevated temperature oxidation behaviour of the specimens was studied at 900°C temperature for different durations between 1 and 4 h in air atmosphere. Weight gain values of the specimens were determined by measuring the weight of the specimens before and after the oxidation tests at 900°C in air.
Figure 3 shows the photographs of (a) power injected specimens with varied metal power contents (0, 25, 35, 45, 55%), and (b) sintered specimen. For proper reology, the PIM feedstocks must be produced at 50–60 vol% metal powder and 40–50 vol% polymer binder contents. Lower polymer binder contents lead to micro-cracks, and low fluidity, while higher polymer binder contents lead to shrinkage defects. Injection temperature must be also carefully adjusted. Low injection temperatures lead to high viscosity, which prevents filling of the mould. On the other hand, homoheneous distribution of metal powders can not be obtained at high injection temperatures. Amount of the surface active materials are also important. Zn-stearate or stearic acid based surface active additives decreases the wettbility and the viscosity [31].

Photograph of injected specimens with varied metal contents (left), photograph of sintered specimen (right).
Characterization of the structure of the HESA was carried out by using x-ray diffraction (XRD) analysis. Figure 4 shows the XRD patterns of the powders and sintered Al15Co4Cr16Fe20Mn4Ni38Ti3 specimen. Peaks in the XRD spectra of the Al15Co4Cr16Fe20Mn4Ni38Ti3 HESA is different from the peaks of elemental powders and correspond to a phase face centered cubic structure, which confirms the formation of a solid solution different from the alloying elements. XRD results showed formation of a matrix phases having face centered cubic structure. Diffraction peaks of body centered cubic phase was also observed, which was arrtibuted to the formation of some body centered cubic phase structure.

XRD patterns of the elemental powders and sintered HESA.
Figure 5 shows the XRD patterns of the as-sintered, solution-treated, and aged Al15Co4Cr16Fe20Mn4Ni38Ti3 specimen. Diffraction peaks of the body centered cubic (bcc) phase was higher in the solution-treated specimen than the as-sintered specimen. Diffraction peak of the precipitates (γ′) was observed in the aged specimen, while diffraction peak of the γ′ not observed in the as-sintered and solution treated specimens, which confirms the formation of precipitates after aging (precipitation hardening) heat treatment.

XRD patterns of the elemental powders and sintered HESA.
Figure 6 shows the SEM pictures and EDS spectra of the as-sintered, solution treated, and aged (precipitation hardened) Al15Co4Cr16Fe20Mn4Ni38Ti3 HESA specimen. As seen from the SEM pictures, microstructure of the solution treated specimen is more homogeneous than as-sintered specimen and aged specimen. As seen from SEM pictures, there is a suitable sintering between the metal particles. Moreover, there is no any microcracks or pores in the microstructure of the aged HESA specimen. EDS spectra of the Al15Co4Cr16Fe20Mn4Ni38Ti3 HESA specimen confirms the chemical composition without oxidation.

(a) SEM of as-sintered specimen, (b) SEM of solution treated specimen, (c) SEM of aged specimen, (d) EDS of aged specimen.
Figure 7 shows the optic microscope picture of the aged Al15Co4Cr16Fe20Mn4Ni38Ti3 HESA specimen. Microstructure of the HESA specimens consist of gamma (γ) phase matrix and some γ′ phase intermetallic precipitates. In addition, some body centered cubic phase was also observed. There is no grain-coarseing, and segregation in the microstructure.

Optic microscope picture of the aged specimen.
Figure 8 shows the effect of (a) heat treatment on the Al15Co4Cr16Fe20Mn4Ni38Ti3 alloy and composition (alloy type) on the Tafel curves. Solution treatment increased the corrosion rate of the as-sintered specimen. Precipitation hardening (aging) at 700 and 1,000°C temperatures was slightly increased the corrosion rate (current density) of the specimens. Maximum corrosion rate was obtained at 1,000°C aging, which was attributed to the formation of large precipitates lead to micro galvanic cells. Corrosion rate value of the specimens aged at 800 and 900°C was close to corrosion rate value of the solution treated specimen.

Effect of heat treatment (left), and composition on the Tafel curves (right).
Equivalent electric circuit model was employed in order to analyse the EIS results. The equivalent electric circuit model includes a barrier-like surface oxide film and metal/oxide film interface. R sol represents resistance of environment (NaCl solution). R 1 and R 2 are polarization resistances (charge transfer resistance) of the oxide and interface. C 1 and C 2 are capacitances (double layer formation) of oxide and interface. Figure 9 shows the EIS results (Nyquist plots). Corrosion resistance (surface oxide film resistance) of alloy 1 and alloy 2 were higher. Highest surface oxide film corrosion resistance was in alloy 1, while lowest was in alloy 7.
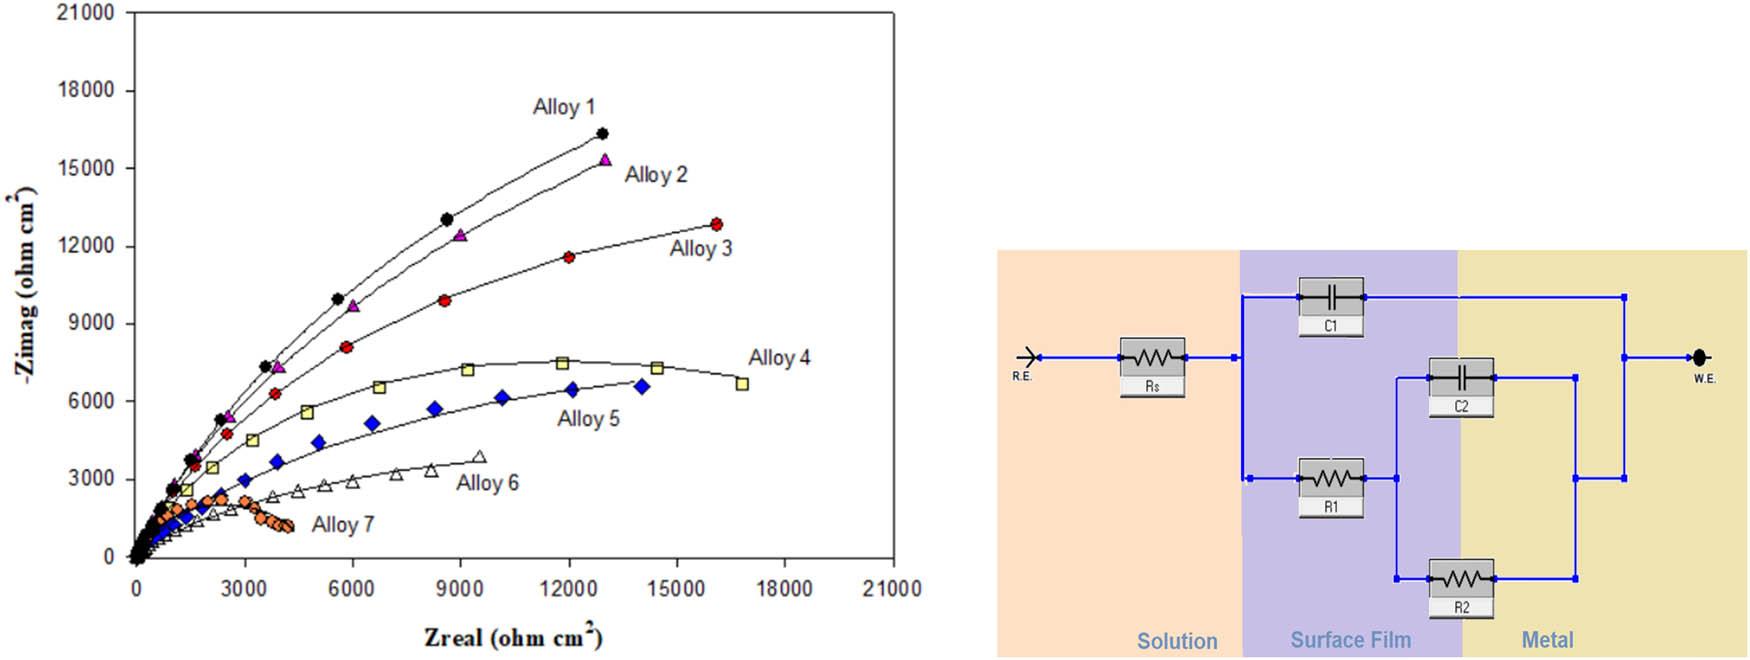
EIS test results of the HESA (left), electrical circuit model (right).
Figure 10 shows the (a) effect of heat treatment on the Young’s modulus of the Al15Co4Cr16Fe20Mn4Ni38Ti3 alloy specimens and (b) effect of composition on the Young’s modulus. In general, Young’s modulus values of the as-sintered, solution treated and precipitation hardened specimens were close to each other. Young’s modulus of the specimen aget at 900°C was slightly higher. Young’s modulus values of alloy 1 and alloy 2 were higher. Highest Young’s modulus was in alloy 1, while lowest Young’s modulus value was in alloy 3.

Effect of heat treatment (left), and composition on the Young’s modulus of the specimen (right).
Figure 11 shows the (a) effect of heat treatment on the wear and (b) effect of composition on the wear. Solution treatment was slighly increased the wear resistance of the as-sintered psecimen. Aging at 700 and 1,000°C temperatures was slightly increased the wear resistance of the solution hardened specimens. Minimum wear was obtained at 900°C aging, which was attributed to the maximum hardness and formation of precipitates having optimum size. Wear value of the specimens aged at 800 and 900°C was close to wear value of the solution treated specimen. Wear values of alloy 1 and alloy 2 were lower. Highest wear value was in alloy 3, while lowest wear (highest wear resistance) was in alloy 1.

Effect of heat treatment (left), and composition on the wear of the specimens (right).
Figure 12 shows (a) the effect of heat treatment on the electrical conductivity and (b) effect of composition on the electrical conductivity. Precipitation hardening was decreased the electrical conductivity of the solution hardened specimens. Minimum electrical conductivity was obtained at 1,000°C aging, which was attributed to the maximum hardness and formation of large precipitates. Electrical conductivity values of alloy 6 and alloy 7 were higher. Highest electrical conductivity value was in te alloy 7, while lowest electrical conductivity value was in alloy 2.
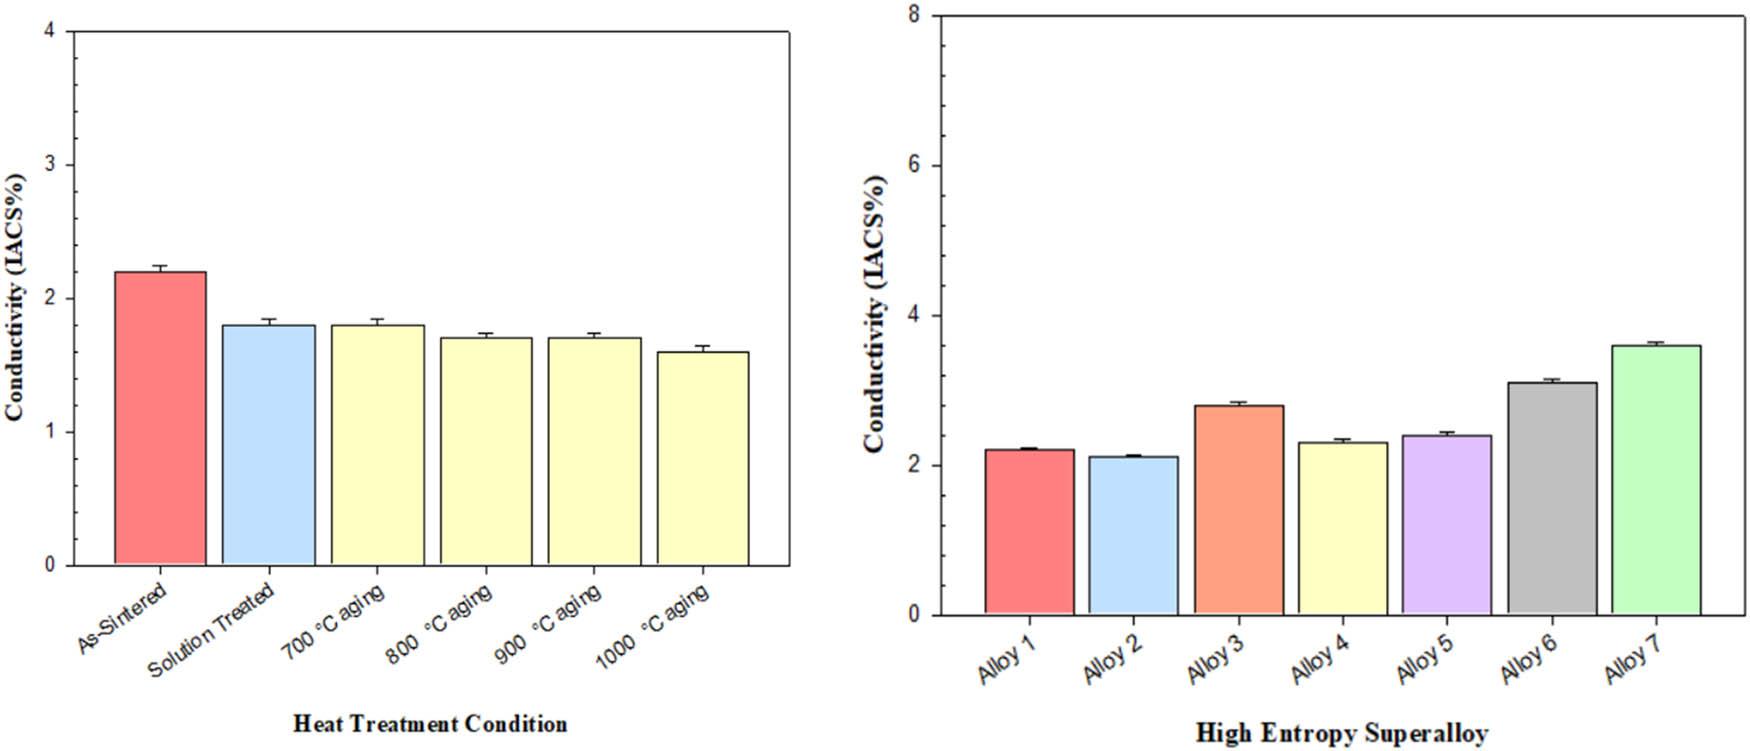
Effect of heat treatment (left), and composition on the conductivity of the specimens (right).
Table 5 shows the tensile strength values of the HESA. Table 5 also shows the tensile strength value of the traditional Ni-based superalloy (Inconel 718). The results of the HESA have been compared with traditional Ni-Based superalloys. As seen from the Table 5, tensile strength values of the HESA were 27–35% lower than traditional Ni-based superalloy (Inconel 718).
Strength values of the HESA.
| Alloy | Tensile strength (MPa) | |
|---|---|---|
| (1) | Al15Co9Cr16Fe20Mn4Ni33Ti3 | 765 |
| (2) | Al15Co4Cr16Fe20Mn4Ni38Ti3 | 742 |
| (3) | Al20Co4Cr16Fe20Mn4Ni33Ti3 | 680 |
| (4) | Al20Co9Cr16Fe15Mn4Ni33Ti3 | 685 |
| (5) | Al20Co9Cr11Fe20Mn4Ni33Ti3 | 690 |
| (6) | Al24Co6Cr11Fe23Mn3Ni30Ti3 | 690 |
| (7) | Al25Co5Cr10Fe25Mn3Ni27Ti5 | 699 |
| Reference | Inconel 718 (NiCr19Fe19Nb5Mo3) | 1,050 |
In the present study, first-principles based computational materials science calculations were used in order to study the elastic, physical and mechanical properties. CASTEP software, which is a DFT based code, was used for the calculations. Initially, CASTEP geometry optimization process was carried out by decreasing the magnitude of forces up to they become lower than a defined tolerance value. Figure 13 shows the (a) unit cell and (b) superlattice.

Unit cell (left), and superlattice (right).
Elastic constants should satisfy the mechanical stability criteria for a stable alloy. C
11, C
12 and C
44 are the independent elastic constants for the simple cubic crystal structures. C
11, C
12 and C
44 elastic constants must satisfy the following conditions for mechanical stability according to the Born-Huan criteria [20,21,22,23,24,25,26,27,28,29]. Figure 14 shows the elastic constants of the alloys. C
I
value must be positive for mechanically stability of the crystal structure. As shown in the Figure 14, C
I
values are positive and equations (7)–(10) were satisfied, which means all the alloys are mechanically stable.

Elastic constants of the high entropy alloys.
Young’s modulus (E), Poisson’s ratio (ρ), bulk modulus (B) and shear modulus (G) can be calculated by the following equations by using C
11, C
12 and C
44 elastic constants for cubic system [20,21,22,23,24,25,26,27,28,29]. In the present study, determination of the mechanical properties was carried out by using of elastic constants (C
11, C
12 and C
44). Figure 15 shows the calculated Young’s modulus (E), shear modulus (G) and bulk modulus (B) values. Highest Young’s modulus was in the alloy-1, while lowest Young’s modulus was in the alloy-3.

Young’s (E), shear (G) and bulk (B) modulus values of the alloys.
Figure 16 shows the Poisson’s ratio and G/B ratio (Pugh's ratio) values. Poisson‘s ratio (ρ) determines the shear deformation capacity of alloys. Increasing Poisson’s ratio, increase the plastic deformation capacity and ductility. Ductile materials such as metals have Poisson ratio of 0.30–0.33. Brittle materials such as covalent materials have Poisson’s ratio of 0.20–0.25, while ionic materials have Poisson’s ratio of 0.10–0.15. As the Poisson’s ratio values are 0.30–0.32, all alloys are ductile according to the Poisson’s ratio values. G/B ratio is known as Pugh’s ratio, which is depending on the brittle/ductile nature of metals and can be used for the characterization of ductility. If the Pugh’s ratio is lower than 0.57, the alloy is ductile. If the Pugh’s ratio is higher than 0.57, the alloy is brittle. As the Pugh’s ratio values are about 0.40–0.45, all HESA are ductile. In the present study, mechanical properties were determined by experimental and first principles methods. Difference between the experimental and first principles elastic modulus was 5–20%. Difference was attributed to the presence of porosity and superlattice size used for calculations. Larger superlattice structures could not be calculated due to computer capacity.

Poisson’s ratio and G/B ratio values of the alloys.
Density of states (DOS) of the materials could be employed in order to determine the stability of the alloy with respect to their behaviour at the Fermi energy level (E f). Material with the highest DOS at the Fermi energy level is the least stable. Figure 17 illustrates the energy values of the alloys at the Fermi level (E f). Alloys with lower energy level are more stable. Increasing mixing entropy or mixing enthalpy values increased the energy value and decreased the stability of the alloys. Most stable alloy was alloy-2, while least stable alloys were alloy-4 and alloy-7.

Energy values of the alloys at Fermi level.
Figure 18 shows the effect of (a) heat treatment and (b) composition (alloy type) on the DSC curves of the specimens. DSC curves show the major phase transformations of the HESA specimens. Precipitation hardening (aging) temperature increased the solvus temperature of the γ′ precipitates. The first peaks at temperatures between 720 and 800°C shows the starting of the precipitation of γ′. Second peaks at about 910 and 950°C shows the dissolution of the γ′ intermetallic precipitates. Melting temperature values of alloy 1 and alloy 2 were higher. Highest melting temperature was in te alloy 1, while lowest melting temperature was in alloy 7.

Effect of heat treatment (left), and composition on the DSC curves of the specimens (right).
Traditional alloy design strategy depends on one principal element and addition of secondary minor elements. In the high entropy alloys, fundamental is to add five or more principal elements in equimolar ratios in order to increase the configuration entropy in order to produce a single-phase solid solution. Unfortunately, matrix of a high entropy alloy is not strong enough for elevated temperatures. The heat treatment in order to produce intermetallic precipitates consists of a solution treatment above the solvus temperature and precipitation hardening at lower temperatures in order to produce fine intermetallics. Elevated temperature strength of the superalloys depends on the amount and size of the γ I precipitates. Strength of traditional alloys decreases with temperature. But, in the superalloys, strength increases with increasing temperature up to 750–800°C. For elevated temperatures, as the γ I precipitates dissolves, the strength decreases [32,33,34,35]. There are two mechanisms for precipitation hardening of the metals by-pass of dislocations (Orowan theory) or shearing of dislocations mechanism [32,33,34,35].
Figure 19 shows the oxidation behaviour test results of the specimens at 900°C for different durations from 1 to 4 h in air atmosphere. Weight of the alloys was increased with the holding time in air at 900°C. As seen, weight gain values of the alloy-5, alloy-6 and alloy-7 were relatively higher. Increasing weight gain in the alloys was attributed to the decreasing Ni, Cr, and Co contents. Highest weight gain value was in the alloy-6, while lowest weight gain value was in the alloy-2.

Oxidation results of the specimens at different durations.
Table 6 shows the density values and price values of the HESA. Table 6 also shows the density and price values of a traditional Ni-based superalloy (Inconel 718) for comparison. Mean cost values of the HESA were calculated by using price of alloying elements (Al is 2,800 US$ per tonne, Co is 4,3720 US$ per tonne, Cr is 7,400 US$ per tonne, Fe is 650 US$ per tonne, Mn is 1,800 US$ per tonne, Ni is 18,250 US$ per tonne, Ti is 8,000 US$ per tonne, Mo is 55,000 US$ per tonne, and Nb is 77,000 US$ per tonne). In addition, mean density values of the HESA were calculated by using density of alloying elements (Al is 2.71 g/cm3, Co is 8.9 g/cm3, Cr is 7.19 g/cm3, Fe is 7.87 g/cm3, Mn is 7.47 g/cm3, Ni is 8.9 g/cm3, Ti is 4.5 g/cm3, Mo is 10.22 g/cm3, and Nb is 8.58 g/cm3) [36,37]. As seen from the Table 6, cost values of the HESA were 32–48% lower than traditional Ni-based superalloy (Inconel 718). In addition, density values of the HESA were 16–23% lower than traditional superalloy (Inconel 718). Especially density and cost values of the alloy-7 (Al25Co5Cr10Fe25Mn3Ni27Ti5) were 48 and 23% lower than the traditional Inconel 718 superalloy.
Mean cost and density values of the HESA.
| Alloy | Cost (US$/tonne) | Density (g/cm3) | |
|---|---|---|---|
| (1) | Al15Co9Cr16Fe20Mn4Ni33Ti3 | 12,003 | 7.29 |
| (2) | Al15Co4Cr16Fe20Mn4Ni38Ti3 | 10,729 | 7.29 |
| (3) | Al20Co4Cr16Fe20Mn4Ni33Ti3 | 9,957 | 6.98 |
| (4) | Al20Co9Cr16Fe15Mn4Ni33Ti3 | 12,110 | 7.04 |
| (5) | Al20Co9Cr11Fe20Mn4Ni33Ti3 | 11,773 | 7.07 |
| (6) | Al24Co6Cr11Fe23Mn3Ni30Ti3 | 10,027 | 6.80 |
| (7) | Al25Co5Cr10Fe25Mn3Ni27Ti5 | 9,170 | 6.65 |
| Reference | Inconel 718 (NiCr19Fe19Nb5Mo3) | 17,617 | 8.67 |
In this study, AlCoCrFeMnNiTi based refractory-free HESA were prepared by PIM for aviation applications. In addition, aging heat treatment was carried out in order to enhance the high temperature mechanical properties. MA includes material transfer (diffusion) in order to obtain a uniform alloy. Powder injection molding is a powder metal forming technology used for manufacturing of small-medium sizes complex products. Powder injection molding route includes feedstock preparation by blending metal powder and binder, granulation, powder injection molding, debinding, sintering steps.
The main conclusions of the present study are as follows:
-
(1)
Al, Co, Cr, Fe, Mn, Ni, Ti elements were used in order to develop light, cheap HESA with creep and oxidation resistance.
-
(2)
ΔS mix, δ, VEC parameters of different compositions were calculated and compared. The optimum composition of the HESA was Al15Co9Cr16Fe20Mn4Ni33Ti3 due to its optmimum ΔS mix, δ, VEC parameters for solid solution fcc structure formation.
-
(3)
For mechanical properties, 900°C was the optimum precipitation hardening temperature for the HESA.
-
(4)
HESA consited of face centered cubic (γ) matrix phase and γ′ precipitates. Some body centered cubic phase was also observed.
-
(5)
Specimens were produced successfully without microcracks by using PIM method. There is grain-coarseing, and segregation in HESA and high entropy alloys produced by vacuum arc melting.
-
(6)
Solution treatment and aging increased the corrosion rate of the as-sintered specimen. Maximum corrosion rate was obtained at 1,000°C aging. Corrosion rate value of the specimens aged at 800 and 900°C was close to corrosion rate of the solution treated specimen.
-
(7)
Increasing aging temperature increased the solvus temperature of the γ′ precipitates according to DSC analysis.
-
(8)
All the alloys were mechanically stable according to their C I , C 11, C 12 and C 44 elastic constants according to the first priciples based computational study.
-
(9)
Highest Young’s modulus was in the alloy-1, while lowest Young’s modulus was in the alloy-3 according to the first priciples based computational study.
-
(10)
All alloys were ductile according to their Poisson’s ratio and G/B ratio values according to the first priciples based computational study.
-
(11)
Most stable alloy was alloy-2, while least stable alloys were alloy-4 and alloy-7 accoridng to the DOS at the Fermi level (E f) according to the first priciples study.
-
(12)
Difference between the experimental and first principles elastic modulus values was 5–20%. Difference was attributed to the presence of porosity and superlattice size.
-
(13)
Cost values of the HESA were calculated by using price of alloying elements. Cost values of the HESA were 32–48% lower than traditional Ni-based superalloy (Inconel 718).
-
(14)
Density values of the HESA were calculated by using density of alloying elements. Density values of the HESA were 16–23% lower than traditional Ni-based superalloy (Inconel 718).
This work was supported partially by Scientific Research Projects Coordination Unit of Istanbul University-Cerrahpasa, Project Numbers of 36358, 35175.
This work was supported partially by Scientific Research Projects Coordination Unit of Istanbul University-Cerrahpasa, Project Numbers of 36358, 35175.
Emre Atakan Meric: writing, methodology, investigation, Berke Soy: writing, methodology, investigation, Ilven Mutlu: conceptualization, writing – original draft, editing, supervision.
The authors declare that they have no any conflict of interest. This is an original work and it has not been submitted to any other journal for review.
The data are available on request. The authors can share the data required to reproduce these findings by e-mail.