Figure 1
Figure 2
Figure 3
Figure 4
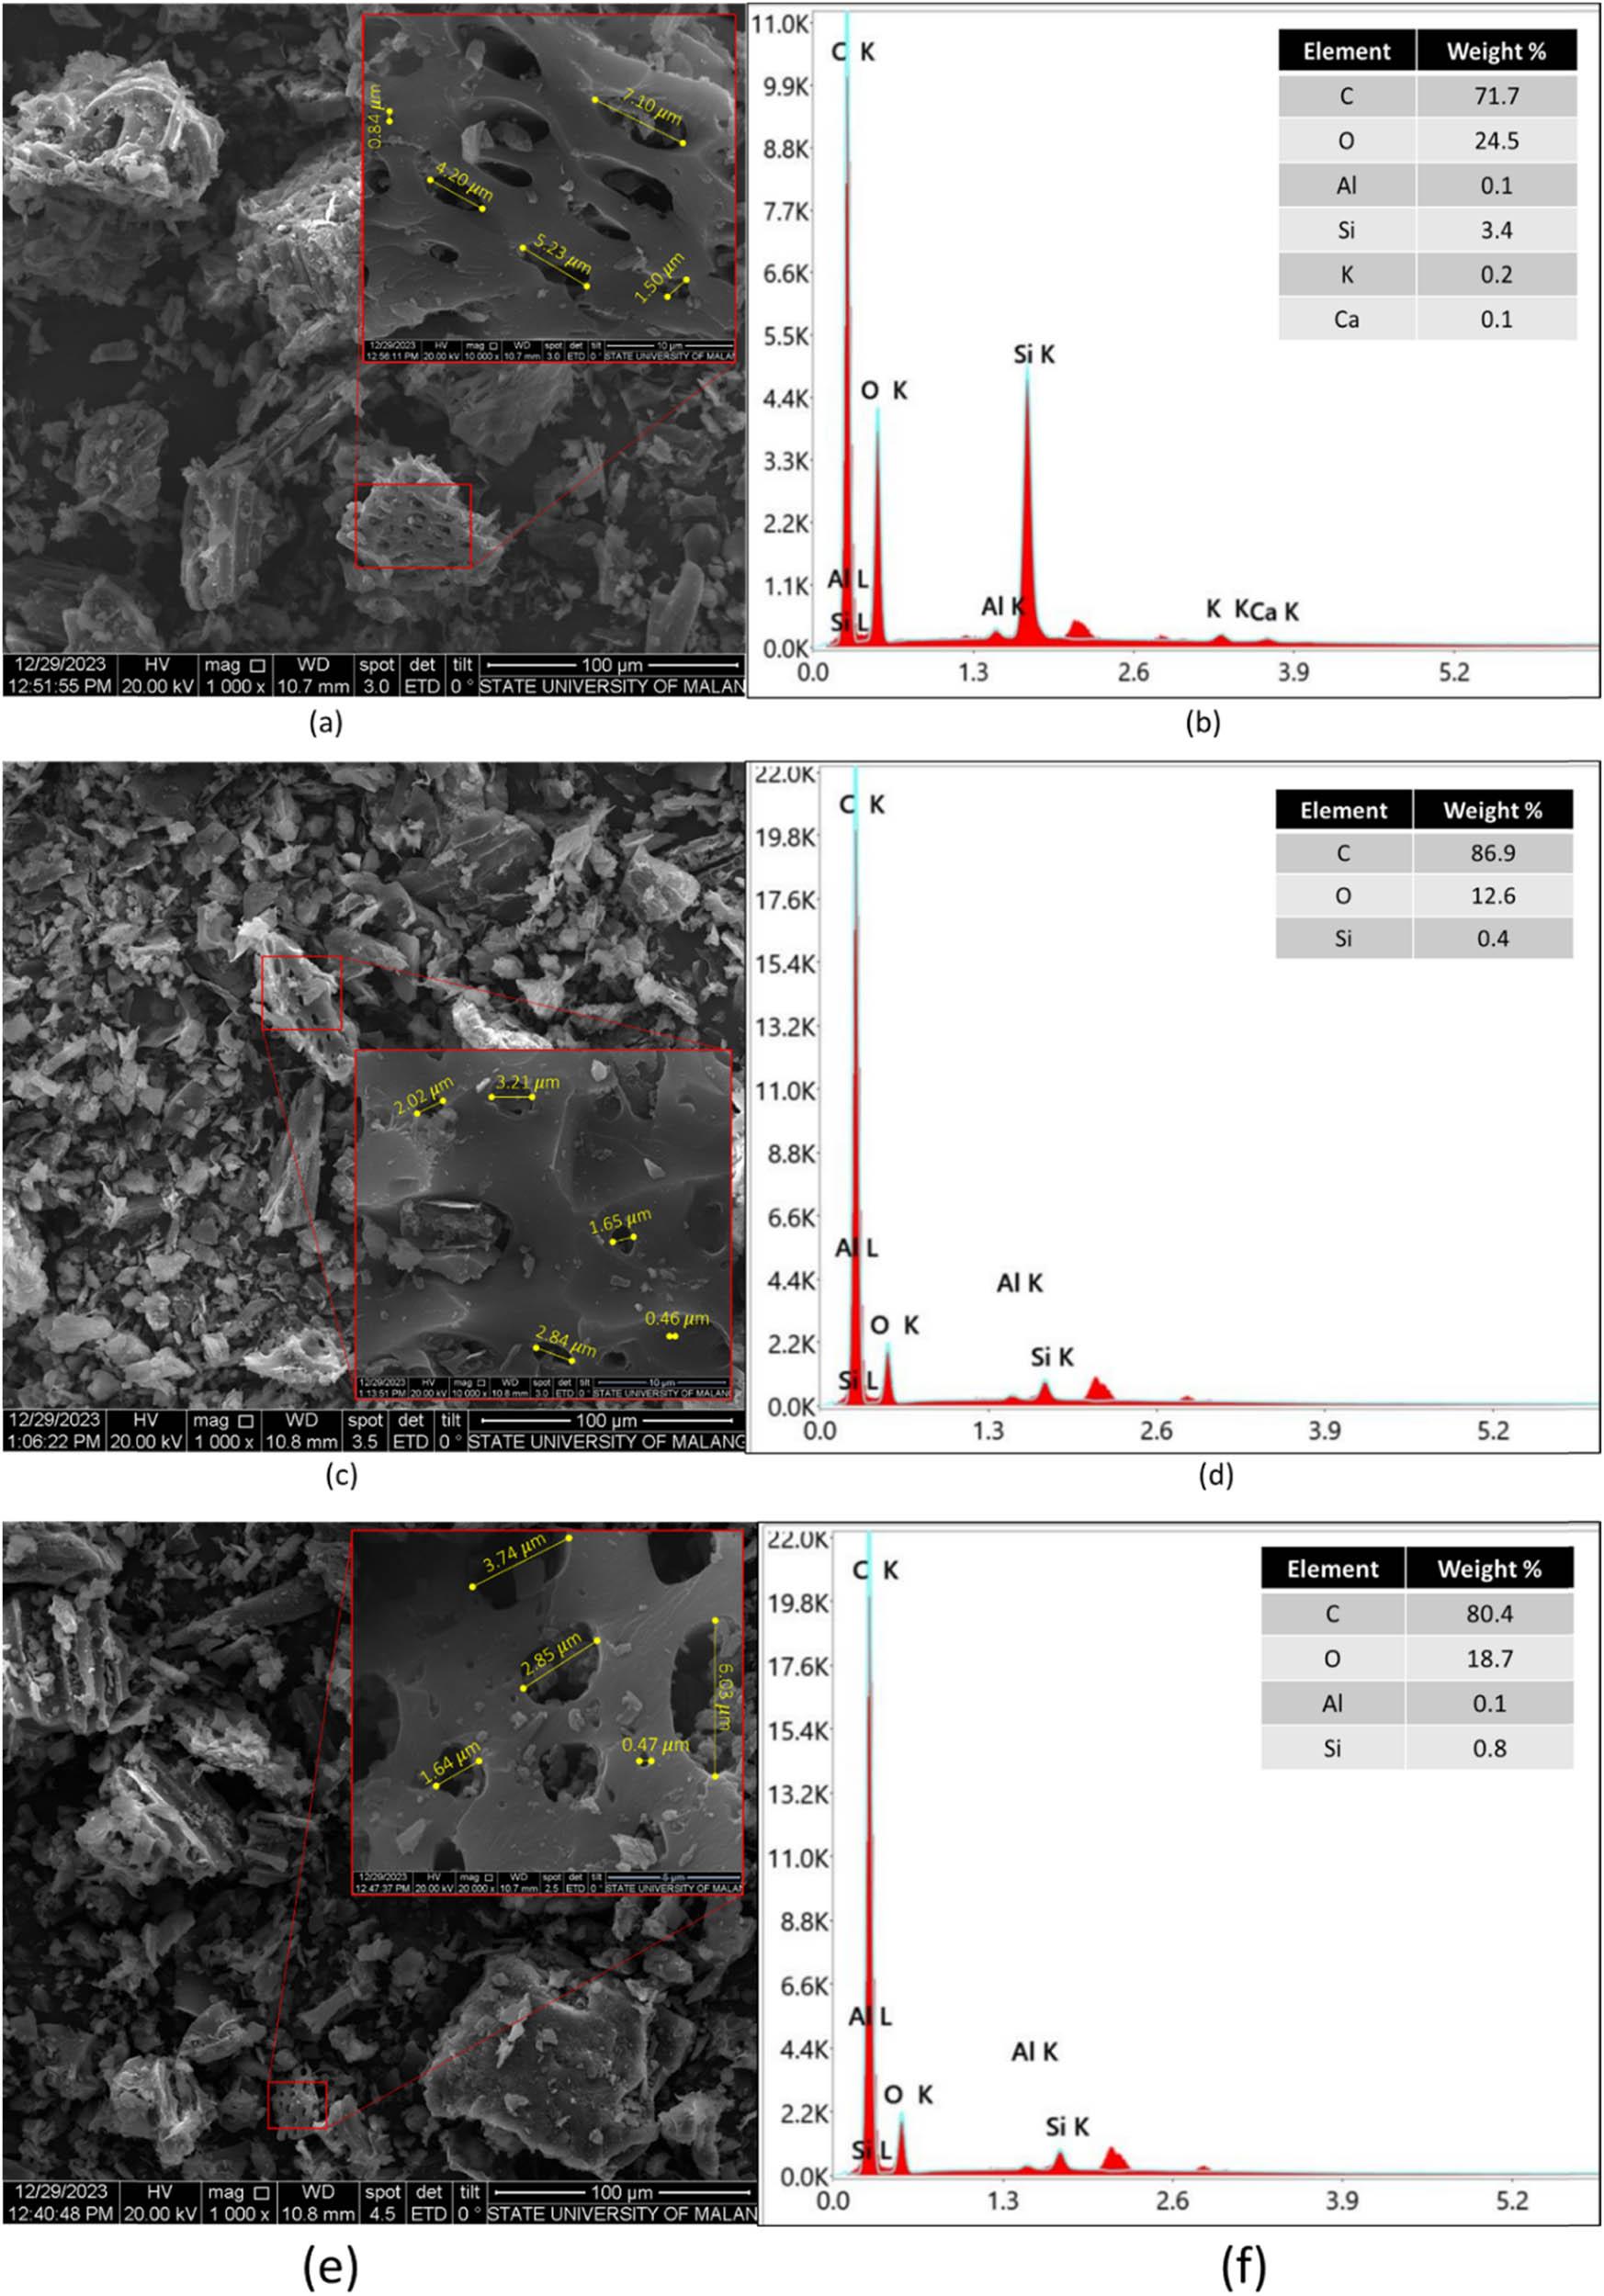
Figure 5
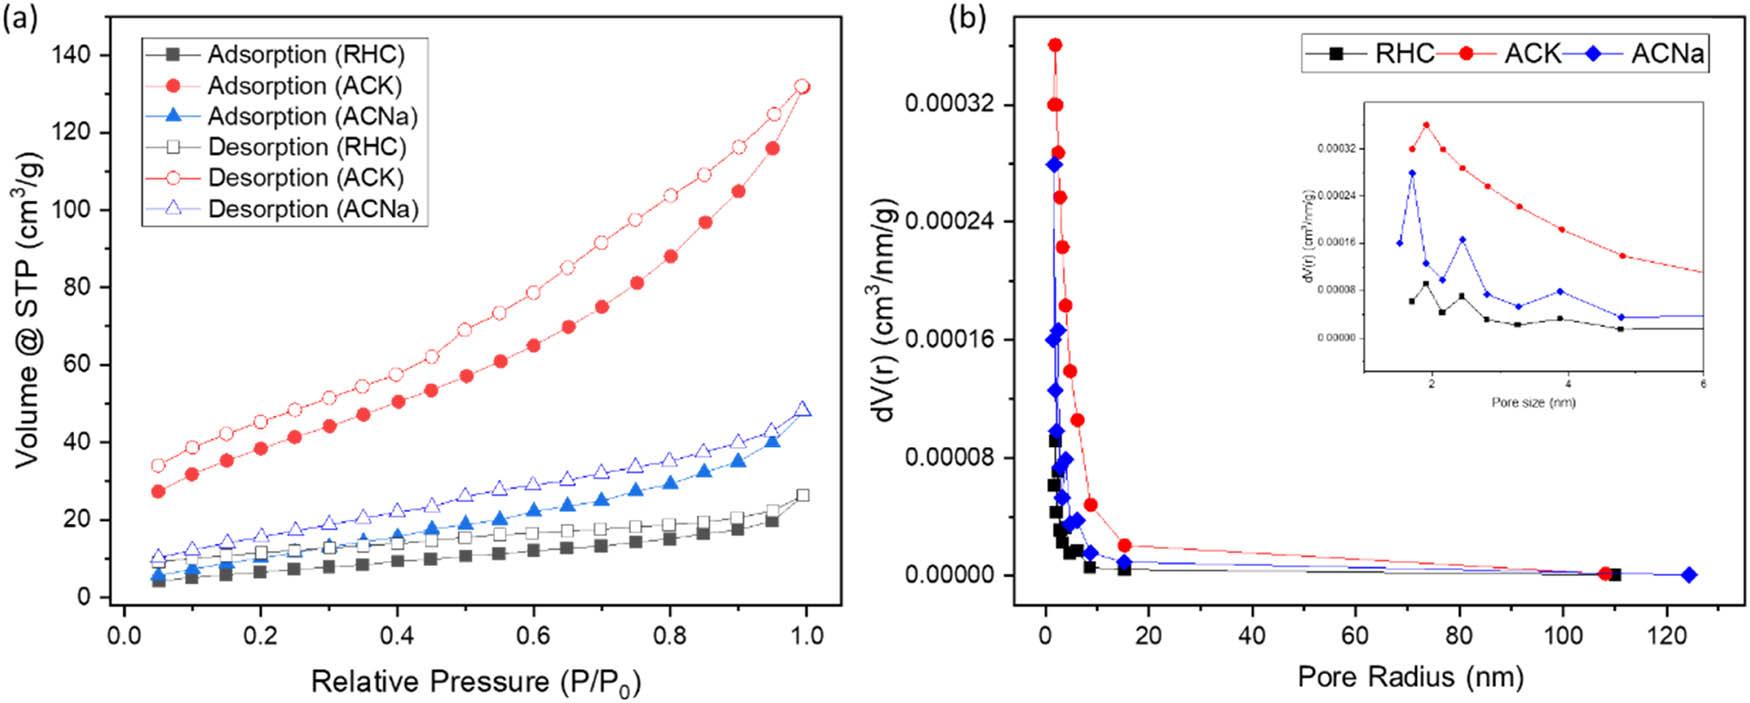
Figure 6
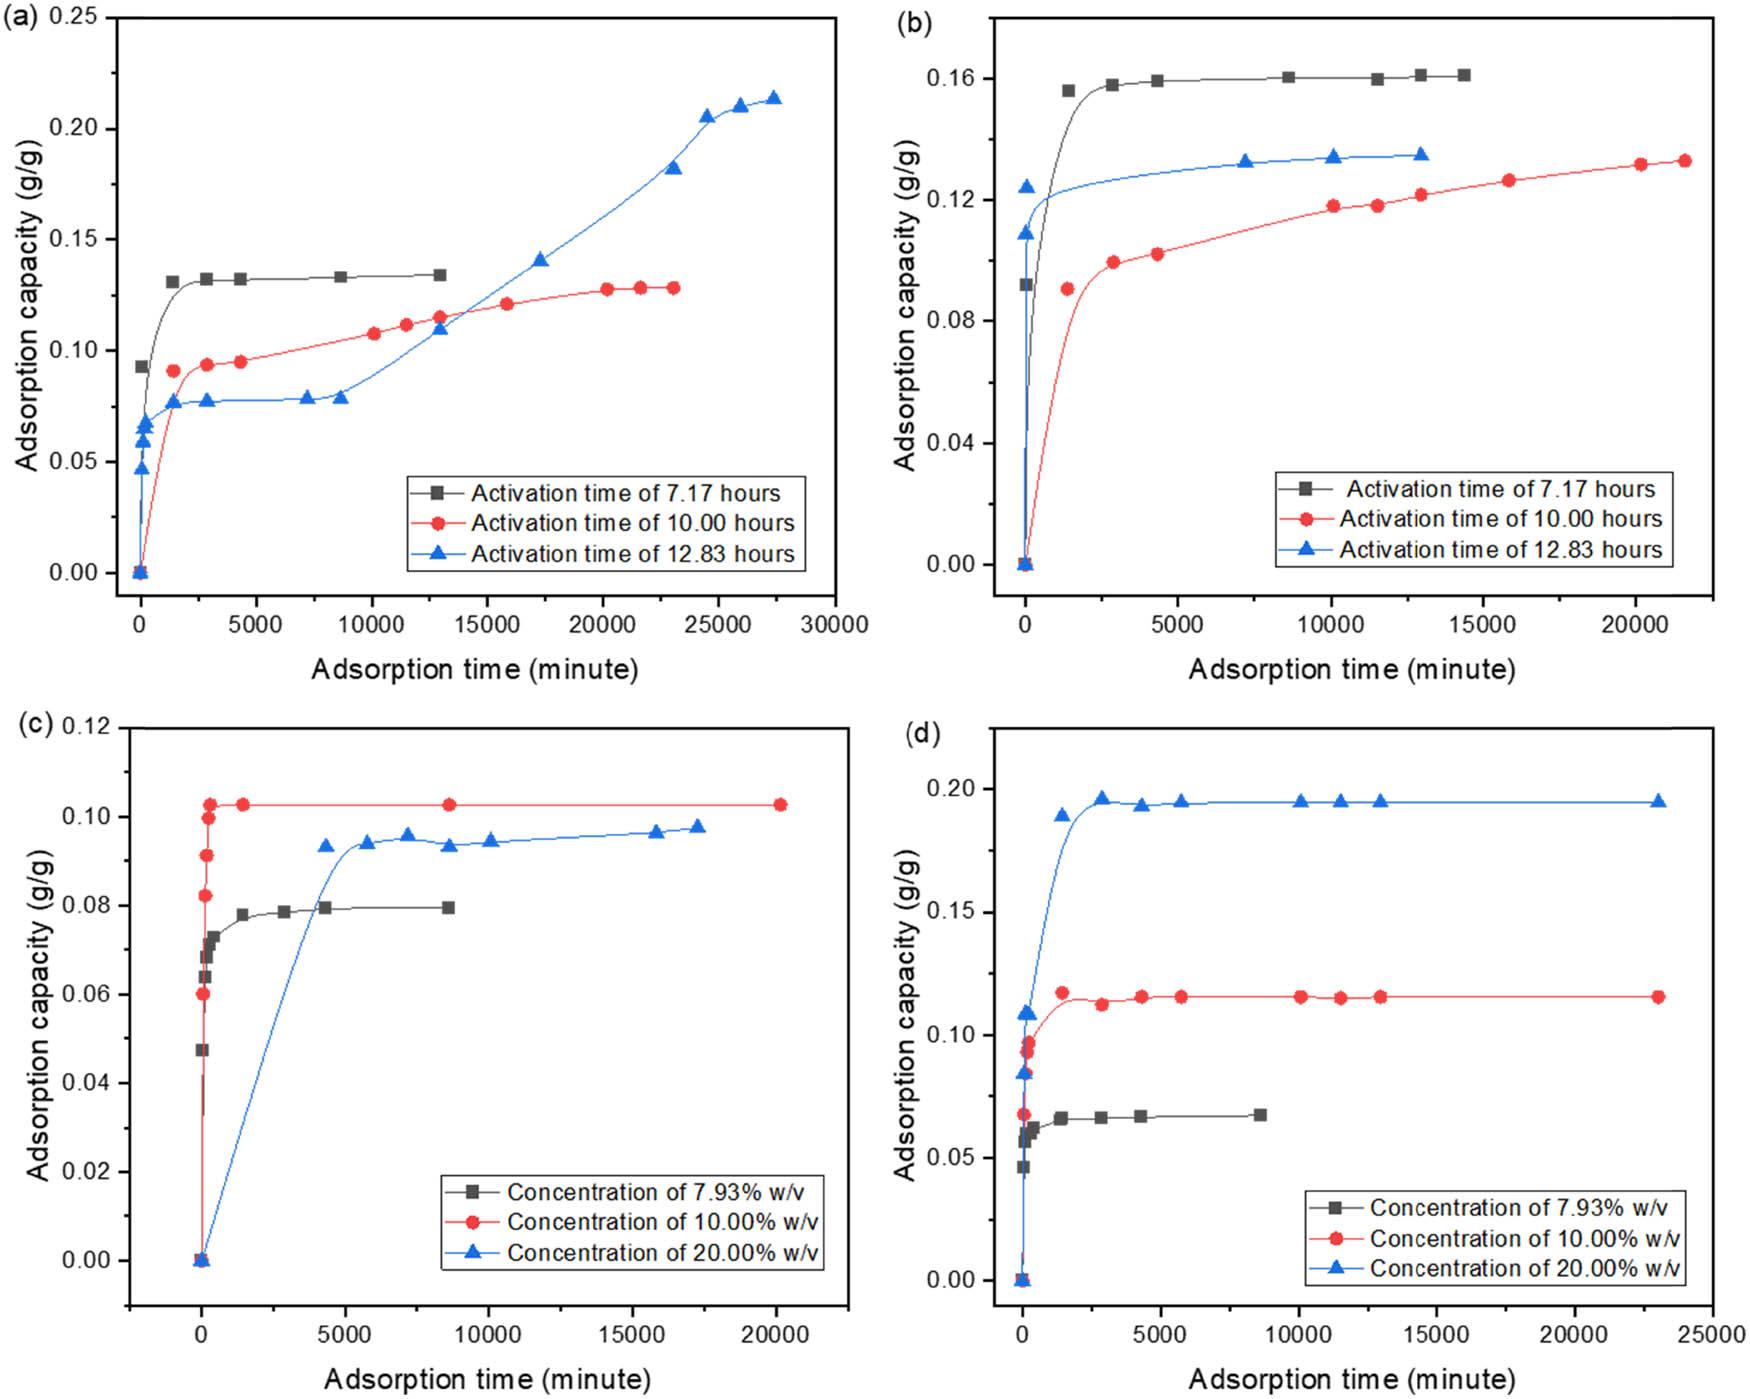
Figure 7
Figure 8
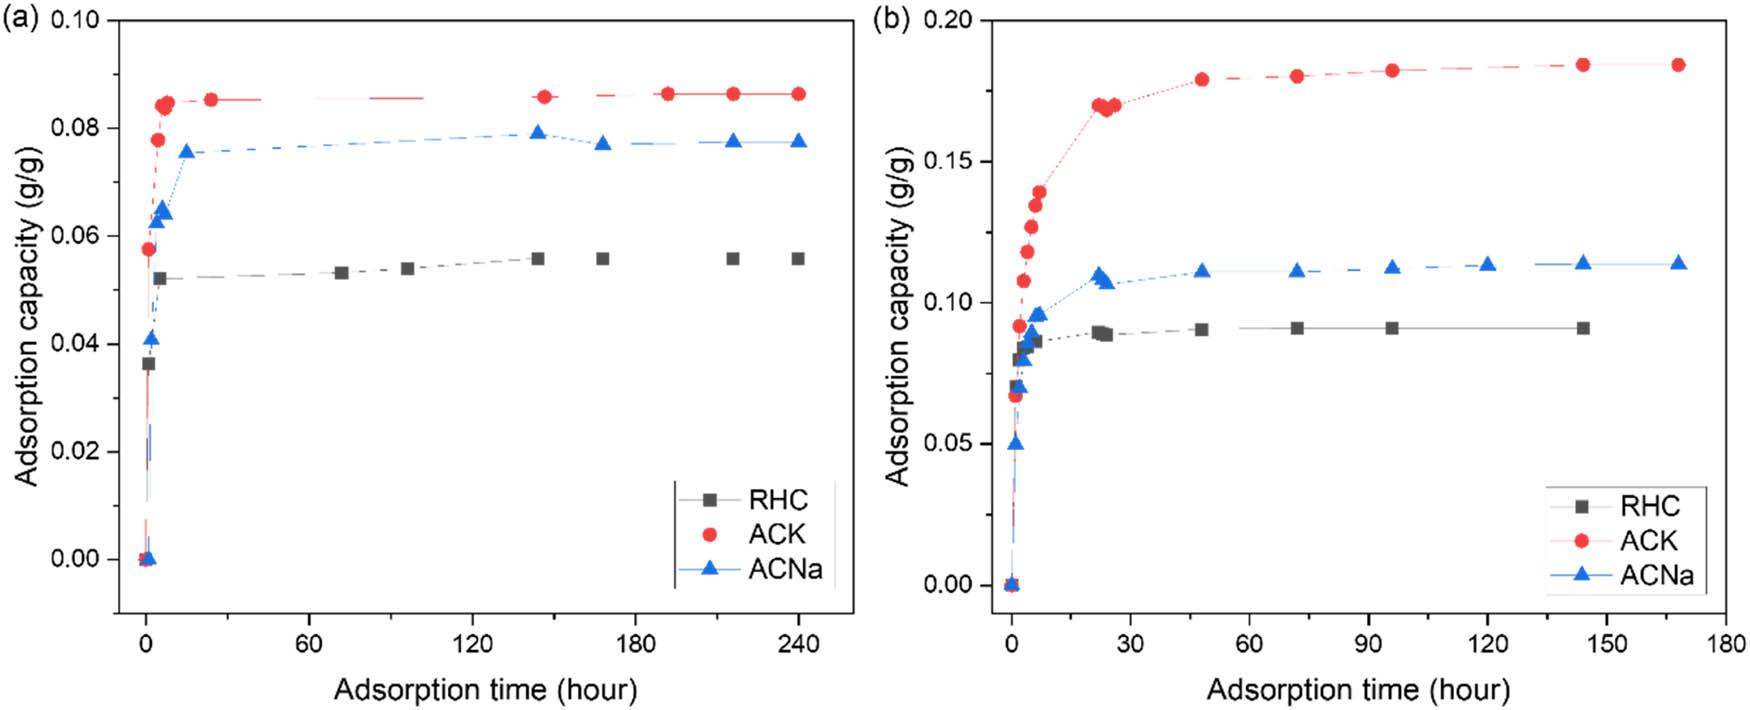
Figure 9
Figure 10
Figure 11
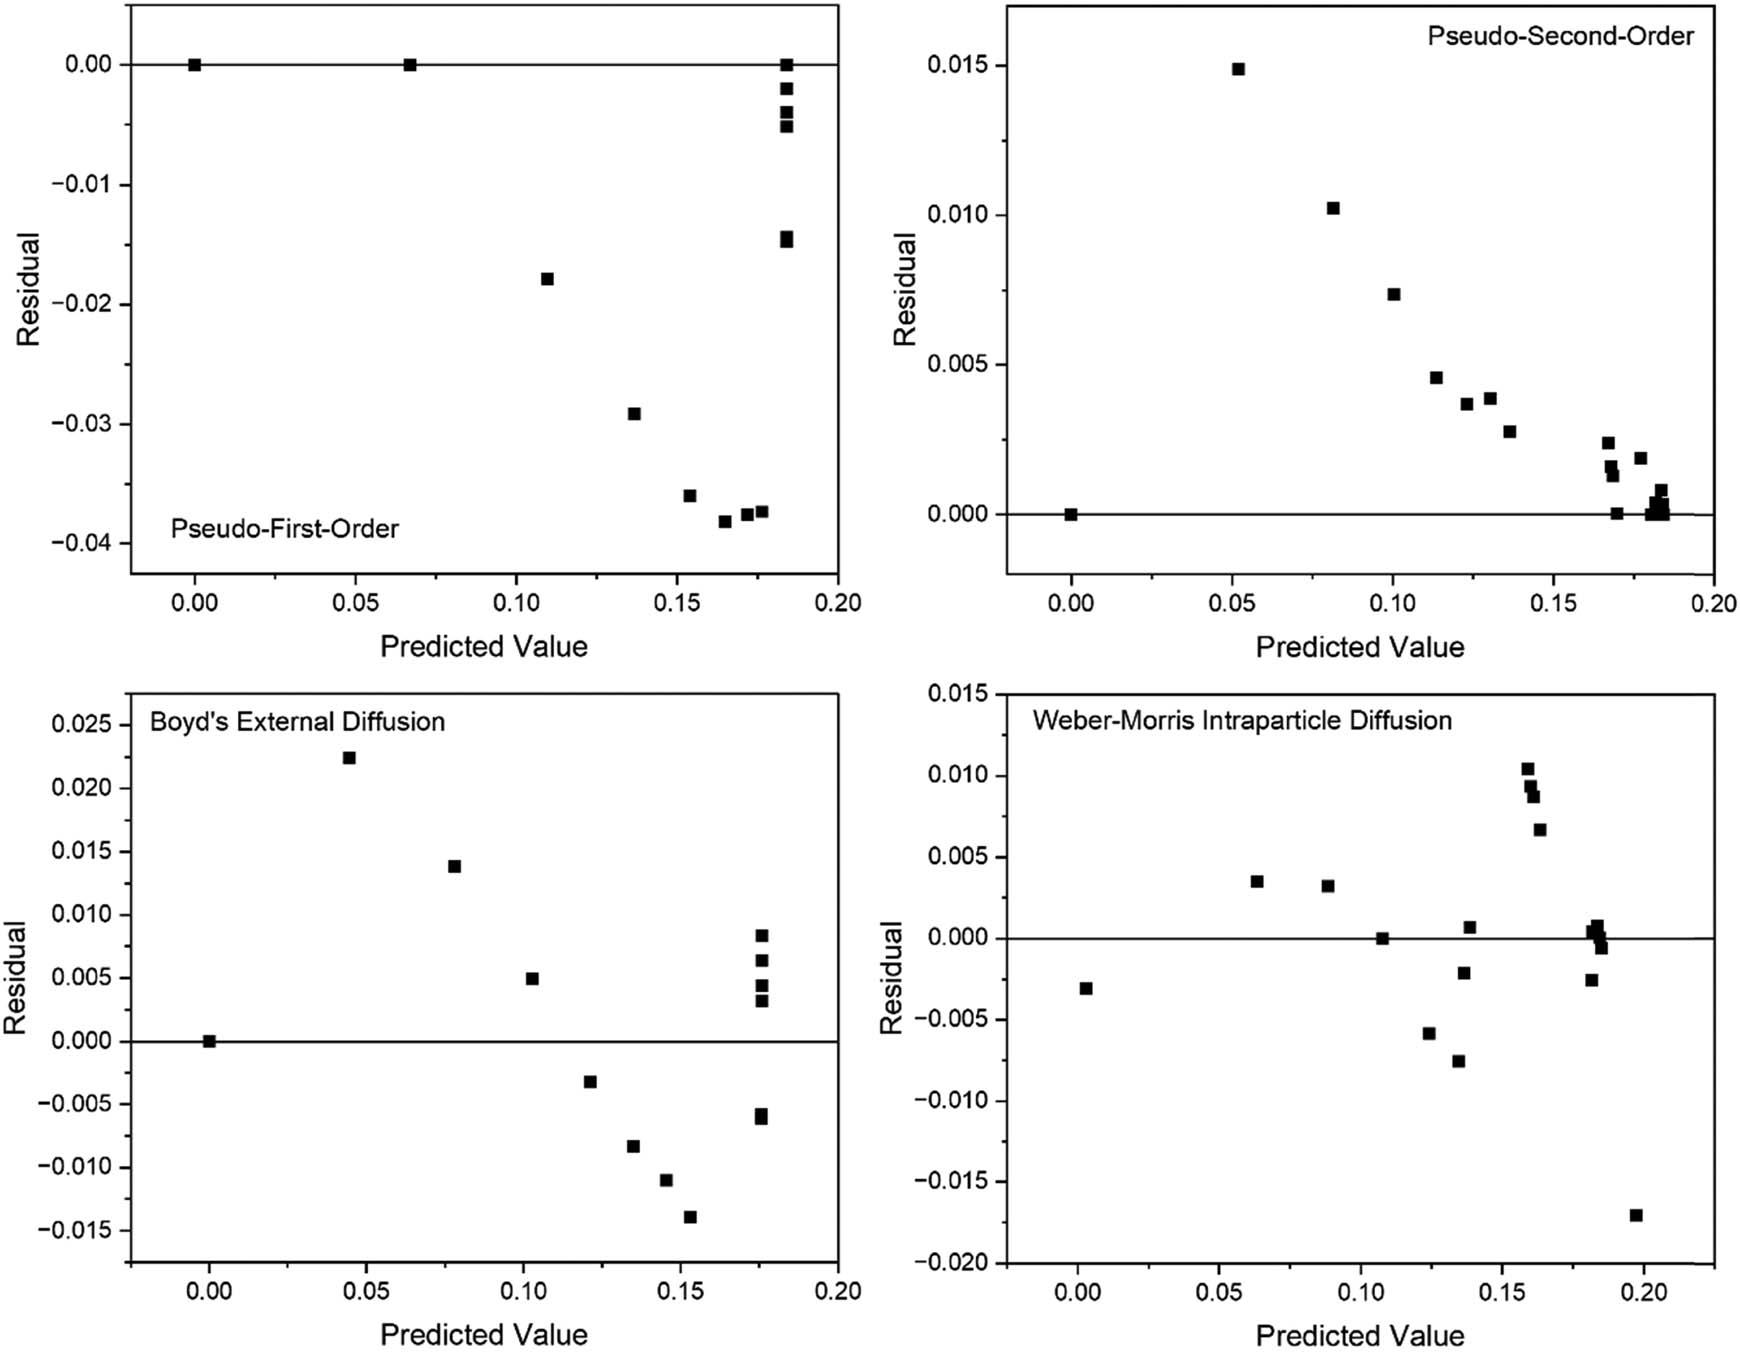
Figure 12
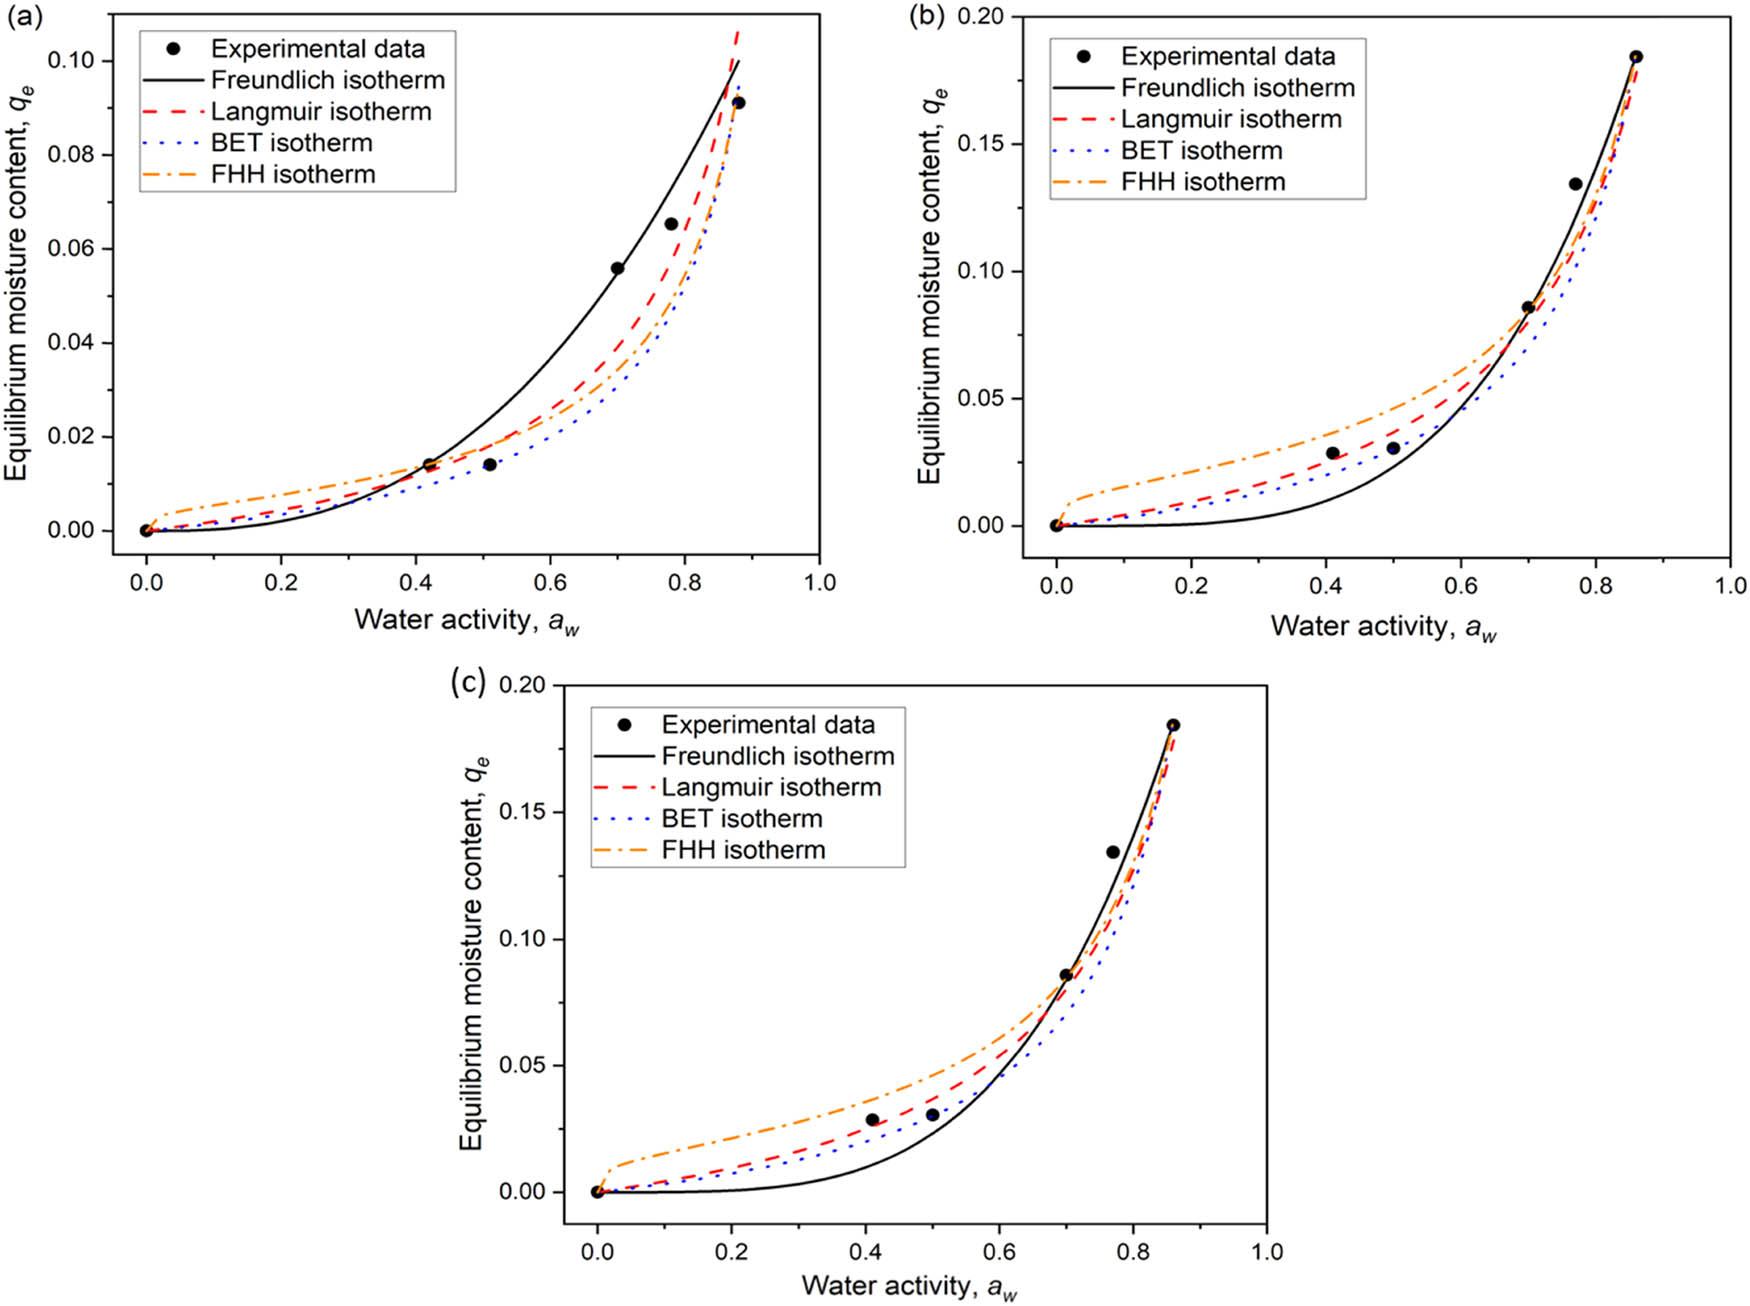
Figure 13
Optimum conditions for preparing activated carbon from rice husk using activating agents of KOH and NaOH_
| Activating agent | Concentration (% w/v) | Activation time (h) | Adsorption capacity (g/g) | Composite desirability |
|---|---|---|---|---|
| KOH | 22.07 | 12.83 | 0.32 | 1 |
| NaOH | 22.07 | 7.17 | 0.23 | 1 |
Parameters of Boyd’s external diffusion model of rice husk and activated carbons_
| Sample | Parameter | |||
|---|---|---|---|---|
| k | R | R 2 | SSE | |
| KOH 15% w/v 7.17 h | 0.1321 | 0.0202 | 0.9994 | 1.1239 × 10⁻⁶ |
| KOH 15% w/v 10.0 h | 0.1209 | 0.0010 | 0.9120 | 0.0001 |
| KOH 15% w/v 12.83 h | 0.3071 | 4.138 × 10⁻⁵ | 0.8860 | 0.0013 |
| KOH 7.93% w/v 8.00 h | 0.0764 | 0.0149 | 0.9877 | 6.682 × 10⁻⁶ |
| KOH 10.00% w/v 8.00 h | 0.1027 | 0.0139 | 0.9981 | 2.006 × 10⁻⁶ |
| KOH 20.00% w/v 8.00 h | 0.0954 | 0.0008 | 0.9985 | 1.488 × 10⁻⁶ |
| NaOH 15% w/v 7.17 h | 0.1607 | 0.0024 | 0.8826 | 0.0006 |
| NaOH 15% w/v 10.0 h | 0.1369 | 0.0002 | 0.7638 | 0.0007 |
| NaOH 15% w/v 12.83 h | 0.1328 | 0.0689 | 0.9984 | 3.708 × 10⁻⁶ |
| NaOH 7.93% w/v 8.00 h | 0.0764 | 0.0149 | 0.9877 | 6.682 × 10⁻⁶ |
| NaOH 10.00% w/v 8.00 h | 0.1140 | 0.0115 | 0.9789 | 2.219 × 10⁻⁵ |
| NaOH 20.00% w/v 8.00 h | 0.1928 | 0.0052 | 0.9546 | 0.0002 |
| Relative humidity of 85%: RHC | 0.0883 | 0.0244 | 0.9880 | 6.290 × 10⁻⁶ |
| Relative humidity of 85%: ACK | 0.1759 | 0.0049 | 0.9687 | 8.557 × 10⁻⁵ |
| Relative humidity of 85%: ACNa | 0.1094 | 0.0072 | 0.9729 | 2.491 × 10⁻⁵ |
| Relative humidity of 70%: RHC | 0.0546 | 0.0153 | 0.9636 | 8.438 × 10⁻⁶ |
| Relative humidity of 70%: ACK | 0.0846 | 0.0186 | 0.9925 | 4.651 × 10⁻⁶ |
| Relative humidity of 70%: ACNa | 0.0742 | 0.0100 | 0.9561 | 2.171 × 10⁻⁵ |
| Average | 0.9550 | 1.720 × 10 −4 | ||
Parameters of nonlinear pseudo-first-order model of rice husk and activated carbons_
| Sample | Parameter | |||
|---|---|---|---|---|
| k | q e | R 2 | SSE | |
| KOH 15% w/v 7.17 h | 0.0202 | 0.1321 | 0.9994 | 1.124 × 10⁻⁶ |
| KOH 15% w/v 10.0 h | 0.0007 | 0.1174 | 0.9184 | 9.947 × 10⁻⁵ |
| KOH 15% w/v 12.83 h | 0.0001 | 0.3069 | 0.8059 | 0.0056 |
| KOH 7.93% w/v 8.00 h | 0.0148 | 0.0765 | 0.9877 | 6.686 × 10⁻⁶ |
| KOH 10.00% w/v 8.00 h | 0.0138 | 0.1027 | 0.9981 | 2.010 × 10⁻⁶ |
| KOH 20.00% w/v 8.00 h | 0.0008 | 0.0954 | 0.9985 | 1.488 × 10⁻⁶ |
| NaOH 15% w/v 7.17 h | 0.0143 | 0.1592 | 0.9992 | 2.195 × 10⁻⁶ |
| NaOH 15% w/v 10.0 h | 0.0008 | 0.1223 | 0.9499 | 6.990 × 10⁻⁵ |
| NaOH 15% w/v 12.83 h | 0.0688 | 0.1328 | 0.9984 | 3.708 × 10⁻⁶ |
| NaOH 7.93% w/v 8.00 h | 0.0192 | 0.0643 | 0.9853 | 5.100 × 10⁻⁶ |
| NaOH 10.00% w/v 8.00 h | 0..0112 | 0.1142 | 0.9791 | 2.234 × 10⁻⁵ |
| NaOH 20.00% w/v 8.00 h | 0.0052 | 0.1928 | 0.9548 | 1.846 × 10⁻⁴ |
| Relative humidity of 85%: RHC | 0.0247 | 0.0911 | 0.9880 | 1.346 × 10⁻⁵ |
| Relative humidity of 85%: ACK | 0.0075 | 0.1843 | 0.9164 | 4.235 × 10⁻⁴ |
| Relative humidity of 85%: ACNa | 0.0096 | 0.1137 | 0.9515 | 8.525 × 10⁻⁵ |
| Relative humidity of 70%: RHC | 0.0080 | 0.0578 | 0.9310 | 2.306 × 10⁻⁵ |
| Relative humidity of 70%: ACK | 0.0103 | 0.0864 | 0.9612 | 3.018 × 10⁻⁵ |
| Relative humidity of 70%: ACNa | 0.0124 | 0.0775 | 0.9521 | 3.670 × 10⁻⁵ |
| Average | 0.9597 | 3.672 × 10 −4 | ||
Parameters of nonlinear pseudo-second-order model of rice husk and activated carbons_
| Sample | Parameter | |||
|---|---|---|---|---|
| k | q e | R 2 | SSE | |
| KOH 15% w/v 7.17 h | 0.2884 | 0.1331 | 0.9998 | 3.208 × 10⁻⁷ |
| KOH 15% w/v 10.0 h | 0.0097 | 0.1256 | 0.9569 | 5.180 × 10⁻⁴ |
| KOH 15% w/v 12.83 h | 0.0001 | 0.4349 | 0.6630 | 0.0062 |
| KOH 7.93% w/v 8.00 h | 0.3448 | 0.0799 | 0.9968 | 1.741 × 10⁻⁶ |
| KOH 10.00% w/v 8.00 h | 0.2616 | 0.1069 | 0.9807 | 1.999 × 10⁻⁵ |
| KOH 20.00% w/v 8.00 h | 0.1171 | 0.0953 | 0.9986 | 1.719 × 10⁻⁶ |
| NaOH 15% w/v 7.17 h | 0.1383 | 0.1608 | 0.9999 | 1.154 × 10⁻⁷ |
| NaOH 15% w/v 10.0 h | 0.0097 | 0.1309 | 0.8741 | 3.782 × 10⁻⁴ |
| NaOH 15% w/v 12.83 h | 1.4591 | 0.1341 | 0.9990 | 2.322 × 10⁻⁶ |
| NaOH 7.93% w/v 8.00 h | 0.5912 | 0.0667 | 0.9976 | 8.268 × 10⁻⁷ |
| NaOH 10.00% w/v 8.00 h | 0.1934 | 0.1163 | 0.9978 | 2.215 × 10⁻⁶ |
| NaOH 20.00% w/v 8.00 h | 0.0417 | 0.1976 | 0.9731 | 1.072 × 10⁻³ |
| Relative humidity of 85%: RHC | 0.6570 | 0.0915 | 0.9994 | 7.453 × 10⁻⁷ |
| Relative humidity of 85%: ACK | 0.0345 | 0.1868 | 0.9957 | 3.080 × 10⁻⁵ |
| Relative humidity of 85%: ACNa | 0.0983 | 0.1151 | 0.9982 | 3.300 × 10⁻⁶ |
| Relative humidity of 70%: RHC | 0.5095 | 0.0580 | 0.9858 | 7.410 × 10⁻⁶ |
| Relative humidity of 70%: ACK | 0.5774 | 0.0865 | 0.9903 | 6.347 × 10⁻⁶ |
| Relative humidity of 70%: ACNa | 0.1385 | 0.0780 | 0.9809 | 1.410 × 10⁻⁵ |
| Average | 0.9660 | 4.583 × 10 −4 | ||
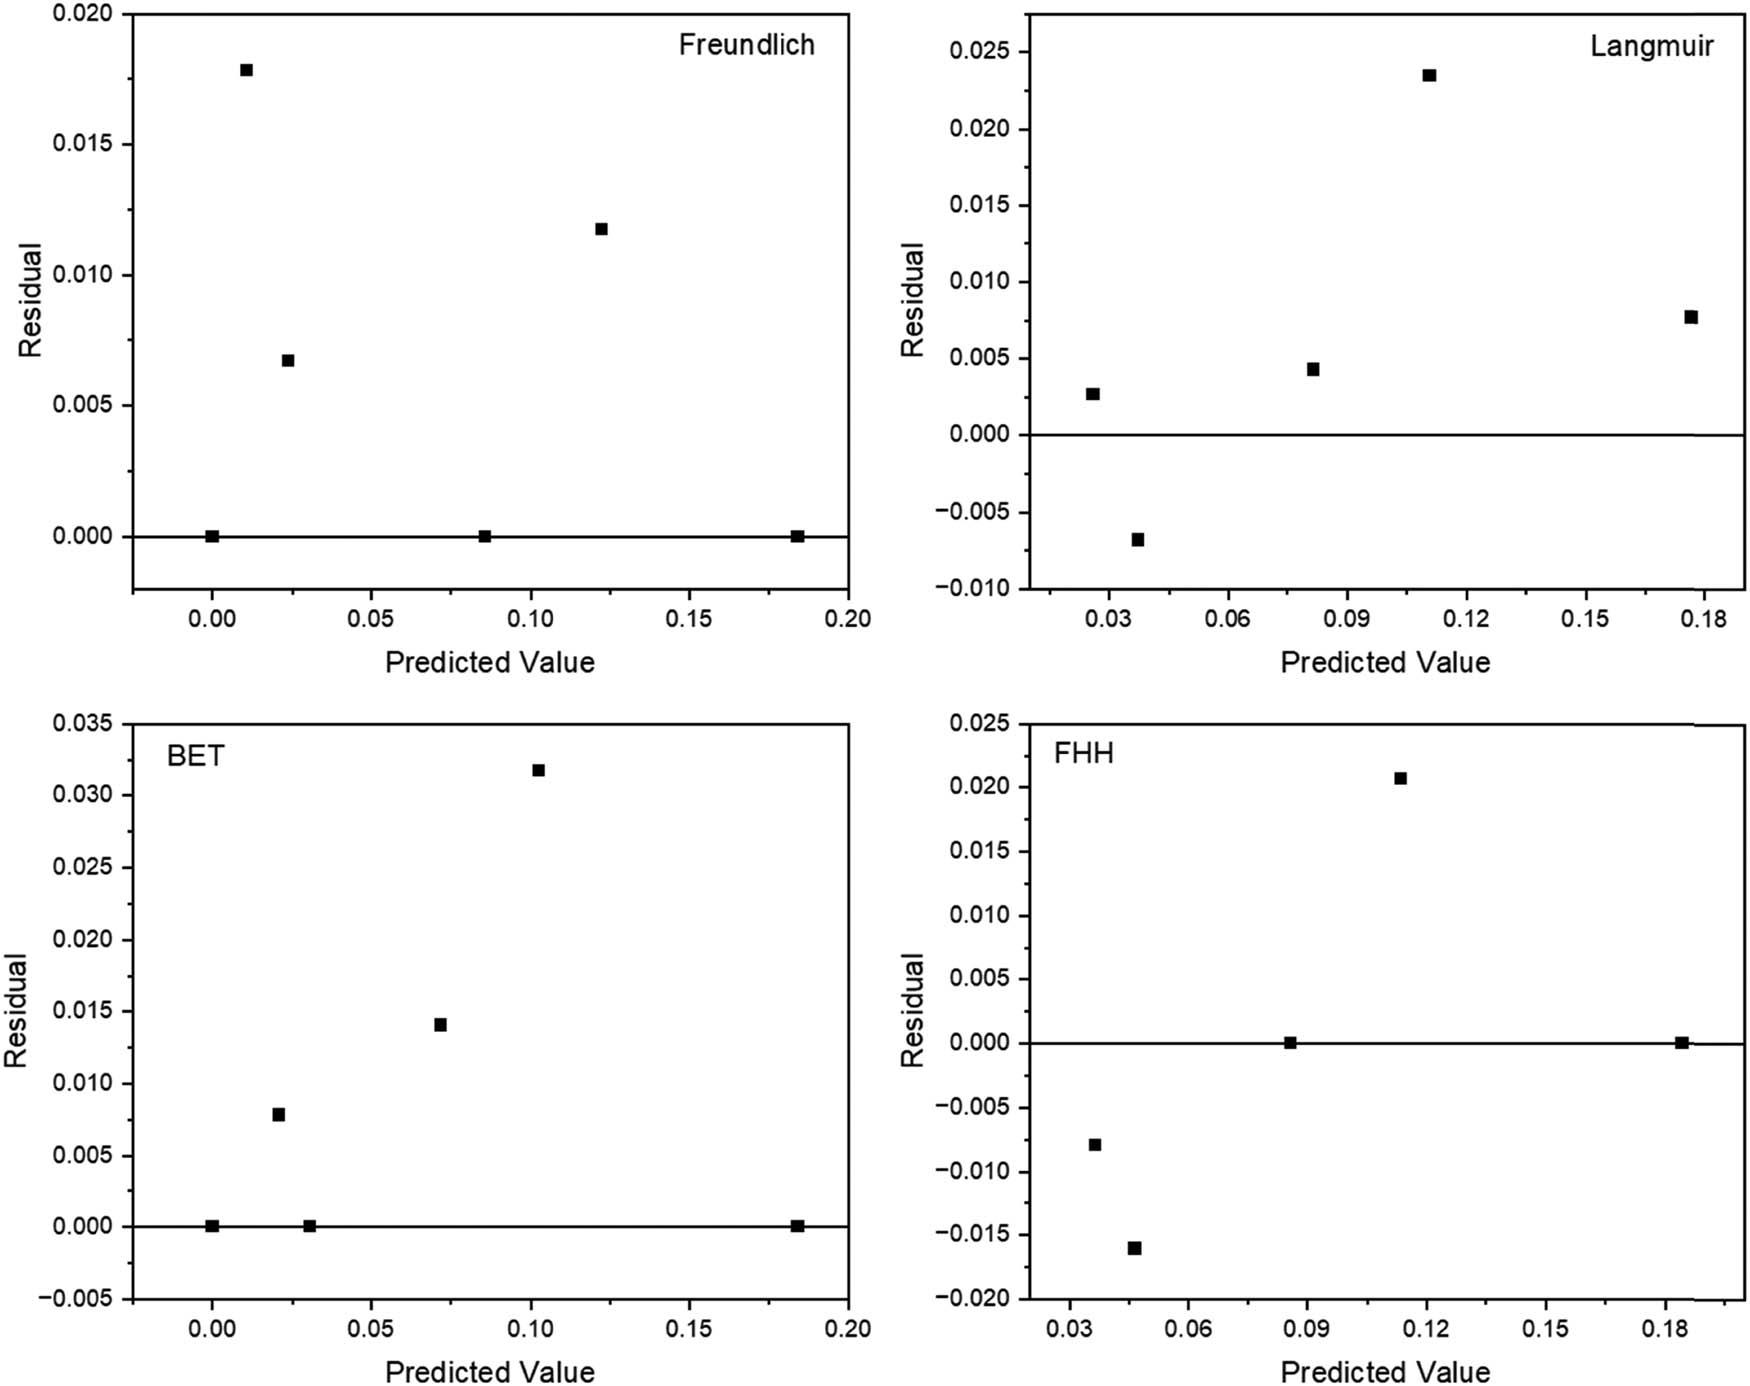
Water vapor sorption isotherm models of rice husk and activated carbon_
| Isotherm model | Sample | Parameters | R 2 | SSE | |
|---|---|---|---|---|---|
| Freundlich | RHC | k F = 0.1397 | n F = 0.3821 | 0.9861 | 0.0002 |
| ACK | k F = 0.3311 | n F = 0.2606 | 0.9898 | 0.0005 | |
| ACNa | k F = 0.2040 | n F = 0.2888 | 0.9510 | 0.0008 | |
| Langmuir | RHC | m 0 = 0.0186 | k L = 0.9680 | 0.9164 | 0.0005 |
| ACK | m 0 = 0.0412 | k L = 0.9448 | 0.9807 | 0.0007 | |
| ACNa | m 0 = 0.0372 | k L = 0.8874 | 0.9226 | 0.0006 | |
| BET | RHC | m 0 = 0.0127 | c B = 1.1326 | 0.9124 | 0.0009 |
| ACK | m 0 = 0.0305 | c B = 0.9708 | 0.9700 | 0.0013 | |
| ACNa | m 0 = 0.0208 | c B = 1.0275 | 0.9079 | 0.0016 | |
| FHH | RHC | m 0 = 0.0124 | r = 1.0129 | 0.8935 | 0.0007 |
| ACK | m 0 = 0.0330 | r = 1.0921 | 0.9691 | 0.0007 | |
| ACNa | m 0 = 0.0216 | r = 1.0702 | 0.8848 | 0.0009 | |
Comparison of the adsorption capacity by several desiccants_
| Desiccant | Adsorption capacity (g water/g desiccant) | Reference |
|---|---|---|
| Synthesized zeolite 13X | 0.47 | [53] |
| Synthesized zeolite Na-A | 0.18 | [53] |
| Silica gel | 0.29–0.32 | [53,54] |
| Sulfuric acid-treated activated carbon | 0.36 | [55] |
| Nitric acid-treated activated carbon | 0.27 | [55] |
| Acorn nutshell-based activated carbon | 0.29 | [56] |
| Rice husk-based activated carbon | 0.27 | This research |
Water vapor adsorption isotherm models in this research_
| Isotherm model | Formula | Parameters |
|---|---|---|
| Freundlich [31] |
| k f = Freundlich constant |
| n f = adsorption intensity | ||
| Langmuir [32] |
| k L = Langmuir constant |
| m 0 = monolayer adsorption | ||
| BET (Brunauer, Emmett, and Teller) [33] |
| c B = BET constant |
| FHH (Frenkel-Halsey-Hill) [31] |
| r = FHH constant |
Adsorption models used in this research [27,28]_
| Equation | ||
|---|---|---|
| Adsorption kinetics models | Pseudo-first-order |
|
| Pseudo-second-order |
| |
| Diffusion models | Boyd’s external diffusion |
|
| Weber–Morris intraparticle diffusion |
| |
Parameters of Weber–Morris intraparticle diffusion model of rice husk and activated carbons_
| Sample | Parameter | ||||
|---|---|---|---|---|---|
| k 1 | k 2 | k 3 | R 2 | SSE | |
| I 1 | I 2 | I 3 | |||
| KOH 15% w/v 7.17 h | 0.0028 | 0.00004 | — | 0.8229 | 0.0004 |
| 0.0315 | 0.12880 | — | |||
| KOH 15% w/v 10.0 h | 0.0019 | 0.00040 | — | 0.9702 | 3.837 × 10⁻⁵ |
| 0.0046 | 0.07060 | ||||
| KOH 15% w/v 12.83 h | 0.0045 | 0.00010 | 0.00200 | 0.9937 | 3.618 × 10⁻⁵ |
| 0.0048 | 0.06910 | −0.11050 | |||
| KOH 7.93% w/v 8.00 h | 0.0059 | 0.00045 | 0.00003 | 0.9982 | 1.036 × 10⁻⁶ |
| 0.0004 | 0.06184 | 0.07681 | |||
| KOH 10.00% w/v 8.00 h | 0.0066 | 0.00001 | — | 0.9868 | 1.366 × 10⁻⁵ |
| 0.0042 | 0.10140 | — | |||
| KOH 20.00% w/v 8.00 h | 0.0011 | 0.00010 | — | 0.9661 | 3.777 × 10⁻⁵ |
| 0.0055 | 0.08410 | — | |||
| NaOH 15% w/v 7.17 h | 0.0035 | 0.00005 | — | 0.9104 | 0.0002 |
| 0.0286 | 0.15477 | — | |||
| NaOH 15% w/v 10.0 h | 0.0020 | 0.00040 | — | 0.9302 | 0.0002 |
| 0.0037 | 0.07930 | — | |||
| NaOH 15% w/v 12.83 h | 0.0187 | 0.00010 | — | 0.9796 | 4.716 × 10⁻⁵ |
| 0.0039 | 0.12340 | — | |||
| NaOH 7.93% w/v 8.00 h | 0.0046 | 0.00025 | 0.00003 | 0.9745 | 8.860 × 10⁻⁶ |
| 0.0033 | 0.05626 | 0.06475 | |||
| NaOH 10.00% w/v 8.00 h | 0.0064 | 0.00008 | — | 0.9706 | 3.129 × 10⁻⁵ |
| 0.0073 | 0.10640 | — | |||
| NaOH 20.00% w/v 8.00 h | 0.0101 | 0.00186 | 0.00001 | 0.9703 | 0.0001 |
| 0.0013 | 0.08947 | 0.19304 | |||
| Relative humidity of 85%: RHC | 0.0065 | 0.00022 | 0.00004 | 0.9545 | 2.386 × 10⁻⁵ |
| 0.0062 | 0.08147 | 0.08768 | |||
| Relative humidity of 85%: ACK | 0.0078 | 0.00130 | 0.00010 | 0.9829 | 5.402 × 10⁻⁵ |
| 0.0031 | 0.11190 | 0.17451 | |||
| Relative humidity of 85%: ACNa | 0.0053 | 0.00084 | 0.00008 | 0.9888 | 9.679 × 10⁻⁶ |
| 0.0052 | 0.07729 | 0.10614 | |||
| Relative humidity of 70%: RHC | 0.0029 | 0.00006 | — | 0.9608 | 9.018 × 10⁻⁶ |
| 0.0048 | 0.05031 | — | |||
| Relative humidity of 70%: ACK | 0.0042 | 0.00002 | — | 0.9473 | 3.261 × 10⁻⁵ |
| 0.0091 | 0.08393 | — | |||
| Relative humidity of 70%: ACNa | 0.0040 | 0.00093 | 0.00002 | 0.9777 | 1.292 × 10⁻⁵ |
| 0.0032 | 0.04694 | 0.07457 | |||
| Average | 0.9603 | 6.980 × 10 −5 | |||
Chemical composition of RHC and activated carbon_
| Compound | Composition (%) | Reduction (%) | Increase (%) | ||||
|---|---|---|---|---|---|---|---|
| RHC | ACK | ACNa | ACK | ACNa | ACK | ACNa | |
| SiO2 | 87.00 | 92.70 | 87.70 | 6.55 | 0.80 | ||
| P2O5 | 2.20 | 2.70 | 3.80 | 22.73 | 72.73 | ||
| K2O | 4.52 | 0.67 | 0.88 | 85.18 | 80.53 | ||
| CaO | 4.03 | 1.60 | 3.16 | 60.30 | 21.59 | ||
| TiO2 | 0.07 | 0.26 | 0.34 | 271.43 | 385.71 | ||
| MnO | 0.53 | 0.16 | 0.32 | 69.81 | 39.62 | ||
| Fe2O3 | 1.04 | 1.51 | 2.27 | 45.19 | 118.27 | ||
| NiO | 0.02 | 0.08 | 0.10 | 300.00 | 400.00 | ||
| CuO | 0.08 | 0.16 | 0.29 | 100.00 | 262.50 | ||
| ZnO | 0.03 | 0.19 | 100.00 | 533.33 | |||
| BaO | 0.10 | 0.20 | 100.00 | 100.00 | |||
| Yb2O3 | 0.06 | 0.20 | 100.00 | 233.33 | |||
| Re2O7 | 0.20 | 0.60 | 100.00 | 200.00 | |||
| Eu2O3 | 0.20 | — | — | — | — | ||
Representative samples for each activating agent_
| Agent concentration (% w/v) | Activation time (h) |
|---|---|
| 15.00 | 7.17 |
| 10.00 | |
| 12.83 | |
| 7.93 | 8.00 |
| 10.00 | |
| 20.00 |
CCD factors and response_
| Run | Factor | Response | ||
|---|---|---|---|---|
| Concentration (% w/v) | Activation time (h) | Adsorption capacity (g/g) | ||
| KOH | NaOH | |||
| 1 | 10.00 | 8.00 | 0.1027 | 0.0751 |
| 2 | 10.00 | 12.00 | 0.0892 | 0.0751 |
| 3 | 15.00 | 7.17 | 0.1340 | 0.1607 |
| 4 | 15.00 | 10.00 | 0.1050 | 0.1328 |
| 5 | 15.00 | 10.00 | 0.1541 | 0.1338 |
| 6 | 15.00 | 10.00 | 0.1602 | 0.0938 |
| 7 | 15.00 | 10.00 | 0.1653 | 0.0947 |
| 8 | 15.00 | 10.00 | 0.1283 | 0.0923 |
| 9 | 15.00 | 12.83 | 0.2133 | 0.1347 |
| 10 | 20.00 | 8.00 | 0.0976 | 0.1946 |
| 11 | 20.00 | 12.00 | 0.2693 h | 0.0847 l |
| 12 | 7.93 | 8.00 | 0.0794 | 0.0672 |
| 13 | 22.07 | 10.00 | 0.1439 | 0.1267 |
Analysis of variance of activated carbon water vapor adsorption from RSM_
| Source | DF | KOH | NaOH | ||||||
|---|---|---|---|---|---|---|---|---|---|
| Adj SS | Adj MS | F-value | P-value | Adj SS | Adj MS | F-value | P-value | ||
| Model | 5 | 0.031 | 0.006 | 14.350 | 0.001* | 0.012 | 0.002 | 4.820 | 0.032** |
| Linear | 2 | 0.025 | 0.012 | 28.790 | 0.000* | 0.007 | 0.004 | 7.380 | 0.019* |
| X 1 | 1 | 0.012 | 0.012 | 27.640 | 0.001* | 0.004 | 0.004 | 8.020 | 0.025* |
| X 2 | 1 | 0.010 | 0.010 | 22.250 | 0.002* | 0.004 | 0.004 | 8.720 | 0.021* |
| Square | 2 | 0.006 | 0.003 | 6.460 | 0.026* | 0.003 | 0.001 | 2.700 | 0.135** |
| X 1 2 | 1 | 0.004 | 0.004 | 9.130 | 0.019* | 0.001 | 0.001 | 1.330 | 0.287** |
| X 2 2 | 1 | 0.002 | 0.002 | 4.610 | 0.069** | 0.002 | 0.002 | 4.370 | 0.075** |
| Two-way interaction | 1 | 0.010 | 0.010 | 22.920 | 0.002* | 0.002 | 0.002 | 3.160 | 0.118** |
| X 1 X 2 | 1 | 0.010 | 0.010 | 22.920 | 0.002* | 0.002 | 0.002 | 3.160 | 0.118** |
| Error | 7 | 0.003 | 0.000 | 0.004 | 0.001 | ||||
| Lack-of-fit | 3 | 0.000 | 0.000 | 0.240 | 0.865** | 0.002 | 0.001 | 1.160 | 0.427** |
| Pure error | 4 | 0.003 | 0.001 | 0.002 | 0.000 | ||||
| Total | 12 | 0.034 | 0.016 | ||||||
| R 2 | 0.911 | 0.765 | |||||||
CCD on activation of RHC using KOH and NaOH_
| Run | Factor | ||||
|---|---|---|---|---|---|
| Concentration (% w/v) | Activation time (h) | ||||
| 1 | 10.00 | 8.00 | |||
| 2 | 10.00 | 12.00 | |||
| 3 | 15.00 | 7.17 | |||
| 4 | 15.00 | 10.00 | |||
| 5 | 15.00 | 10.00 | |||
| 6 | 15.00 | 10.00 | |||
| 7 | 15.00 | 10.00 | |||
| 8 | 15.00 | 10.00 | |||
| 9 | 15.00 | 12.83 | |||
| 10 | 20.00 | 8.00 | |||
| 11 | 20.00 | 12.00 | |||
| 12 | 7.93 | 8.00 | |||
| 13 | 22.07 | 10.00 | |||
| Factor and experimental range | |||||
| Variable | −α | −1 | 0 | +1 | +α |
| Concentration (% w/v) | 7.93 | 10.00 | 15.00 | 20.00 | 22.07 |
| Activation time (hour) | 7.17 | 8.00 | 10.00 | 12.00 | 12.83 |
Surface area, pore radius, and pore volume of samples_
| Sample | Surface area (m2/g) | Average pore radius (nm) | Pore volume (cm3/g) |
|---|---|---|---|
| RHC | 25.88 | 3.14 | 0.04 |
| ACK | 138.86 | 2.93 | 0.20 |
| ACNa | 45.80 | 3.20 | 0.07 |