Intercept of polynomial equation from CCD Linear coefficients for factor 1 in CCD Linear coefficients for factor 2 in CCD Coefficient presenting an interaction between the two factors Water activity BET constant Adsorption model constant Freundlich constant Langmuir constant Monolayer adsorption Adsorption intensity from Freundlich isotherm model Equilibrium moisture content Adsorption capacity at a time FHH constant Adsorption time Response of central composite design (CCD)
Dehumidification, which is the process of removing moisture from the air (humidity), is an important process in many industries and applications. Dehumidification is frequently required to protect the quality and security of products and equipment to prevent corrosion, mold growth, and other issues. Two common methods in dehumidification are condensation and adsorption [1]. In the condensation method, the air is cooled down until it condenses and then heated to produce warm and dry air. Although the energy used can be recycled, this method is energy-intensive and is considered less efficient than the adsorption method [2]. The adsorption method utilizes hygroscopic materials (desiccants) to remove moisture from the air and to control the humidity [3]. Desiccant consists of solid desiccants such as silica gel, zeolite, and activated carbon, and liquid desiccants such as calcium chloride (CaCl2) and lithium chloride (LiCl). According to Naik et al. [4], liquid desiccants are more suitable for air conditioning dehumidification systems than solid desiccants because of their higher condensation rate and moisture removal efficiency. Besides, solid desiccants are more applicable in the drying system because of a higher outlet temperature. In addition, solid desiccants are easier to handle and less reactive than liquid ones [5].
Research on solid desiccant performance was conducted in a food drying system [6]. However, the research did not display the effect of desiccant on moisture removal. This issue was then discussed by a further study that compared the conventional onion drying and zeolite desiccant-assisted drying process [7]. The results showed that the product was successfully dried 0.4 times faster through zeolite-assisted drying compared to direct sun and conventional drying. The application of silica gel desiccant to agricultural drying was also examined [8]. Based on the study, drying with silica gel preserved the physical quality of rice and consumed less energy. Although effective as desiccants, commercial adsorbents require proper handling when disposed of because they are potentially dangerous to the environment and humans. Therefore, several studies produced biomass-based activated carbon as an alternative desiccant [9,10]. It was found that the adsorption capacity of the produced activated carbons was more than 0.4 g water vapor/g activated carbon. At this capacity, the desiccant can reduce the relative humidity up to 70% in the low-temperature process and thus fasten the drying process. Because of its competitive adsorption capacity, the utilization of natural-based activated carbon as a desiccant contributes to reducing raw material costs and commercial adsorbent waste. Also, activated carbon is more promising as a desiccant due to its oxidized functional groups and high durability [11].
Several studies have reported the performance of activated carbons derived from diverse biomass sources. Li et al. [12] synthesized activated carbon from coconut coir via a one-step NaOH activation route, achieving a specific surface area of 1,069 m2/g and a maximum phenol adsorption capacity of 0.3 g/g. Moisture adsorption performance using biomass-derived carbon was reported by Zhao et al. [13], who utilized walnut shell to produce a highly microporous activated carbon with a surface area of 1,228 m2/g and a water adsorption capacity of 0.38 g/g. However, its preparation required elevated temperatures (700–900°C) and yielded only 26.53%. Another study used cajuput twigs as a novel precursor, employing a lower-temperature carbonization process (400°C) [9]. The resulting activated carbon exhibited strong affinity toward water vapor, reaching up to 0.4 g/g within a short activation duration. Despite its promising performance, cajuput biomass is not widely available, making large-scale production challenging. These studies demonstrate excellent adsorption properties of biomass-based activated carbon as an adsorbent. Nevertheless, there are limitations, such as high energy requirements, low mass yield, or low availability. Therefore, it is necessary to develop other source with high porosity, yield, and availability.
Rice husk is a widely known precursor for activated carbon because of its high porosity, high carbon content [14], and abundance in nature. In Indonesia, a large production of rice grain causes a large amount of waste. According to Araque et al., husk in rice can be up to 20–23% of total rice weight [15]. In 2024, rice production in Indonesia was about 53.14 million tons, and about 10.63–12.22 million tons of rice husk were generated [16]. This can be a problem for farmers and the community because of the accumulation of husk waste with limited disposal places. Utilizing rice husk as a desiccant source is an excellent alternative to address this issue. Moreover, rice husk inherent silica-based structure and intercellular layers that facilitate the development of a well-defined porous structure [17]. Thus, rice husk needs to be activated to enhance the porosity [18].
The activation process of rice husk carbon (RHC) uses activating agent solutions such as potassium hydroxide (KOH) and sodium hydroxide (NaOH) to remove the silica content and increase the carbon purity. Muniandy et al. [19] investigated the impact of activating agents, activation temperature, time, and gas flow on the pore structure of rice husk-activated carbon. The research found that activating RHC using KOH at a temperature of more than 750°C under nitrogen flow produced the highest surface area and porosity product. Saputra et al. [20] demonstrated the effectiveness of KOH and urea activation in enhancing the porosity of rice husk-activated carbon, which is potential for direct air capture application. Romero-Hernandez et al. [18] focused on evaluating the behavior of rice husk-activated carbon as a pharmaceutical adsorbent. Using NaOH as the activating agent, the activated carbon possessed macroporous structure with surface area in the range of 106–1,671 m2/g.
Mostly, previous studies have carbonized rice husk at high temperatures (500–800°C) [21,22], which involves an intensive energy process. This work removed the physical activation process, by means of high-temperature carbonization, utilizing industrial RHC as the activated carbon precursor. Moreover, the activation was conducted under low-temperature conditions using KOH and NaOH, enabling a more energy-efficient process. In addition, prior research mainly reported the application of rice husk-based adsorbent for pollutant adsorption [17,23,24], while this research specified its application as a desiccant. This work applied response surface methodology (RSM) to evaluate the effect of activating-agent concentration and activation time on water vapor adsorption.
The RHC was bought from a local shop in Pedurungan, Semarang, Central Java, Indonesia. RHC was sieved and washed with distilled water to remove impurities before being processed in an oven at 110°C until dry. This experiment used potassium hydroxide (≥85% Merck, Germany), sodium hydroxide (≥97% Merck, Germany), nitric acid (65% Merck, Germany), and distilled water (UPT Lab. Terpadu, Universitas Diponegoro, Semarang, Central Java).
The experimental design was generated based on central composite design (CCD) RSM using Minitab® (Minitab LLC., USA). Activating agent concentration (X 1) and activation time (X 2) were selected as the factors and water vapor adsorption capacity was selected as the response (Y). KOH and NaOH were the activating agents for activating the RHC. Table 1 shows the detailed experimental design and range of the factors. The factor level consists of alpha, low, center, and high values, represented as α, −1, 0, and +1. The distance between the axial and center point is defined as α, which is the fourth square root of runs of experiments [25]. In this experiment, the activating agent concentration and activation time were in the range of 10.00–20.00% w/v and 8.00–12.00 h, respectively. Previous works have shown that carbon activation within this range produced samples with water vapor adsorption capacities of approximately 0.25–0.42 g/g, comparable with commercial desiccants [10].
CCD on activation of RHC using KOH and NaOH.
| Run | Factor | ||||
|---|---|---|---|---|---|
| Concentration (% w/v) | Activation time (h) | ||||
| 1 | 10.00 | 8.00 | |||
| 2 | 10.00 | 12.00 | |||
| 3 | 15.00 | 7.17 | |||
| 4 | 15.00 | 10.00 | |||
| 5 | 15.00 | 10.00 | |||
| 6 | 15.00 | 10.00 | |||
| 7 | 15.00 | 10.00 | |||
| 8 | 15.00 | 10.00 | |||
| 9 | 15.00 | 12.83 | |||
| 10 | 20.00 | 8.00 | |||
| 11 | 20.00 | 12.00 | |||
| 12 | 7.93 | 8.00 | |||
| 13 | 22.07 | 10.00 | |||
| Factor and experimental range | |||||
| Variable | −α | −1 | 0 | +1 | +α |
| Concentration (% w/v) | 7.93 | 10.00 | 15.00 | 20.00 | 22.07 |
| Activation time (hour) | 7.17 | 8.00 | 10.00 | 12.00 | 12.83 |
According to the response from RSM, the polynomial equation was generated to find a model that describes this research. The correlation between factors and response is shown in equation (1).
RHC was first cleaned with distilled water and crushed to obtain a uniform particle size. The cleaned carbon was then mixed with activating agent solution at a mass-to-volume ratio of 1:6 under ambient temperature (25°C). Different activating agent concentration and activation time were applied according to the CCD in Table 1. All spent activating agent solutions were neutralized with diluted HCl until reaching neutral pH, followed by proper disposal in accordance with the laboratory’s chemical-waste handling procedures.
After the activation, carbon was filtered and washed with 1 M nitric acid and distilled water until pH neutral (pH 7). The sample was dried in an oven at 110°C until it reached a constant mass. Finally, the dried activated carbon was sieved to 200-mesh sieve. The schematic illustration of preparing the rice husk-based activated carbon is shown in Figure 1.
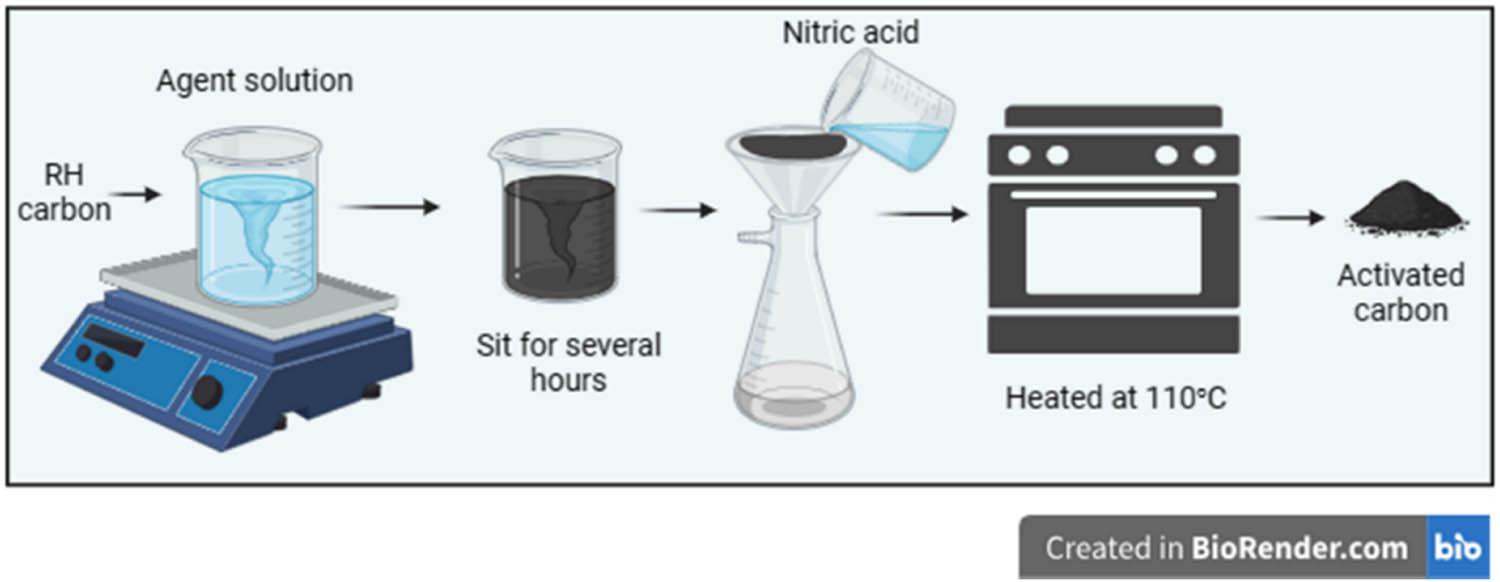
Illustration of activated carbon preparation.
The adsorption test of the samples was conducted in a closed jar filled with 100 mL KOH solution at an average relative humidity of 80.45% ± 2.68% (water activity of 0.80) and temperature of 19.94 ± 0.51°C (T-RH meter, Limited Company of KRISBOW Indonesia). Before the adsorption test, samples were dried in an oven at 110°C for 2 h to remove the water content. The test is a gravimetric test, where samples were weighed every 24 h until constant. Water vapor adsorption capacity is the difference between the final and initial mass of the activated carbon. The adsorption kinetic analysis was conducted to investigate the effect of activating agent concentrations and activation times for six representative samples of each agent (Table 2). In addition, the adsorption kinetic analysis was conducted for RHC, KOH-treated activated carbon (ACK), and NaOH-treated activated carbon (ACNa). Experimental water vapor adsorption data were fitted and evaluated using four models, which were pseudo firs-, pseudo second-order, Boyd’s external diffusion, and Weber-Morris intraparticle diffusion with equations shown in Table 3. The plot of adsorption capacity (q t) and adsorption time (t) was generated to find the maximum adsorption capacity or equilibrium moisture content (q e) and model constant (k). Particularly, linear regression was applied for Weber–Morris model, due to its accuracy in the adsorption stages [26]. The model constant is also divided according to the number of the stage (first stage as k WM1, second stage as k WM2, and third stage as k WM3) and addition of Intercept, I.
Representative samples for each activating agent.
| Agent concentration (% w/v) | Activation time (h) |
|---|---|
| 15.00 | 7.17 |
| 10.00 | |
| 12.83 | |
| 7.93 | 8.00 |
| 10.00 | |
| 20.00 |
| Equation | ||
|---|---|---|
| Adsorption kinetics models | Pseudo-first-order |
|
| Pseudo-second-order |
| |
| Diffusion models | Boyd’s external diffusion |
|
| Weber–Morris intraparticle diffusion |
| |
Water vapor sorption isotherm represents the relationship between equilibrium moisture content and water activity (a w). In this research, the adsorption isotherm was examined by following previous studies by Luthra et al. [29] and Remington et al. [30]. The activated carbon was placed in a closed jar filled with KOH solution at a certain concentration. Different water activities were obtained by varying the concentration of KOH solutions in the jar. Afterward, a comparison was carried out between the water vapor adsorption from the experimental results and the various moisture adsorption isotherm models displayed in Table 4.
Water vapor adsorption isotherm models in this research.
| Isotherm model | Formula | Parameters |
|---|---|---|
| Freundlich [31] |
| k f = Freundlich constant |
| n f = adsorption intensity | ||
| Langmuir [32] |
| k L = Langmuir constant |
| m 0 = monolayer adsorption | ||
| BET (Brunauer, Emmett, and Teller) [33] |
| c B = BET constant |
| FHH (Frenkel-Halsey-Hill) [31] |
| r = FHH constant |
RHC and activated carbon with different activating agents were characterized using several methods. The morphology and element composition of samples were analyzed using a Scanning electron microscope with energy dispersive X-ray at 20 kV (SEM-EDX, FEI Inspect S50, FEI Company). X-ray Fluorescence Spectrometry (XRF Panalytical Minipal 4, Malvern Panalytical Ltd) was used to identify the content of other elements in the samples. Surface area and porosity of the samples were analyzed using nitrogen adsorption–desorption at 77.35 K (Quantachrome Instruments version 3.01). Prior to analysis, all samples were degassed at 300°C for 3 h under vacuum to remove moisture and adsorbed gases. Specific surface area was determined using the BET method, while pore size distribution was obtained using Barrett-Joyner-Halenda (BJH) method. Micropore volume and surface area were evaluated using the t-plot method.
The experimental results of CCD are exhibited in Table 5. Based on the response, second-order polynomial models were generated in terms of uncoded factors (actual values) for KOH and NaOH activated carbon (Y
KOH and Y
NaOH), which can be written in equations (2) and (3).
CCD factors and response.
| Run | Factor | Response | ||
|---|---|---|---|---|
| Concentration (% w/v) | Activation time (h) | Adsorption capacity (g/g) | ||
| KOH | NaOH | |||
| 1 | 10.00 | 8.00 | 0.1027 | 0.0751 |
| 2 | 10.00 | 12.00 | 0.0892 | 0.0751 |
| 3 | 15.00 | 7.17 | 0.1340 | 0.1607 |
| 4 | 15.00 | 10.00 | 0.1050 | 0.1328 |
| 5 | 15.00 | 10.00 | 0.1541 | 0.1338 |
| 6 | 15.00 | 10.00 | 0.1602 | 0.0938 |
| 7 | 15.00 | 10.00 | 0.1653 | 0.0947 |
| 8 | 15.00 | 10.00 | 0.1283 | 0.0923 |
| 9 | 15.00 | 12.83 | 0.2133 | 0.1347 |
| 10 | 20.00 | 8.00 | 0.0976 | 0.1946 |
| 11 | 20.00 | 12.00 | 0.2693 h | 0.0847 l |
| 12 | 7.93 | 8.00 | 0.0794 | 0.0672 |
| 13 | 22.07 | 10.00 | 0.1439 | 0.1267 |
h = highest adsorption capacity.
l = lowest adsorption capacity.
According to equation (2), the linear coefficients for KOH activation are negative (A 1 = −0.007 and A 2 = −0.1392), indicating a lower adsorption capacity as the concentration and activation time increase. Although individual factors decrease the response, a positive coefficient of A 22 indicates that a long activation time enhances the adsorption capacity. In addition, the positive interaction term (A 12 = +0.0046) shows that simultaneous increases in KOH concentration and activation time contribute to improving adsorption performance. Different from KOH, coefficient of activation time of NaOH is positive (A 1 = +0.357, equation (3)), expressing an increase in adsorption capacity at a longer activation time. However, the negative interaction of two factors (A 12 = −0.0018) describes that simultaneous changes in NaOH concentration and activation time led to decreases in adsorption capacity.
Equations (2) and (3) can be used to predict the response at various X 1 and X 2 with values shown in Table 1. The analysis of variance and statistical parameters can be seen in Table 6. It can be observed that R 2 of KOH activation is higher than NaOH activation, representing a better fit between the data of the experiment and the model. Furthermore, in the KOH activation, the concentration (X 1), activation time (X 2), squared concentration (X 1 2), and interaction of concentration-time (X 1 X 2) significantly affected the adsorption capacity (P-value <0.05). On the other side, in the NaOH activation, only concentration (X 1) and activation time (X 2) significantly affected the adsorption capacity (P-value <0.05), while the interaction of concentration-time (X 1 X 2) had no significant effect on the water vapor adsorption. This insignificant effect suggests that NaOH activation process was predominantly controlled by individual factors, either the NaOH concentration or activation time, and no effect of simultaneous changes in both factors. Figure 2 presents a comparison between the experimental and predicted data (model) of water vapor adsorption of rice husk-based activated carbons.
Analysis of variance of activated carbon water vapor adsorption from RSM.
| Source | DF | KOH | NaOH | ||||||
|---|---|---|---|---|---|---|---|---|---|
| Adj SS | Adj MS | F-value | P-value | Adj SS | Adj MS | F-value | P-value | ||
| Model | 5 | 0.031 | 0.006 | 14.350 | 0.001* | 0.012 | 0.002 | 4.820 | 0.032** |
| Linear | 2 | 0.025 | 0.012 | 28.790 | 0.000* | 0.007 | 0.004 | 7.380 | 0.019* |
| X 1 | 1 | 0.012 | 0.012 | 27.640 | 0.001* | 0.004 | 0.004 | 8.020 | 0.025* |
| X 2 | 1 | 0.010 | 0.010 | 22.250 | 0.002* | 0.004 | 0.004 | 8.720 | 0.021* |
| Square | 2 | 0.006 | 0.003 | 6.460 | 0.026* | 0.003 | 0.001 | 2.700 | 0.135** |
| X 1 2 | 1 | 0.004 | 0.004 | 9.130 | 0.019* | 0.001 | 0.001 | 1.330 | 0.287** |
| X 2 2 | 1 | 0.002 | 0.002 | 4.610 | 0.069** | 0.002 | 0.002 | 4.370 | 0.075** |
| Two-way interaction | 1 | 0.010 | 0.010 | 22.920 | 0.002* | 0.002 | 0.002 | 3.160 | 0.118** |
| X 1 X 2 | 1 | 0.010 | 0.010 | 22.920 | 0.002* | 0.002 | 0.002 | 3.160 | 0.118** |
| Error | 7 | 0.003 | 0.000 | 0.004 | 0.001 | ||||
| Lack-of-fit | 3 | 0.000 | 0.000 | 0.240 | 0.865** | 0.002 | 0.001 | 1.160 | 0.427** |
| Pure error | 4 | 0.003 | 0.001 | 0.002 | 0.000 | ||||
| Total | 12 | 0.034 | 0.016 | ||||||
| R 2 | 0.911 | 0.765 | |||||||
*Significant at 0.05.
**Not Significant at 0.05.
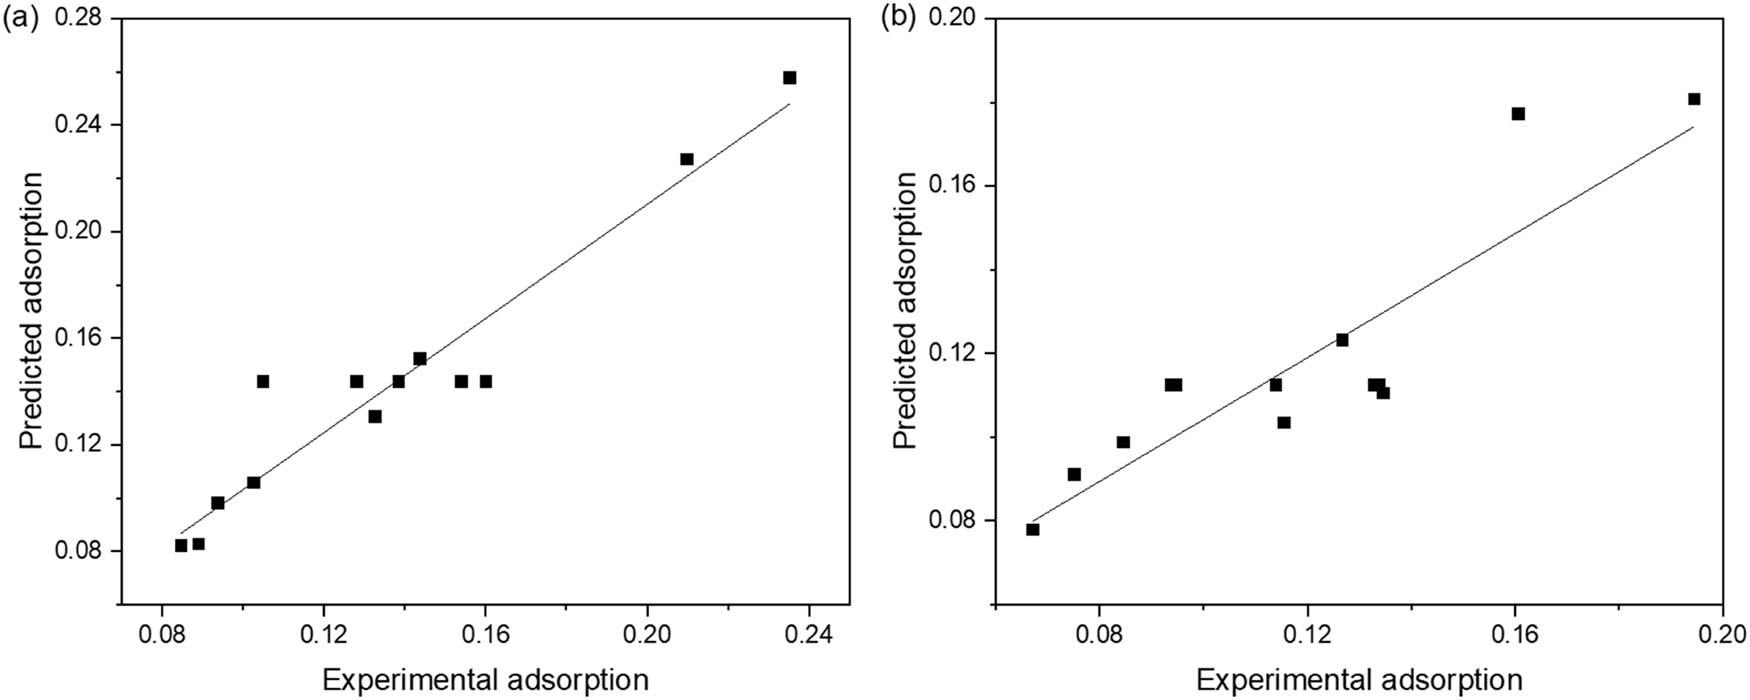
Comparison between the predicted data (model) from RSM and experimental data for (a) KOH and (b) NaOH.
The relationship between concentration and activation time on the adsorption capacity is demonstrated in Figure 3. Different relationships are found in different activating agents. In KOH activation, the adsorption capacity increases when concentration and activation times increase. Meanwhile, in the NaOH activation, the adsorption capacity increased with increasing concentration and decreasing activation time. It was also discovered that the maximum adsorption capacity of KOH-activated carbon was higher than NaOH. According to Muniandy et al. [19], activating RHC using KOH produced more pores and larger pore volume than NaOH, resulting in higher porosity and surface area. The optimum conditions to obtain maximum adsorption capacity for KOH and NaOH according to RSM are presented in Table 7. These conditions were used to prepare activated carbon for further analysis. This statement has been mentioned in subsection 2.4. The predicted adsorption capacity of ACK is comparable with date kernels-based desiccant [34] but still lower than cajuput biomass-based desiccant [9].
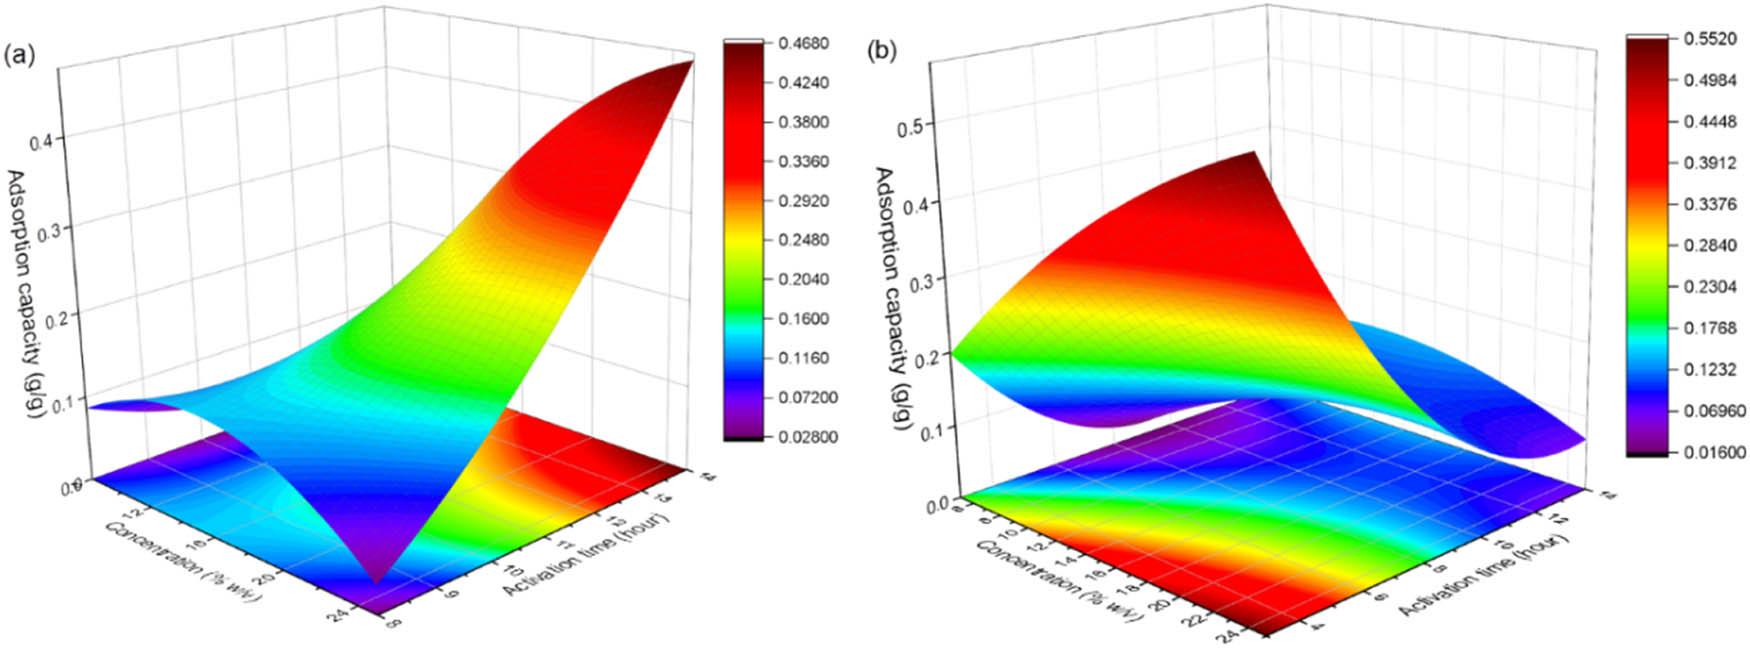
3D surface plot of adsorption capacity of rice husk-based activated carbon prepared using (a) KOH and (b) NaOH.
Optimum conditions for preparing activated carbon from rice husk using activating agents of KOH and NaOH.
| Activating agent | Concentration (% w/v) | Activation time (h) | Adsorption capacity (g/g) | Composite desirability |
|---|---|---|---|---|
| KOH | 22.07 | 12.83 | 0.32 | 1 |
| NaOH | 22.07 | 7.17 | 0.23 | 1 |
The morphology and elemental composition of RHC and activated carbon (ACK and ACNa) are illustrated in Figure 4. Samples consist of irregular shapes and microstructure porous on their surface. Activated carbon surface is responsible for water vapor adsorption. Based on Figure 4, the activation using KOH and NaOH degraded the carbon bulk into smaller particle sizes. Before activation, RHC mostly consisted of bulk in the micrometer dimension with a pore size of 1.5–7.1 μm. After being activated using KOH (Figure 4c), the pore size decreases to 0.5–3.3 μm. This activated carbon had an average particle and pore size smaller than ACNa (Figure 4e). The difference in morphology of activated carbon was caused by the difference in activation times, in which KOH activation took a longer activation time than NaOH (Table 7). The particle size of the activated carbon in this work is comparable with commercial activated carbon [35].
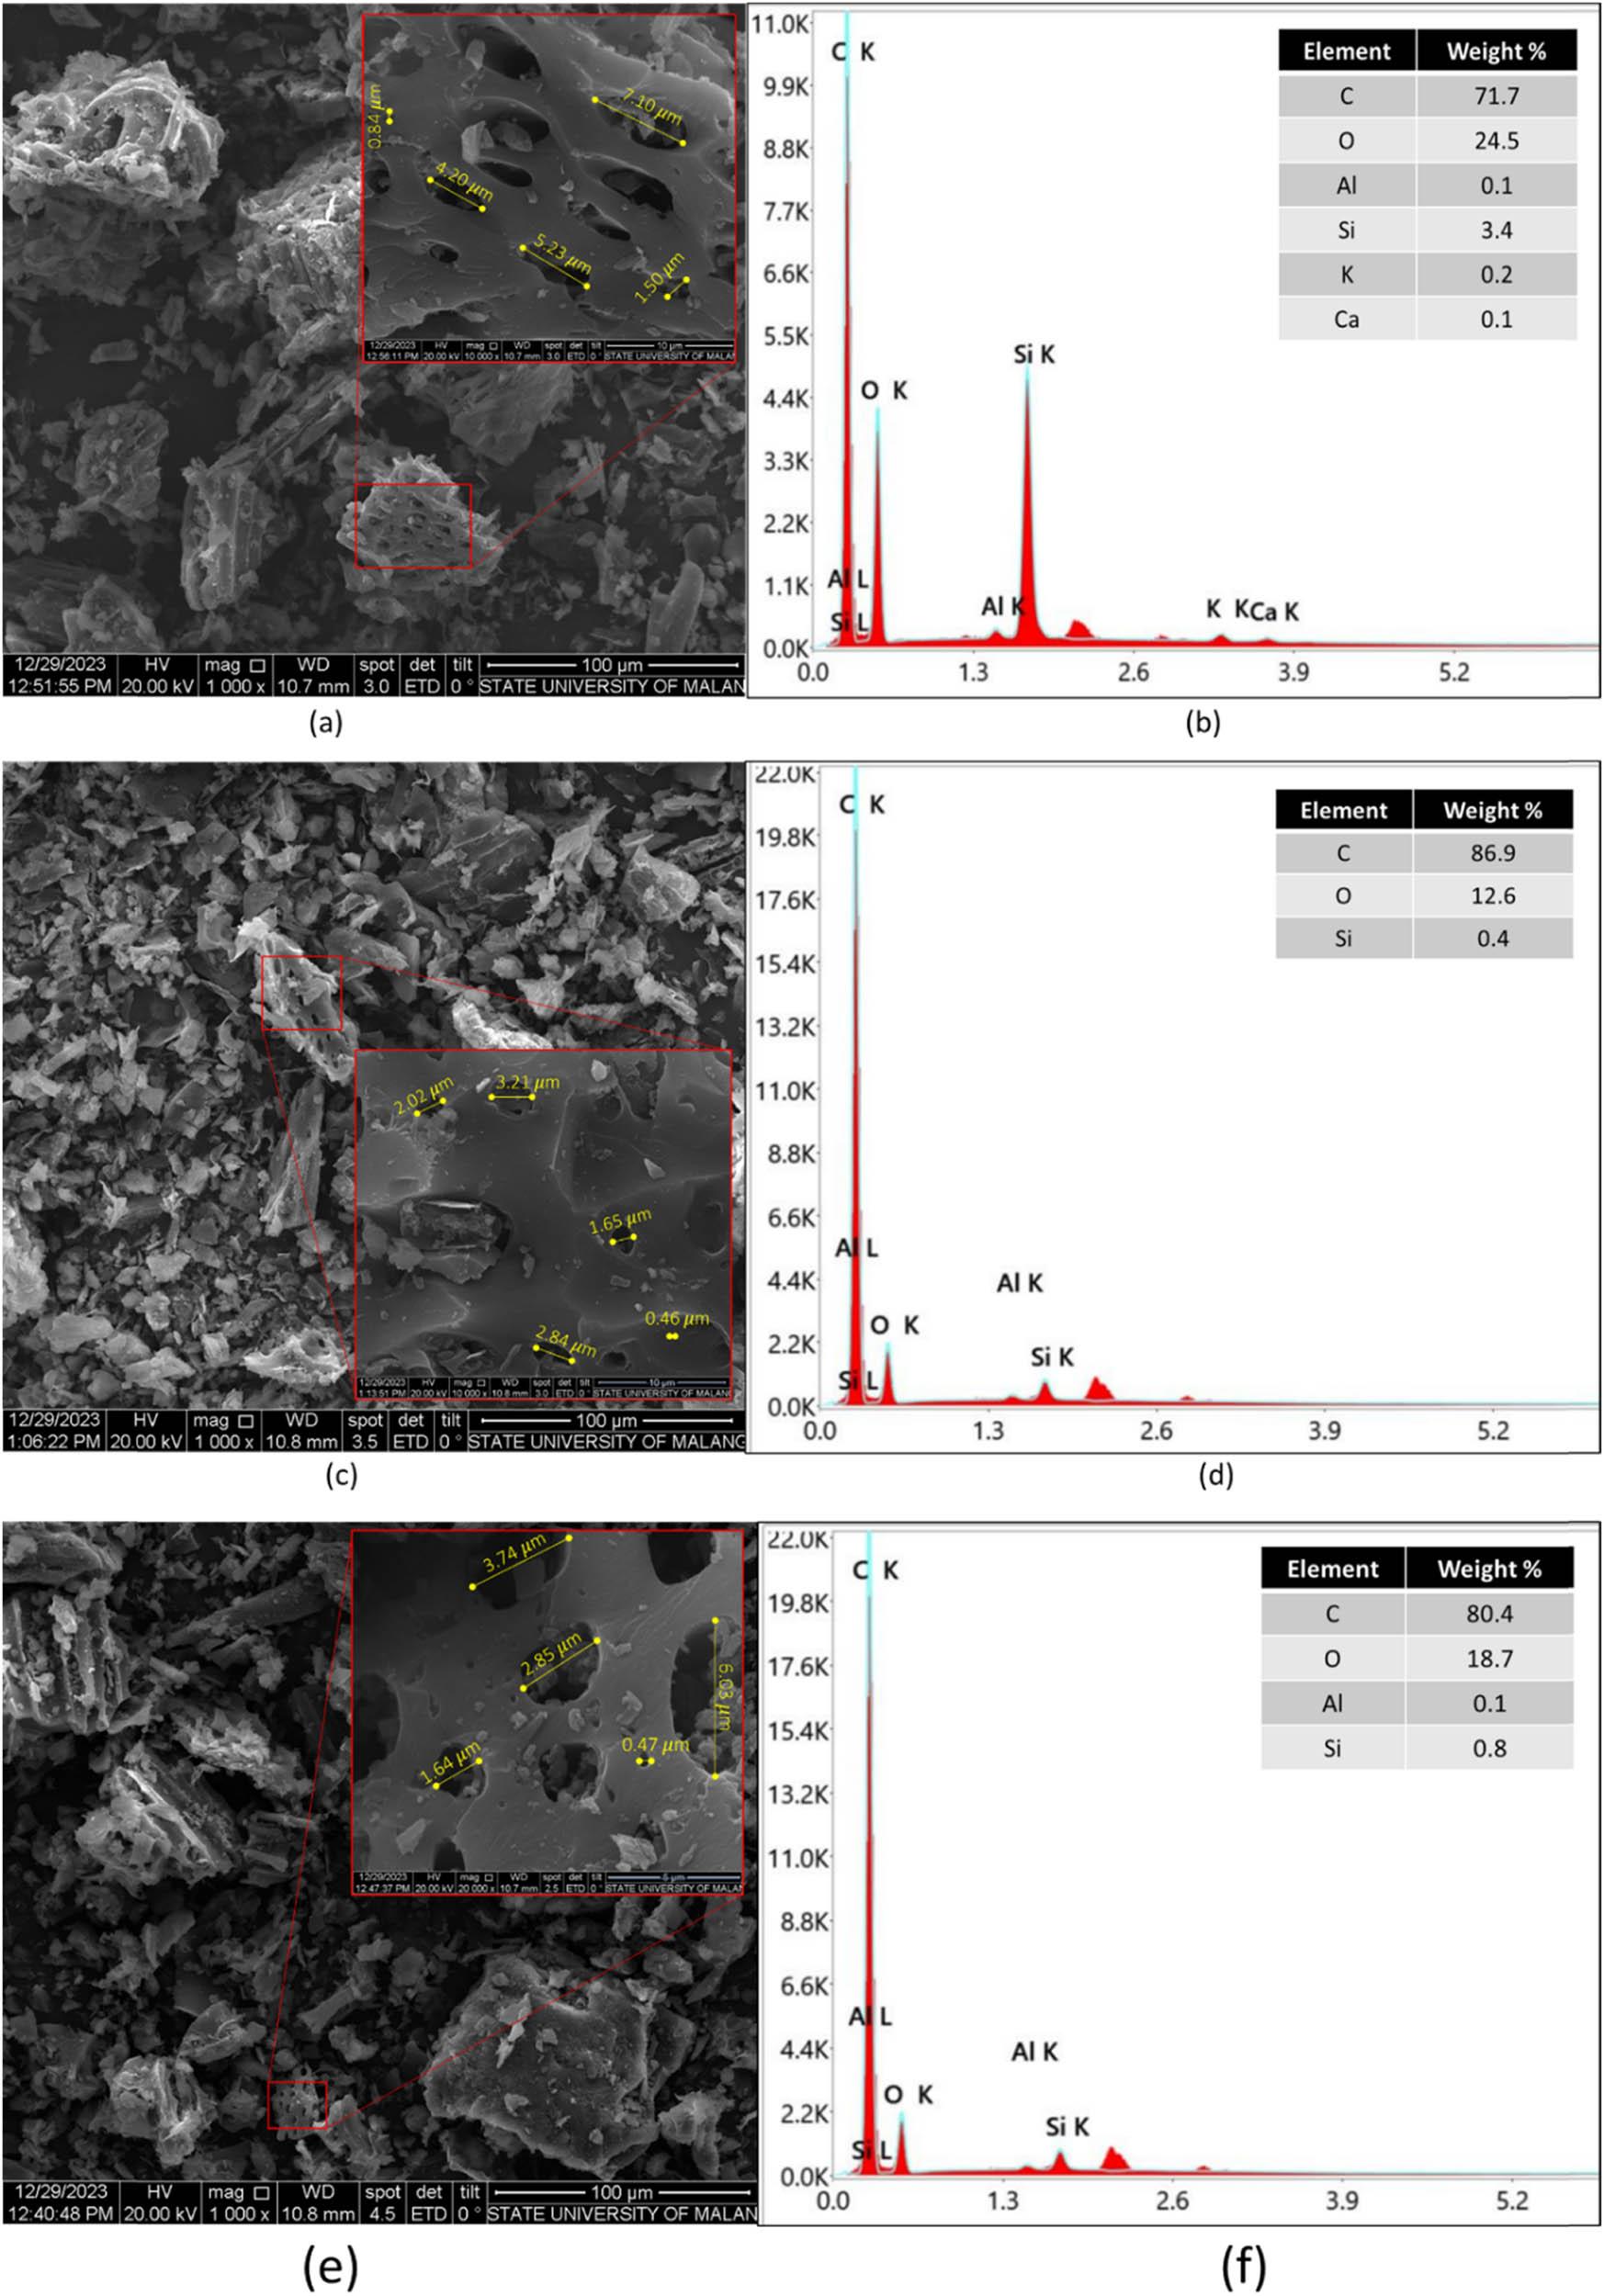
SEM and EDX analysis of RHC (a and b), ACK (c and d), and ACNa (e and f).
Surface morphology images (Figure 4) indicate that all samples had a macroporous structure. Similar irregular shapes and large pores were found after activating RHC using KOH at a high temperature [36,37]. According to previous studies [36,38], increasing the activating agent concentration increased the activated pore size. This phenomenon occurred because of the gas generation from KOH and carbon reactions.
Figure 4(b, d, and f) also represents the EDX results of RHC and activated carbon. RHC contains carbon, silica (SiO2), and other metal oxides. Following the activation, the impurity was cleaned, and the carbon content increased to more than 80%. It is higher than RHC activated by NaOH with a carbon percentage of 69.02% [39]. This confirms that industrially produced RHC is a promising source due to its high carbon content, consistent with previous findings that industrial carbonization yields a higher carbon fraction compared to laboratory-burned rice husks [36,39]. In addition, the KOH activation in this research yielded 62% of activated carbon from industrial RHC. This relatively high yield compared with raw-husk activation reported in literature (6–17%) is attributed to the fact that the precursor was already carbonized [19,21].
Based on the EDX result, ACK had the highest carbon content due to its longer activation time, which degraded more impurities. Compared with RHC, ACK and ACNa show complete removal of Al, K, and Ca, and 76–88% of Si content. This is consistent with XRF data (Table 8), which represents majority components of P2O5, K2O, CaO, and Fe2O. Initially, RHC contains a high amount of potassium (K) as an impurity, at 4.52%. This component is extensively leached during the activation process, with about 80–85% of removal. A similar impact of activation is observed for CaO and MnO contents, which are reduced by 21–60% and 40–70%, respectively. On the other hand, the increase in other impurities (P2O5, TiO2, Fe2O3, etc.) is a result of their higher relative concentration after the removal of the more soluble components.
Chemical composition of RHC and activated carbon.
| Compound | Composition (%) | Reduction (%) | Increase (%) | ||||
|---|---|---|---|---|---|---|---|
| RHC | ACK | ACNa | ACK | ACNa | ACK | ACNa | |
| SiO2 | 87.00 | 92.70 | 87.70 | 6.55 | 0.80 | ||
| P2O5 | 2.20 | 2.70 | 3.80 | 22.73 | 72.73 | ||
| K2O | 4.52 | 0.67 | 0.88 | 85.18 | 80.53 | ||
| CaO | 4.03 | 1.60 | 3.16 | 60.30 | 21.59 | ||
| TiO2 | 0.07 | 0.26 | 0.34 | 271.43 | 385.71 | ||
| MnO | 0.53 | 0.16 | 0.32 | 69.81 | 39.62 | ||
| Fe2O3 | 1.04 | 1.51 | 2.27 | 45.19 | 118.27 | ||
| NiO | 0.02 | 0.08 | 0.10 | 300.00 | 400.00 | ||
| CuO | 0.08 | 0.16 | 0.29 | 100.00 | 262.50 | ||
| ZnO | 0.03 | 0.19 | 100.00 | 533.33 | |||
| BaO | 0.10 | 0.20 | 100.00 | 100.00 | |||
| Yb2O3 | 0.06 | 0.20 | 100.00 | 233.33 | |||
| Re2O7 | 0.20 | 0.60 | 100.00 | 200.00 | |||
| Eu2O3 | 0.20 | — | — | — | — | ||
Silica removal is a well-known effect of alkaline activation, as SiO2 reacts with KOH and NaOH to form soluble silicates as expressed in equations (4) and (5) [40,41].
The silica was dissolved during acid washing and thus cleaned the carbon pores from other materials. This explains the small presence of silica content in the activated carbons. Although some silica remains, it is assumed that silica did not reduce the adsorption capacity of the resulting adsorbent because of its capability to adsorb moisture [40].
Surface area and pore size distribution of RHC, ACK, and ACNa were measured using N2 adsorption–desorption (Figure 5). The adsorption–desorption curves (Figure 5a) correspond to type II adsorption isotherm (IUPAC Classification), indicating monolayer-multilayer adsorption on either nonporous or microporous materials [42]. The initial gradual curvature (knee at P/P 0 ∼ 0.3–0.4) suggests simultaneous monolayer and multilayer adsorption. Additionally, the adsorption–desorption curves display an open-loop hysteresis, signifying capillary condensation and the presence of mesopores. The hysteresis follows the H3 type, which is associated with macropores that are not entirely filled with pore condensate [42].
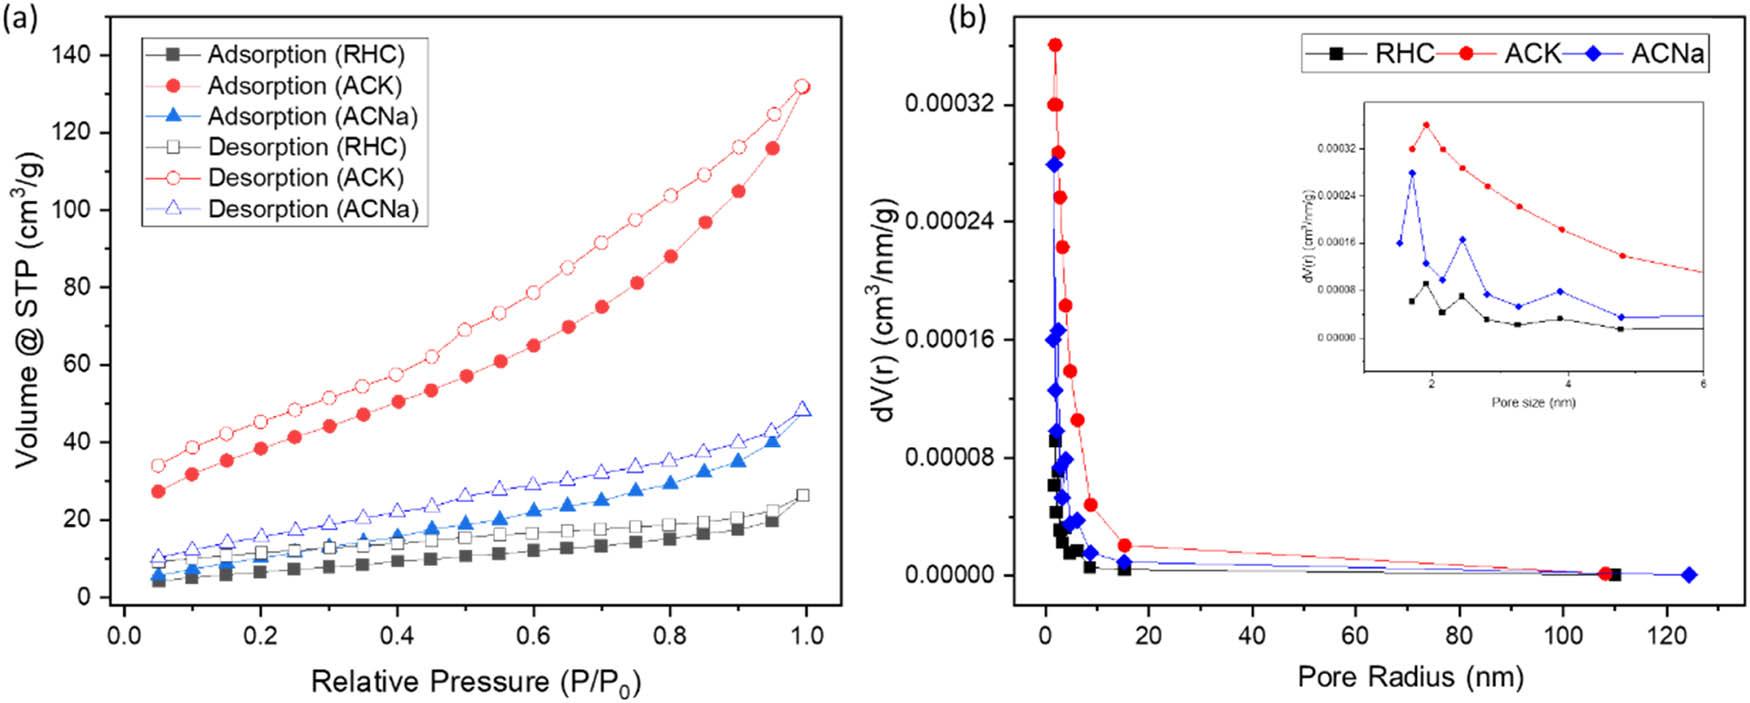
(a) N2 adsorption–desorption and (b) pore size distribution of samples.
The pore size distribution of samples was calculated based on the BJH model (Figure 5b). RHC and ACNa contain multiple peaks of pore size, representing heterogeneous pore size. Meanwhile, ACK consists of more homogeneous and smaller pore sizes. Based on the curves, the pore radius of all samples is in the range of 1.5–4.0 nm. This result indicates that the produced-activated carbon was mesoporous (pore size of 2–50 nm). Studies have shown a good performance of mesopore materials as water vapor adsorbents [43,44]. Mesopore adsorbents can improve water vapor accessibility, accommodate multilayer adsorption, and allow capillary condensation.
The results are summarized in Table 9, showing that ACK had the highest surface area and pore volume, five times higher than RHC. In correlation with SEM-EDX results, the surface area and pore volume of ACK were higher because of its smaller particle and pore sizes. The surface area of activated carbon in this study is still low (138.86 m2/g) compared to that in previous studies [36,37,45,46]. Prior studies using alkali combined high-temperature activation or carbonization, resulting in higher surface areas, such as 413–755 m2/g for KOH-activated rice husk biochar at 400–600°C [36], 332.81–2005.90 m2/g for gas-alkali combined activation at high temperatures (750–850°C) [37,45,46]. The main difference between this study and previous studies is the absence of high-temperature activation to reduce energy consumption. As presented by Phothong et al. [47], specific surface area increased linearly as the activation temperature rose from 850 to 950°C, reporting that the addition of thermal energy was effectively removing carbon atoms and developing a larger porous structure. Nevertheless, considering the source was from industrial combustion, this research managed to produce activated carbon with a much larger surface area and higher pore volume than the raw material through a facile process.
Surface area, pore radius, and pore volume of samples.
| Sample | Surface area (m2/g) | Average pore radius (nm) | Pore volume (cm3/g) |
|---|---|---|---|
| RHC | 25.88 | 3.14 | 0.04 |
| ACK | 138.86 | 2.93 | 0.20 |
| ACNa | 45.80 | 3.20 | 0.07 |
Water vapor adsorption of activated carbon was observed to find the maximum adsorption capacity or the equilibrium moisture content, q e. Figure 6 displays the water uptake of samples. The results indicate that the adsorption processes occurred in a similar process. At first, water vapors were adsorbed onto the adsorbent surface rapidly due to the vacancy of the adsorbent pores or adsorption sites (Figure 7). Secondly, the sites were almost fully occupied resulting in a lower adsorption rate. Eventually, when the sites were full of adsorbate, the vapor uptake became constant. The steps of this mechanism were stated by Wang and Guo [32], describing that the adsorption consists of three steps of mass transfer, which are external diffusion, internal diffusion, and adsorption in the active sites.
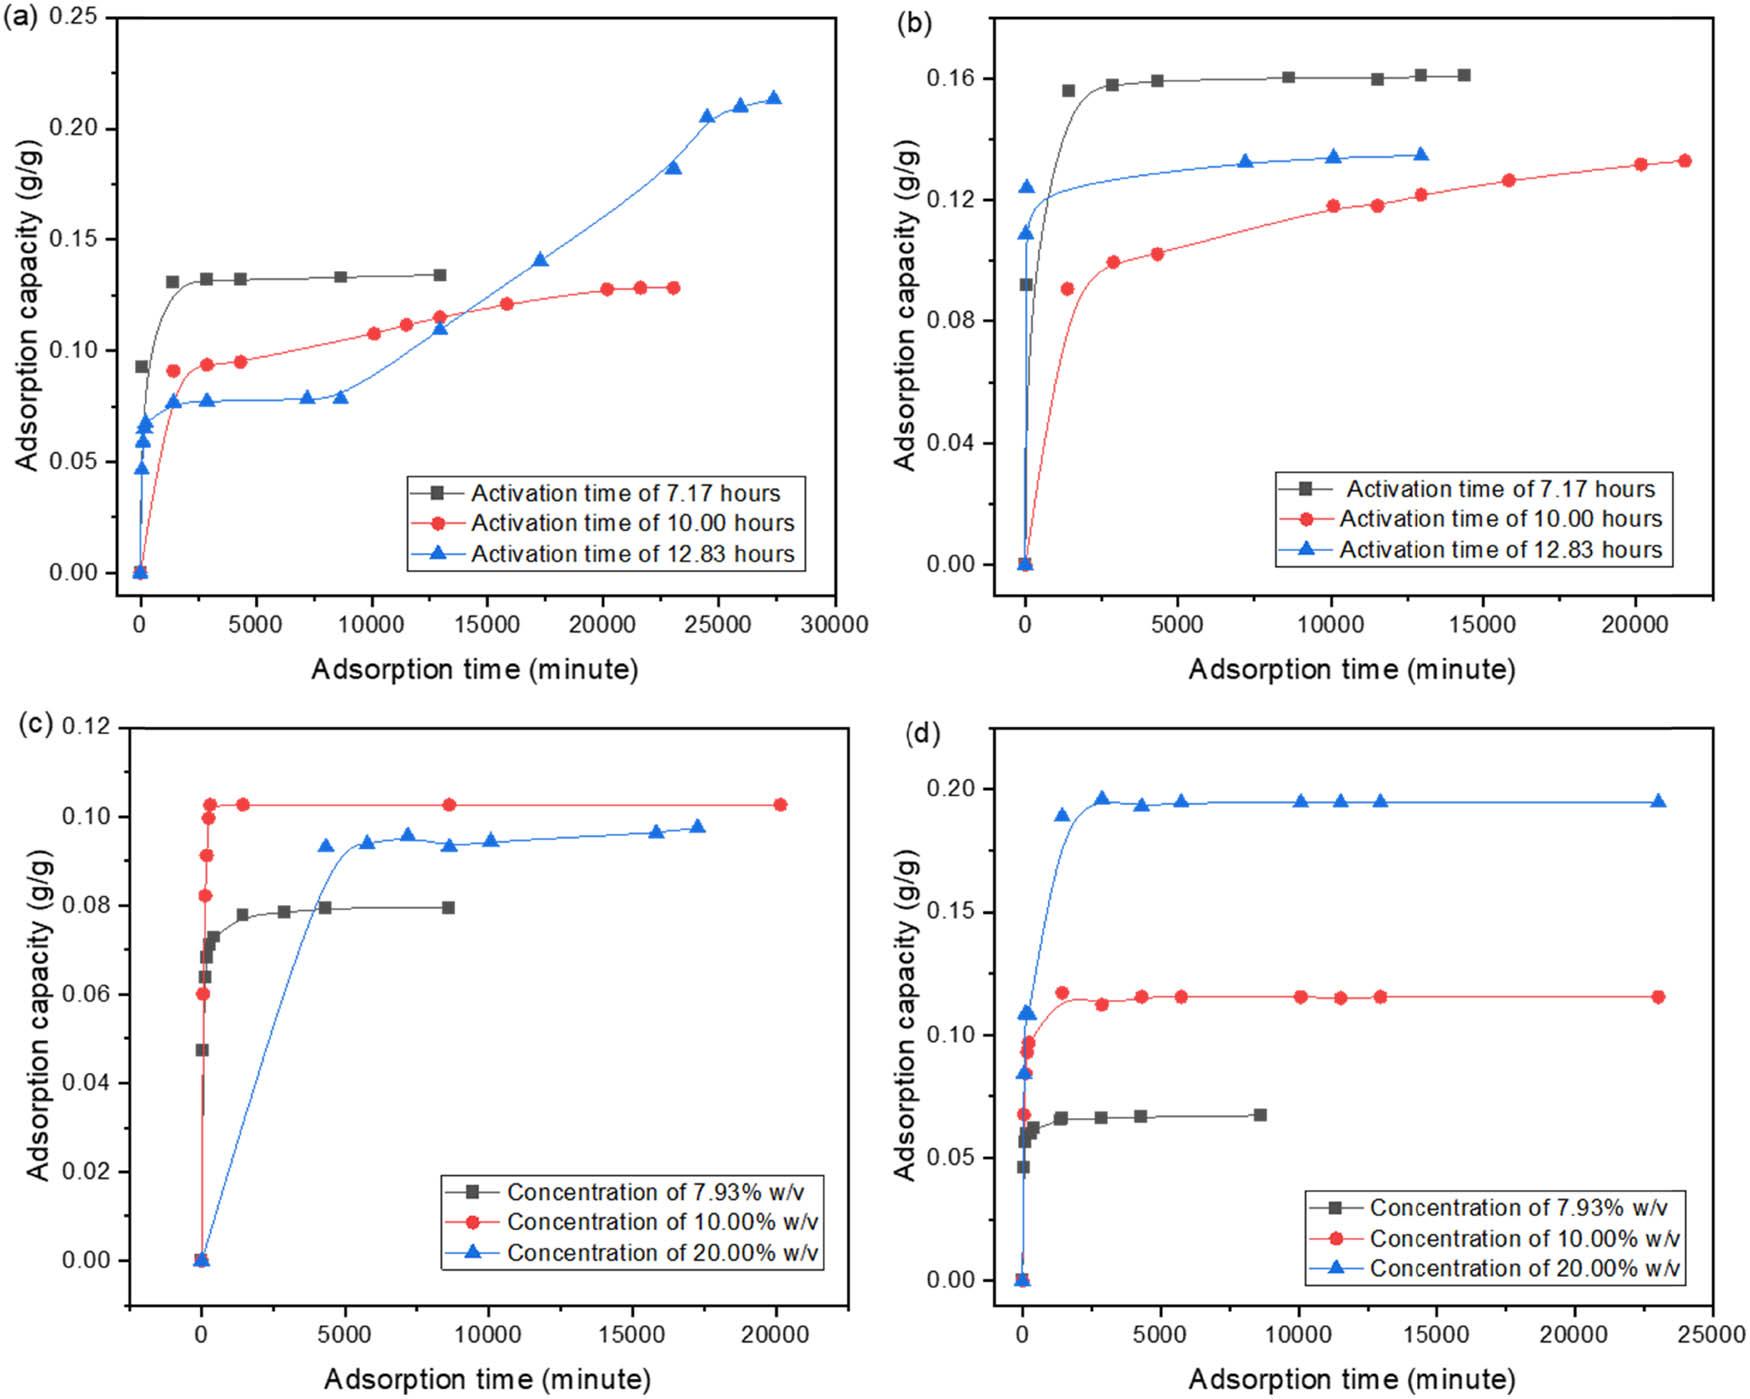
Water vapor adsorption of activated carbon prepared using (a) KOH concentration of 15% w/v, (b) NaOH concentration of 15% w/v, (c) KOH activation for 8 h, and (d) NaOH activation for 8 h.
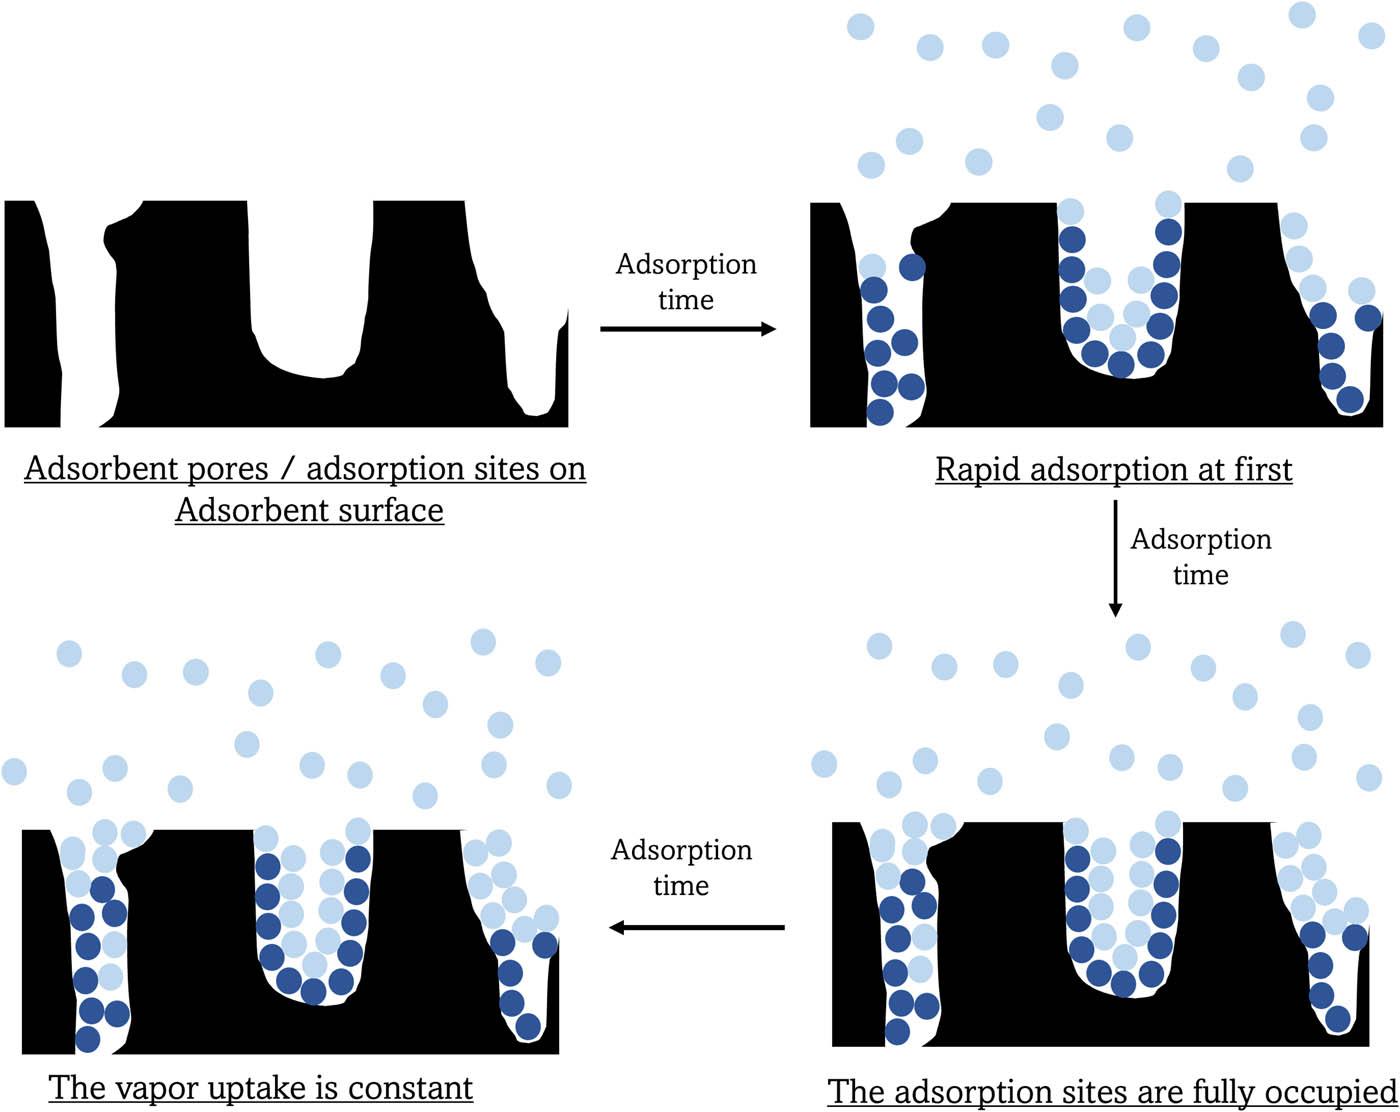
Water vapor adsorption process on the surface of activated carbon.
Based on the evaluation, KOH and NaOH activation resulted in activated carbons with different adsorption capacities. Figure 6(a and b) represents the adsorption capacity of activated carbons using 15% w/v activating agent with different activation times. There is a clear difference between KOH and NaOH activation. After being treated using KOH, the adsorption capacity increased when the activation time increased. In contrast, NaOH activation increased the adsorption capacity at a lower activation time. This is because the optimum activation time using NaOH is shorter than 7.17 h. Before, Thang et al. found that increasing the activation time at some points led to a decrease in adsorption capacity [48].
The effect of agent concentration is exhibited in Figure 6(c and d), indicating a higher adsorption capacity at a higher activating agent concentration. When the concentration was increased, a larger amount of the agent effectively moved into the carbon matrix and led to pore development [49]. However, water vapor adsorption of KOH-activated carbon at a concentration of 20.0% w/v was lower than that at 10.0% w/v. This result was likely to occur because at that time the adsorption capacity of 20.0% w/v-KOH-activated carbon had not yet reached its maximum. This can be observed from the plot (Figure 6), which still indicates an increase in adsorption capacity. Based on the adsorption capacity, ACK owned a higher capacity than ACNa. Following the morphological surface, smaller particles and pore sizes of ACK resulted in higher surface area and adsorption capacity. This was because KOH had a stronger alkali cation than NaOH, thereby resulting in a greater probability of reacting with carbon and forming pores. Furthermore, Fourier transform infrared (FTIR) analysis from previous studies revealed that the KOH-activated carbon exhibited a higher peak of O–H functional group compared to the NaOH-activated carbon [10,39]. This indicates that the NaOH-activated carbon possessed lower surface hydrophilicity, supporting the differences in adsorption behavior between both samples.
Figure 8 displays an additional analysis of the adsorption of the samples. In accordance with previous studies, the water activity was varied while the KOH concentration was altered [50]. Water vapor adsorption was found to be affected by increasing water activity, presumably because the adsorbent was more hydrophilic. This was mainly due to the capillary condensation process involving interconnected capillary channels, and as a result, activated carbon adsorbed a considerably higher amount of water molecules [51].

Water vapor adsorption of rice husk and activated carbon at a water activity of (a) 0.7 and (b) 0.85.
This study found that the maximum adsorption capacity of ACNa and ACK are 0.16 and 0.22 g/g, which is consistent with Muniandy et al. [19], who stated that potassium metal from KOH increases the reactivity during the carbon activation. In comparison, the adsorption capacity in this work is comparable with activated carbon/silica gel composite [52], but lower than walnut-shell activated carbon with physical activation [5]. This difference might be due to the carbon source, as this study used industrial carbon that probably burned under an uncontrolled temperature.
According to RSM-predicted adsorption capacity in Table 7, the maximum value is 0.32 g/g, different from the experimental adsorption capacity (∼0.22 g/g). This difference occurs because the optimum condition was suggested by the model (22.07% w/v and 12.83 h) and outside of the experimental combination of this study. In addition, the prediction relied on the mathematical fit of the polynomial model developed by RSM, which can overestimate the response when no actual data exist at that exact point.
Table 10 summarizes the water vapor adsorption capacity of this study compared with developed desiccants under the same testing conditions (temperatures of 20–30°C and 70–80% relative humidity). Although the adsorption capacity of the rice husk-based activated carbon (0.27 g/g) is lower than silica gel and zeolite 13X, it is comparable to several activated carbon-based desiccants reported in the literature. Considering its low-cost precursor, simple activation steps, and competitive performance relative to other activated carbons, the developed activated carbon shows promising potential as an alternative sustainable desiccant.
Comparison of the adsorption capacity by several desiccants.
| Desiccant | Adsorption capacity (g water/g desiccant) | Reference |
|---|---|---|
| Synthesized zeolite 13X | 0.47 | [53] |
| Synthesized zeolite Na-A | 0.18 | [53] |
| Silica gel | 0.29–0.32 | [53,54] |
| Sulfuric acid-treated activated carbon | 0.36 | [55] |
| Nitric acid-treated activated carbon | 0.27 | [55] |
| Acorn nutshell-based activated carbon | 0.29 | [56] |
| Rice husk-based activated carbon | 0.27 | This research |
Water vapor adsorption of RHC and ACNa at 25 and 50°C is shown in Figure 9. For RHC, no significant change in adsorption capacity is observed between the two temperatures, indicating that RHC maintains stable water uptake even under different thermal conditions. This behavior contrasts with previous studies that reported lower adsorption capacity at higher temperatures. The studies stated that the exothermic nature of adsorption reduces equilibrium uptake and weakens adsorbent–adsorbate interaction [10,57]. ACNa follows this trend, as the adsorption capacity decreased at 50°C (Figure 9b). Temperature can also influence the physical and chemical properties of the adsorbent surface, where structural changes may reduce the availability or effectiveness of active sites [58].
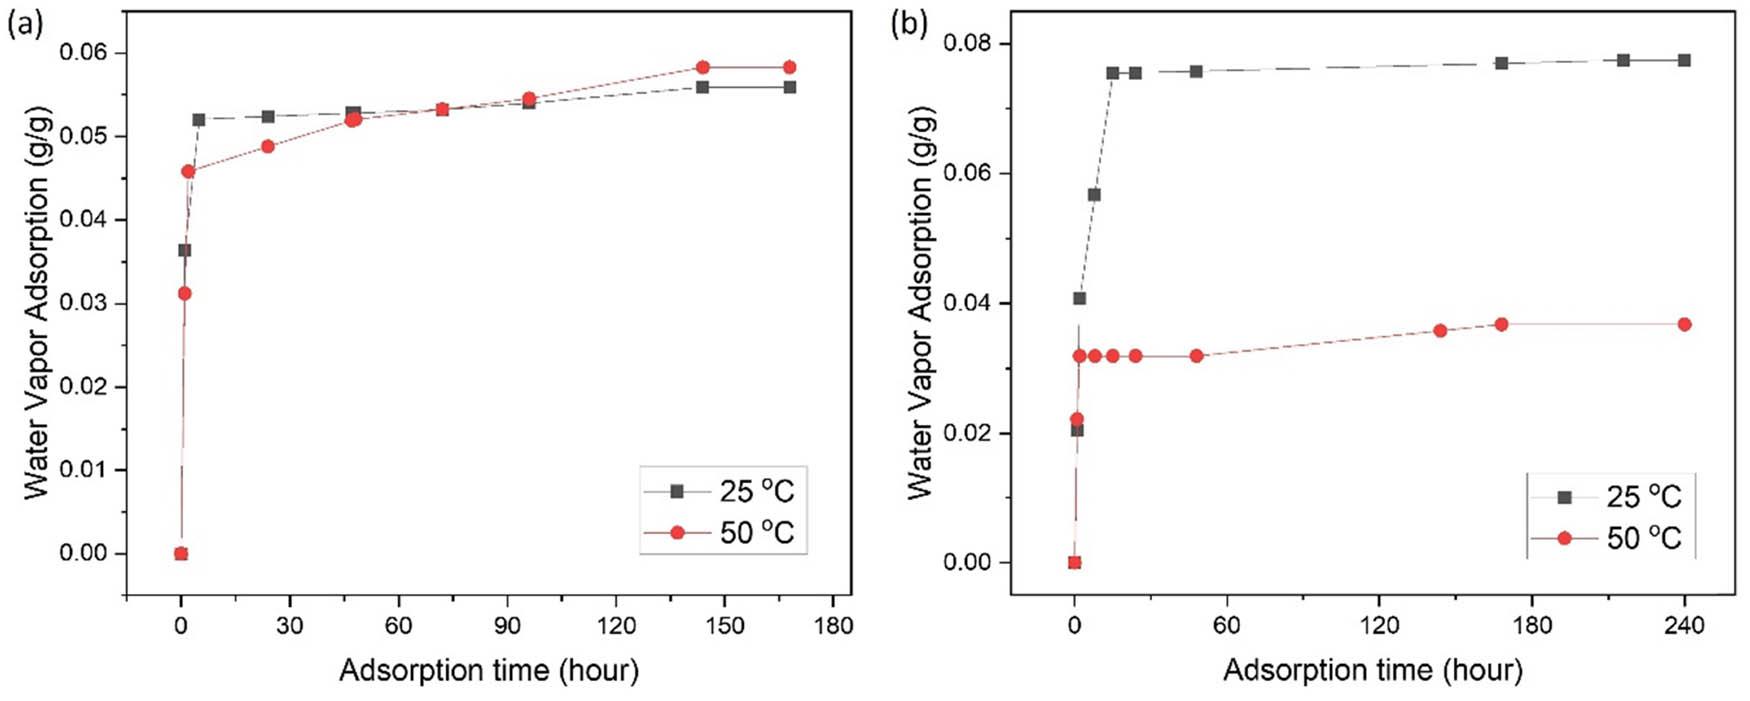
Water vapor adsorption of (a) RHC and (b) ACNa at different temperatures.
For stability evaluation, the adsorption process was examined for single ACK over four consecutive runs under ambient condition (Figure 10a). After repeated use, the adsorption capacity decreased with deviation approximately 2.7% due to the incomplete desorption or the presence of bonded water remaining inside the carbon pores [59]. A similar observation was reported by Wöllner et al. [60] who found a stable performance of several adsorbents, including MIL-101 (Cr) and Al-fumarate, after multiple cycles with only 2% deviations in water adsorption capacity. A higher stability was achieved by Dabbawala et al. [61] with only 4.4% capacity reduction after four adsorption cycles. The regenerability of ACK was conducted under four different temperatures (Figure 10b). The curves demonstrate that the ACK sample can be effectively regenerated with moderate heating and short periods.
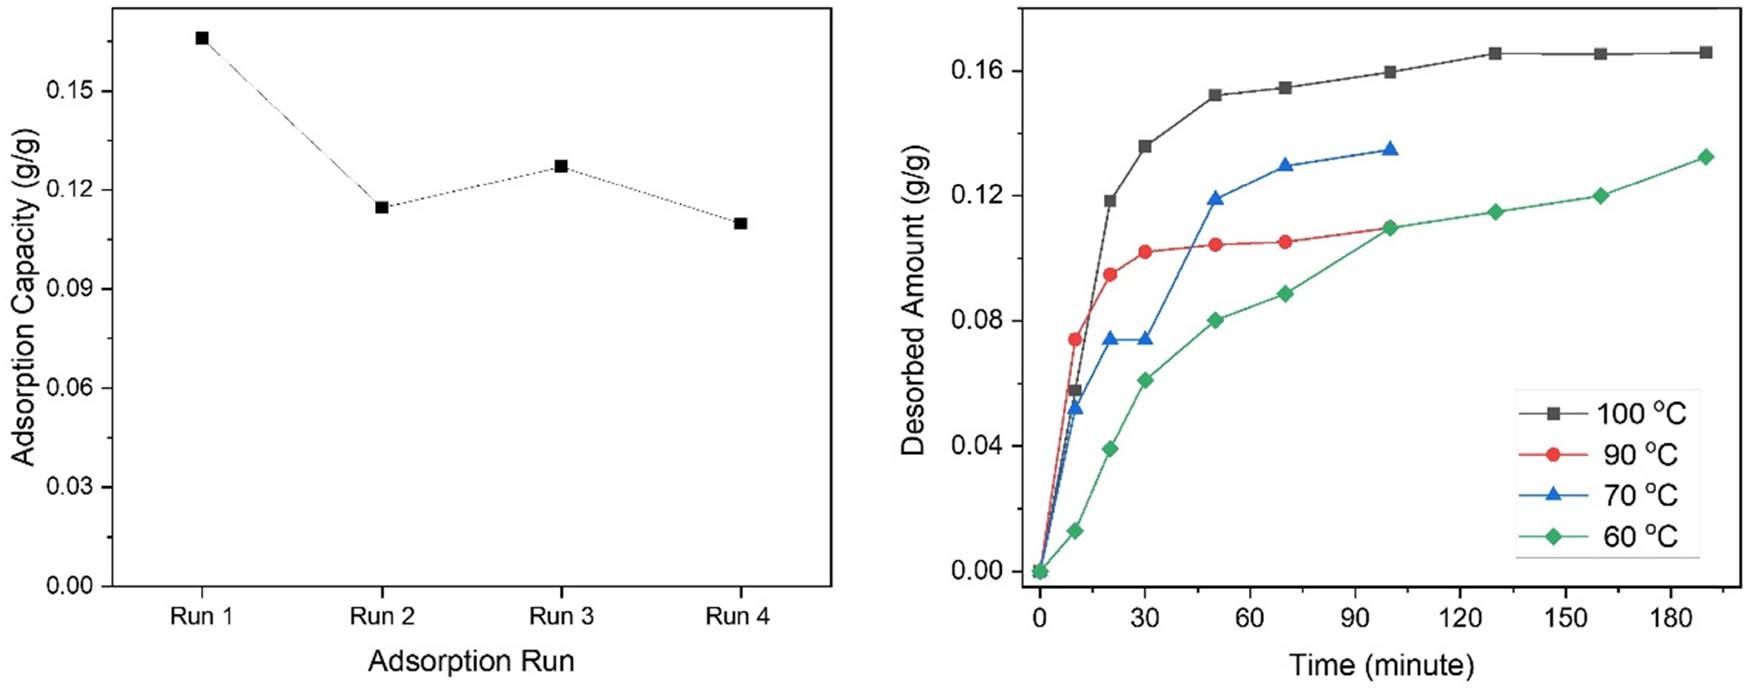
(a) Water vapor adsorption of a single ACK at same condition and (b) water vapor desorption at different temperatures.
The adsorption kinetics of rice husk-based activated carbon were evaluated using pseudo-first- and pseudo-second-order models through nonlinear regression. The modeling was conducted using Microsoft Excel. The results of modeling are shown in Tables 11 and 12, representing the models’ parameters. Between the two proposed models, the more suitable model should have the R 2 closest to 1 and the sum of square error (SSE) closest to 0. Based on the simulation, pseudo-second-order model is more suitable to represent the adsorption kinetics of the products. This model points out the interaction between adsorbate and active sites in the adsorbent pores [32]. It also represents a chemical adsorption on the activated carbon surface through hydrogen bonding, where the rate initially increases significantly at a high moisture concentration and then decreases as the active sites become saturated [62].
Parameters of nonlinear pseudo-first-order model of rice husk and activated carbons.
| Sample | Parameter | |||
|---|---|---|---|---|
| k | q e | R 2 | SSE | |
| KOH 15% w/v 7.17 h | 0.0202 | 0.1321 | 0.9994 | 1.124 × 10⁻⁶ |
| KOH 15% w/v 10.0 h | 0.0007 | 0.1174 | 0.9184 | 9.947 × 10⁻⁵ |
| KOH 15% w/v 12.83 h | 0.0001 | 0.3069 | 0.8059 | 0.0056 |
| KOH 7.93% w/v 8.00 h | 0.0148 | 0.0765 | 0.9877 | 6.686 × 10⁻⁶ |
| KOH 10.00% w/v 8.00 h | 0.0138 | 0.1027 | 0.9981 | 2.010 × 10⁻⁶ |
| KOH 20.00% w/v 8.00 h | 0.0008 | 0.0954 | 0.9985 | 1.488 × 10⁻⁶ |
| NaOH 15% w/v 7.17 h | 0.0143 | 0.1592 | 0.9992 | 2.195 × 10⁻⁶ |
| NaOH 15% w/v 10.0 h | 0.0008 | 0.1223 | 0.9499 | 6.990 × 10⁻⁵ |
| NaOH 15% w/v 12.83 h | 0.0688 | 0.1328 | 0.9984 | 3.708 × 10⁻⁶ |
| NaOH 7.93% w/v 8.00 h | 0.0192 | 0.0643 | 0.9853 | 5.100 × 10⁻⁶ |
| NaOH 10.00% w/v 8.00 h | 0..0112 | 0.1142 | 0.9791 | 2.234 × 10⁻⁵ |
| NaOH 20.00% w/v 8.00 h | 0.0052 | 0.1928 | 0.9548 | 1.846 × 10⁻⁴ |
| Relative humidity of 85%: RHC | 0.0247 | 0.0911 | 0.9880 | 1.346 × 10⁻⁵ |
| Relative humidity of 85%: ACK | 0.0075 | 0.1843 | 0.9164 | 4.235 × 10⁻⁴ |
| Relative humidity of 85%: ACNa | 0.0096 | 0.1137 | 0.9515 | 8.525 × 10⁻⁵ |
| Relative humidity of 70%: RHC | 0.0080 | 0.0578 | 0.9310 | 2.306 × 10⁻⁵ |
| Relative humidity of 70%: ACK | 0.0103 | 0.0864 | 0.9612 | 3.018 × 10⁻⁵ |
| Relative humidity of 70%: ACNa | 0.0124 | 0.0775 | 0.9521 | 3.670 × 10⁻⁵ |
| Average | 0.9597 | 3.672 × 10 −4 | ||
In addition to the kinetics model, the diffusion mechanism was examined using Boyd’s external diffusion and Weber–Morris intraparticle diffusion models (Tables 13 and 14). The analysis found that the plot consists of two to three distinguishable linear regions, indicating multi-stage adsorption involving external and intraparticle diffusion [63]. It is also clear that the adsorption is not only controlled by the intraparticle diffusion [26]. The suitable model was validated by regression plots in Figure 11.
Parameters of nonlinear pseudo-second-order model of rice husk and activated carbons.
| Sample | Parameter | |||
|---|---|---|---|---|
| k | q e | R 2 | SSE | |
| KOH 15% w/v 7.17 h | 0.2884 | 0.1331 | 0.9998 | 3.208 × 10⁻⁷ |
| KOH 15% w/v 10.0 h | 0.0097 | 0.1256 | 0.9569 | 5.180 × 10⁻⁴ |
| KOH 15% w/v 12.83 h | 0.0001 | 0.4349 | 0.6630 | 0.0062 |
| KOH 7.93% w/v 8.00 h | 0.3448 | 0.0799 | 0.9968 | 1.741 × 10⁻⁶ |
| KOH 10.00% w/v 8.00 h | 0.2616 | 0.1069 | 0.9807 | 1.999 × 10⁻⁵ |
| KOH 20.00% w/v 8.00 h | 0.1171 | 0.0953 | 0.9986 | 1.719 × 10⁻⁶ |
| NaOH 15% w/v 7.17 h | 0.1383 | 0.1608 | 0.9999 | 1.154 × 10⁻⁷ |
| NaOH 15% w/v 10.0 h | 0.0097 | 0.1309 | 0.8741 | 3.782 × 10⁻⁴ |
| NaOH 15% w/v 12.83 h | 1.4591 | 0.1341 | 0.9990 | 2.322 × 10⁻⁶ |
| NaOH 7.93% w/v 8.00 h | 0.5912 | 0.0667 | 0.9976 | 8.268 × 10⁻⁷ |
| NaOH 10.00% w/v 8.00 h | 0.1934 | 0.1163 | 0.9978 | 2.215 × 10⁻⁶ |
| NaOH 20.00% w/v 8.00 h | 0.0417 | 0.1976 | 0.9731 | 1.072 × 10⁻³ |
| Relative humidity of 85%: RHC | 0.6570 | 0.0915 | 0.9994 | 7.453 × 10⁻⁷ |
| Relative humidity of 85%: ACK | 0.0345 | 0.1868 | 0.9957 | 3.080 × 10⁻⁵ |
| Relative humidity of 85%: ACNa | 0.0983 | 0.1151 | 0.9982 | 3.300 × 10⁻⁶ |
| Relative humidity of 70%: RHC | 0.5095 | 0.0580 | 0.9858 | 7.410 × 10⁻⁶ |
| Relative humidity of 70%: ACK | 0.5774 | 0.0865 | 0.9903 | 6.347 × 10⁻⁶ |
| Relative humidity of 70%: ACNa | 0.1385 | 0.0780 | 0.9809 | 1.410 × 10⁻⁵ |
| Average | 0.9660 | 4.583 × 10 −4 | ||
Parameters of Boyd’s external diffusion model of rice husk and activated carbons.
| Sample | Parameter | |||
|---|---|---|---|---|
| k | R | R 2 | SSE | |
| KOH 15% w/v 7.17 h | 0.1321 | 0.0202 | 0.9994 | 1.1239 × 10⁻⁶ |
| KOH 15% w/v 10.0 h | 0.1209 | 0.0010 | 0.9120 | 0.0001 |
| KOH 15% w/v 12.83 h | 0.3071 | 4.138 × 10⁻⁵ | 0.8860 | 0.0013 |
| KOH 7.93% w/v 8.00 h | 0.0764 | 0.0149 | 0.9877 | 6.682 × 10⁻⁶ |
| KOH 10.00% w/v 8.00 h | 0.1027 | 0.0139 | 0.9981 | 2.006 × 10⁻⁶ |
| KOH 20.00% w/v 8.00 h | 0.0954 | 0.0008 | 0.9985 | 1.488 × 10⁻⁶ |
| NaOH 15% w/v 7.17 h | 0.1607 | 0.0024 | 0.8826 | 0.0006 |
| NaOH 15% w/v 10.0 h | 0.1369 | 0.0002 | 0.7638 | 0.0007 |
| NaOH 15% w/v 12.83 h | 0.1328 | 0.0689 | 0.9984 | 3.708 × 10⁻⁶ |
| NaOH 7.93% w/v 8.00 h | 0.0764 | 0.0149 | 0.9877 | 6.682 × 10⁻⁶ |
| NaOH 10.00% w/v 8.00 h | 0.1140 | 0.0115 | 0.9789 | 2.219 × 10⁻⁵ |
| NaOH 20.00% w/v 8.00 h | 0.1928 | 0.0052 | 0.9546 | 0.0002 |
| Relative humidity of 85%: RHC | 0.0883 | 0.0244 | 0.9880 | 6.290 × 10⁻⁶ |
| Relative humidity of 85%: ACK | 0.1759 | 0.0049 | 0.9687 | 8.557 × 10⁻⁵ |
| Relative humidity of 85%: ACNa | 0.1094 | 0.0072 | 0.9729 | 2.491 × 10⁻⁵ |
| Relative humidity of 70%: RHC | 0.0546 | 0.0153 | 0.9636 | 8.438 × 10⁻⁶ |
| Relative humidity of 70%: ACK | 0.0846 | 0.0186 | 0.9925 | 4.651 × 10⁻⁶ |
| Relative humidity of 70%: ACNa | 0.0742 | 0.0100 | 0.9561 | 2.171 × 10⁻⁵ |
| Average | 0.9550 | 1.720 × 10 −4 | ||
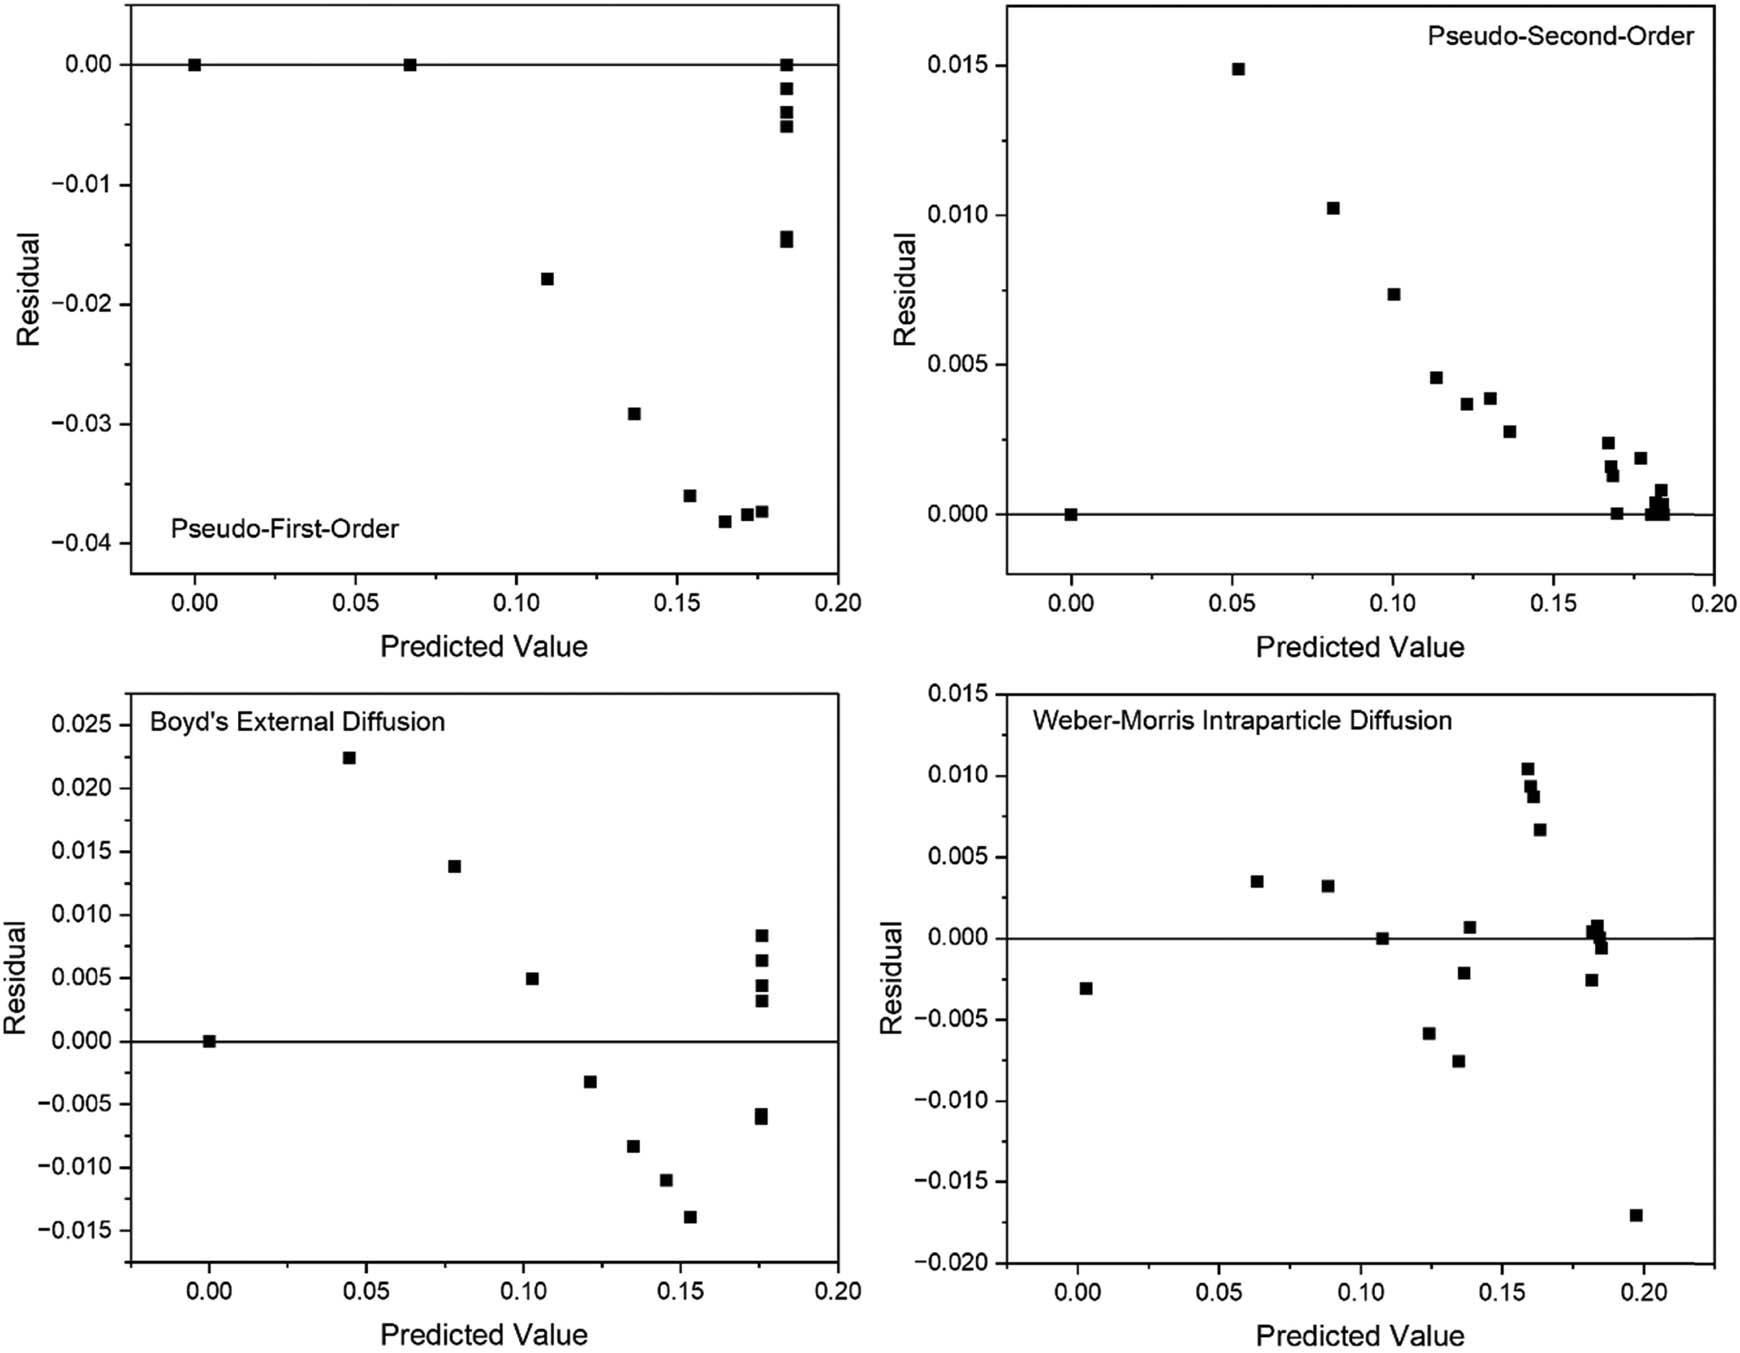
Residual plots of different adsorption and diffusion models.
Parameters of Weber–Morris intraparticle diffusion model of rice husk and activated carbons.
| Sample | Parameter | ||||
|---|---|---|---|---|---|
| k 1 | k 2 | k 3 | R 2 | SSE | |
| I 1 | I 2 | I 3 | |||
| KOH 15% w/v 7.17 h | 0.0028 | 0.00004 | — | 0.8229 | 0.0004 |
| 0.0315 | 0.12880 | — | |||
| KOH 15% w/v 10.0 h | 0.0019 | 0.00040 | — | 0.9702 | 3.837 × 10⁻⁵ |
| 0.0046 | 0.07060 | ||||
| KOH 15% w/v 12.83 h | 0.0045 | 0.00010 | 0.00200 | 0.9937 | 3.618 × 10⁻⁵ |
| 0.0048 | 0.06910 | −0.11050 | |||
| KOH 7.93% w/v 8.00 h | 0.0059 | 0.00045 | 0.00003 | 0.9982 | 1.036 × 10⁻⁶ |
| 0.0004 | 0.06184 | 0.07681 | |||
| KOH 10.00% w/v 8.00 h | 0.0066 | 0.00001 | — | 0.9868 | 1.366 × 10⁻⁵ |
| 0.0042 | 0.10140 | — | |||
| KOH 20.00% w/v 8.00 h | 0.0011 | 0.00010 | — | 0.9661 | 3.777 × 10⁻⁵ |
| 0.0055 | 0.08410 | — | |||
| NaOH 15% w/v 7.17 h | 0.0035 | 0.00005 | — | 0.9104 | 0.0002 |
| 0.0286 | 0.15477 | — | |||
| NaOH 15% w/v 10.0 h | 0.0020 | 0.00040 | — | 0.9302 | 0.0002 |
| 0.0037 | 0.07930 | — | |||
| NaOH 15% w/v 12.83 h | 0.0187 | 0.00010 | — | 0.9796 | 4.716 × 10⁻⁵ |
| 0.0039 | 0.12340 | — | |||
| NaOH 7.93% w/v 8.00 h | 0.0046 | 0.00025 | 0.00003 | 0.9745 | 8.860 × 10⁻⁶ |
| 0.0033 | 0.05626 | 0.06475 | |||
| NaOH 10.00% w/v 8.00 h | 0.0064 | 0.00008 | — | 0.9706 | 3.129 × 10⁻⁵ |
| 0.0073 | 0.10640 | — | |||
| NaOH 20.00% w/v 8.00 h | 0.0101 | 0.00186 | 0.00001 | 0.9703 | 0.0001 |
| 0.0013 | 0.08947 | 0.19304 | |||
| Relative humidity of 85%: RHC | 0.0065 | 0.00022 | 0.00004 | 0.9545 | 2.386 × 10⁻⁵ |
| 0.0062 | 0.08147 | 0.08768 | |||
| Relative humidity of 85%: ACK | 0.0078 | 0.00130 | 0.00010 | 0.9829 | 5.402 × 10⁻⁵ |
| 0.0031 | 0.11190 | 0.17451 | |||
| Relative humidity of 85%: ACNa | 0.0053 | 0.00084 | 0.00008 | 0.9888 | 9.679 × 10⁻⁶ |
| 0.0052 | 0.07729 | 0.10614 | |||
| Relative humidity of 70%: RHC | 0.0029 | 0.00006 | — | 0.9608 | 9.018 × 10⁻⁶ |
| 0.0048 | 0.05031 | — | |||
| Relative humidity of 70%: ACK | 0.0042 | 0.00002 | — | 0.9473 | 3.261 × 10⁻⁵ |
| 0.0091 | 0.08393 | — | |||
| Relative humidity of 70%: ACNa | 0.0040 | 0.00093 | 0.00002 | 0.9777 | 1.292 × 10⁻⁵ |
| 0.0032 | 0.04694 | 0.07457 | |||
| Average | 0.9603 | 6.980 × 10 −5 | |||
The water vapor sorption isotherm of RHC, ACK, and ACNa were analyzed using several sorption isotherm models. Figure 12 illustrates the relationship between equilibrium moisture content and water activity (relative humidity). At first (water activity < 0.6), the water vapor adsorption was not significantly enhanced. Meanwhile, when the water activity rose to more than 0.7, the adsorption capacity was elevated. This transition describes a shift mechanism from monolayer to multilayer adsorption, resulting in water clusters [40]. Several adsorption isotherm models were applied to simulate the moisture adsorption isotherm of RHC, ACK, and ACNa. Table 15 provides model and regression parameters, including R 2 and SSE values. Across all samples, the Freundlich isotherm exhibits the highest R 2 and lowest SSE, confirming that it provides the best representation of the experimental data. It is also shown by residual plots in Figure 13 that Freundlich yields more stable and randomly distributed residuals compared to the other models. This isotherm model indicates a multilayer reversible adsorption on a heterogeneous surface [31], consistent with morphological images and pore size distribution of the produced activated carbon.
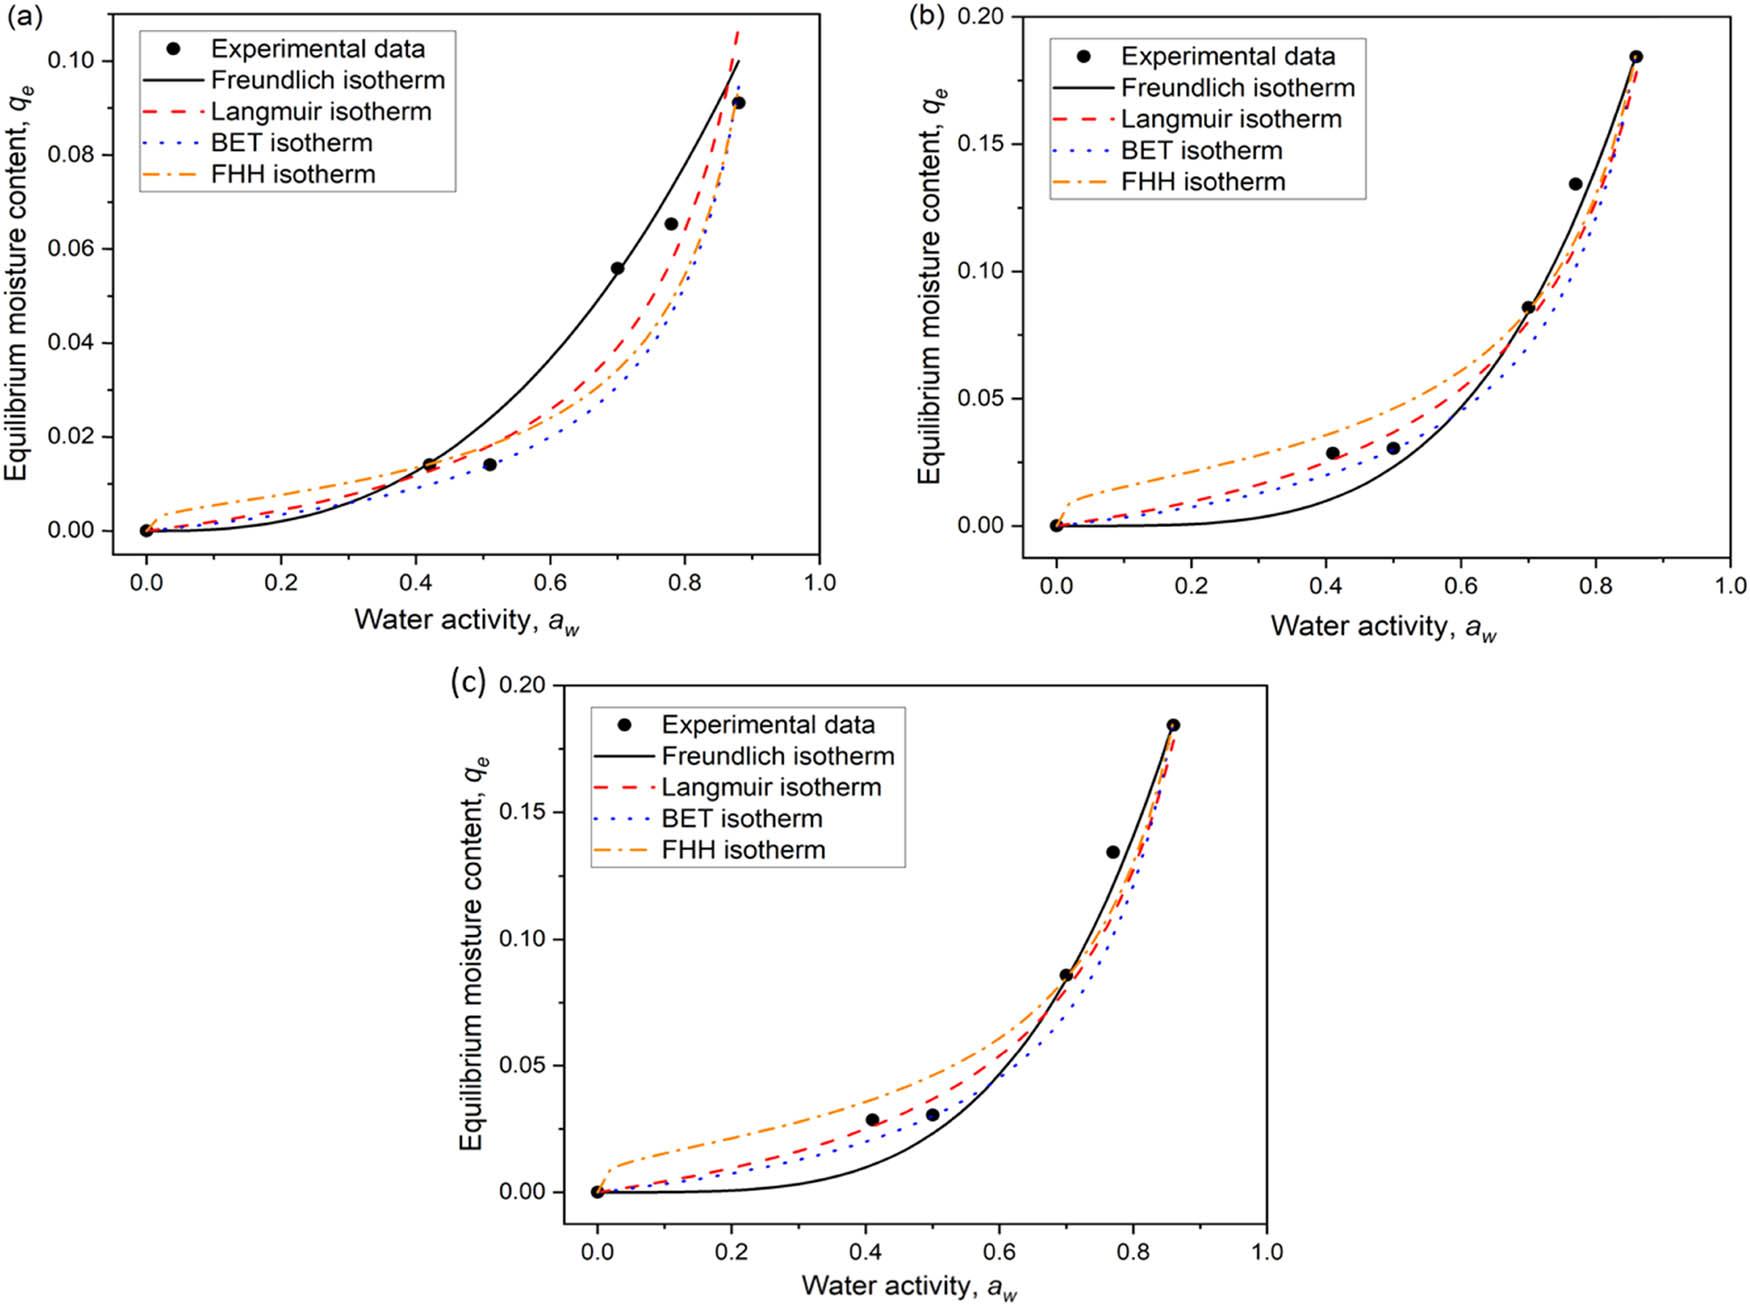
Plotting between experimental data and modeled data of water vapor sorption isotherm of (a) RHC, (b) ACK, and (c) ACNa.
Water vapor sorption isotherm models of rice husk and activated carbon.
| Isotherm model | Sample | Parameters | R 2 | SSE | |
|---|---|---|---|---|---|
| Freundlich | RHC | k F = 0.1397 | n F = 0.3821 | 0.9861 | 0.0002 |
| ACK | k F = 0.3311 | n F = 0.2606 | 0.9898 | 0.0005 | |
| ACNa | k F = 0.2040 | n F = 0.2888 | 0.9510 | 0.0008 | |
| Langmuir | RHC | m 0 = 0.0186 | k L = 0.9680 | 0.9164 | 0.0005 |
| ACK | m 0 = 0.0412 | k L = 0.9448 | 0.9807 | 0.0007 | |
| ACNa | m 0 = 0.0372 | k L = 0.8874 | 0.9226 | 0.0006 | |
| BET | RHC | m 0 = 0.0127 | c B = 1.1326 | 0.9124 | 0.0009 |
| ACK | m 0 = 0.0305 | c B = 0.9708 | 0.9700 | 0.0013 | |
| ACNa | m 0 = 0.0208 | c B = 1.0275 | 0.9079 | 0.0016 | |
| FHH | RHC | m 0 = 0.0124 | r = 1.0129 | 0.8935 | 0.0007 |
| ACK | m 0 = 0.0330 | r = 1.0921 | 0.9691 | 0.0007 | |
| ACNa | m 0 = 0.0216 | r = 1.0702 | 0.8848 | 0.0009 | |
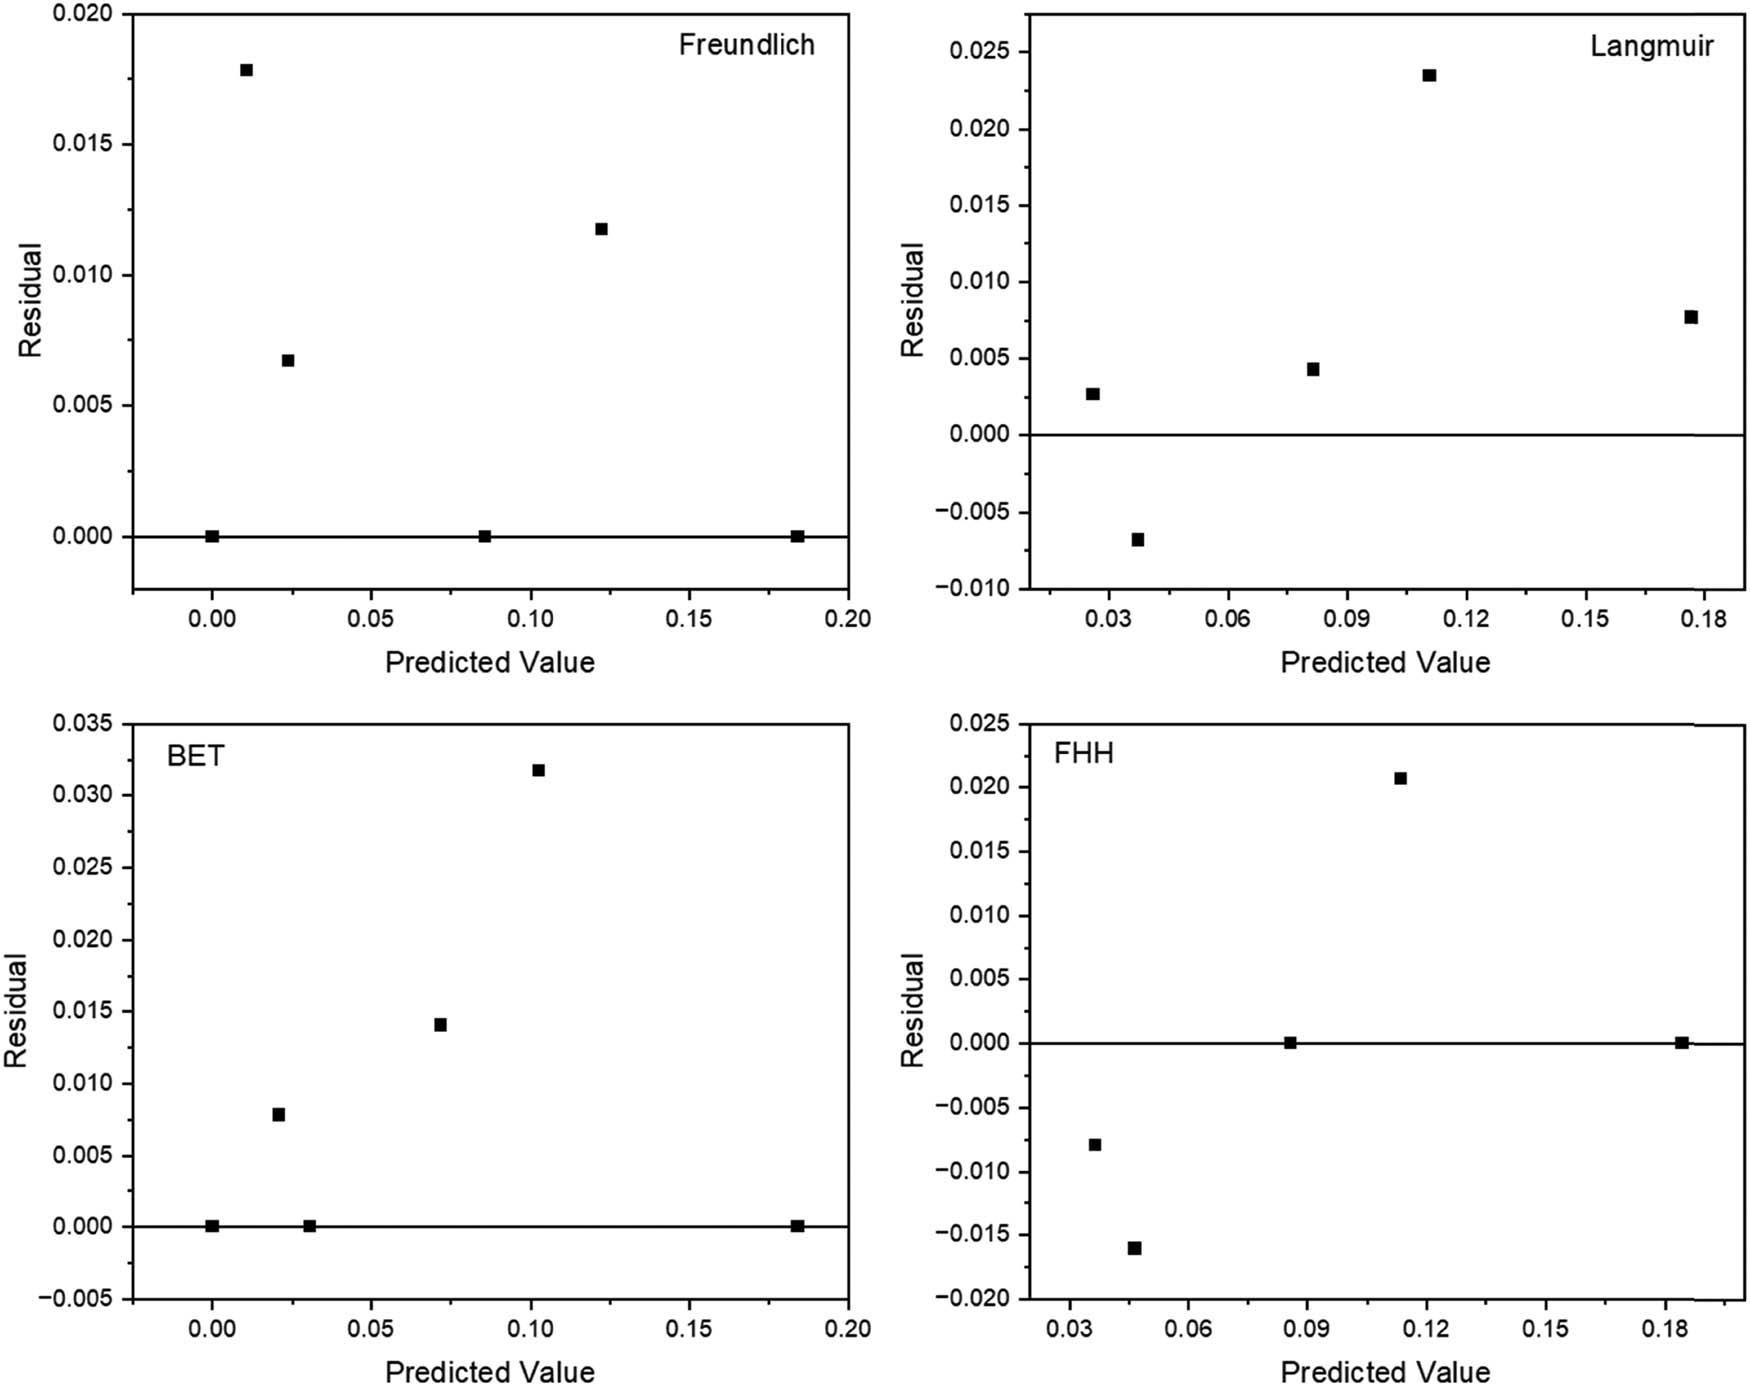
Residual plots of several adsorption isotherm models.
The optimization of rice husk-based activated carbon production was conducted by considering the variation in activating agent concentration and activation time. After being activated at the highest concentration (22.07% w/v) using KOH or NaOH, the activated carbon had the highest adsorption capacity. However, the activation time had different effects on the adsorption capacity, which was caused by the activating agent used (KOH or NaOH). In KOH activation, an increase in activation time increased the adsorption capacity of the resulting activated carbon. On the other side, in NaOH activation, an increase in activation time decreased the adsorption capacity of the resulting activated carbon. By using RSM, the optimum conditions to produce activated carbon with the highest adsorption capacity were found either in KOH or NaOH activations. Based on RSM, the optimum concentration was 22.07% w/v for both activating agents and the optimum activation times were 12.83 and 7.17 h for KOH and NaOH, respectively. The analysis of variance found that activating agent concentration and activation time were significant factors in the adsorption capacity. According to the morphology analysis, after the activation process, the particle and pore sizes of carbon bulk were reduced. Moreover, the activation process successfully removed carbon impurities and left a small amount of silica as the impurity. The N2 adsorption–desorption evaluation implies that KOH-activated carbon possessed the largest surface area and highest pore volume, which were five times higher than RHC. The adsorption capacity over time was used to fit the adsorption kinetics models. It implies that the pseudo-second-order model was more suitable than the pseudo-first-order model. Furthermore, as indicated in the adsorption isotherm, ACK and ACNa adsorbed water vapor twofold higher than RHC. The sorption isotherm regression found that Freundlich isotherm was the best model to predict the moisture sorption isotherm of rice husk-based activated carbon, indicating multilayer adsorption. Although the RSM successfully identified the optimum activation conditions, these conditions were not experimentally implemented in this study and are therefore suggested for future investigation. In addition, surface chemistry characterization for functional group identification, such as Fourier transform infrared and X-ray photoelectron spectroscopy, was not performed, which represents a limitation of this work. Nevertheless, this limitation does not invalidate the conclusions, as the adsorption performance was consistently supported by morphology, N₂ adsorption–desorption, kinetic, and isotherm analysis.
This research was funded by Universitas Diponegoro with the scheme of Riset Publikasi Internasional and grant number 609-83/UN7.D2/PP/VIII/2023.
Dewi Qurrota A’yuni: writing – original draft, investigation, methodology; Moh. Djaeni: conceptualization, supervision; Nandang Mufti: analysis, review; Agus Subagio: review and editing, supervision.
Authors state no conflict of interest.
All data are available within the article.