
Figure 1
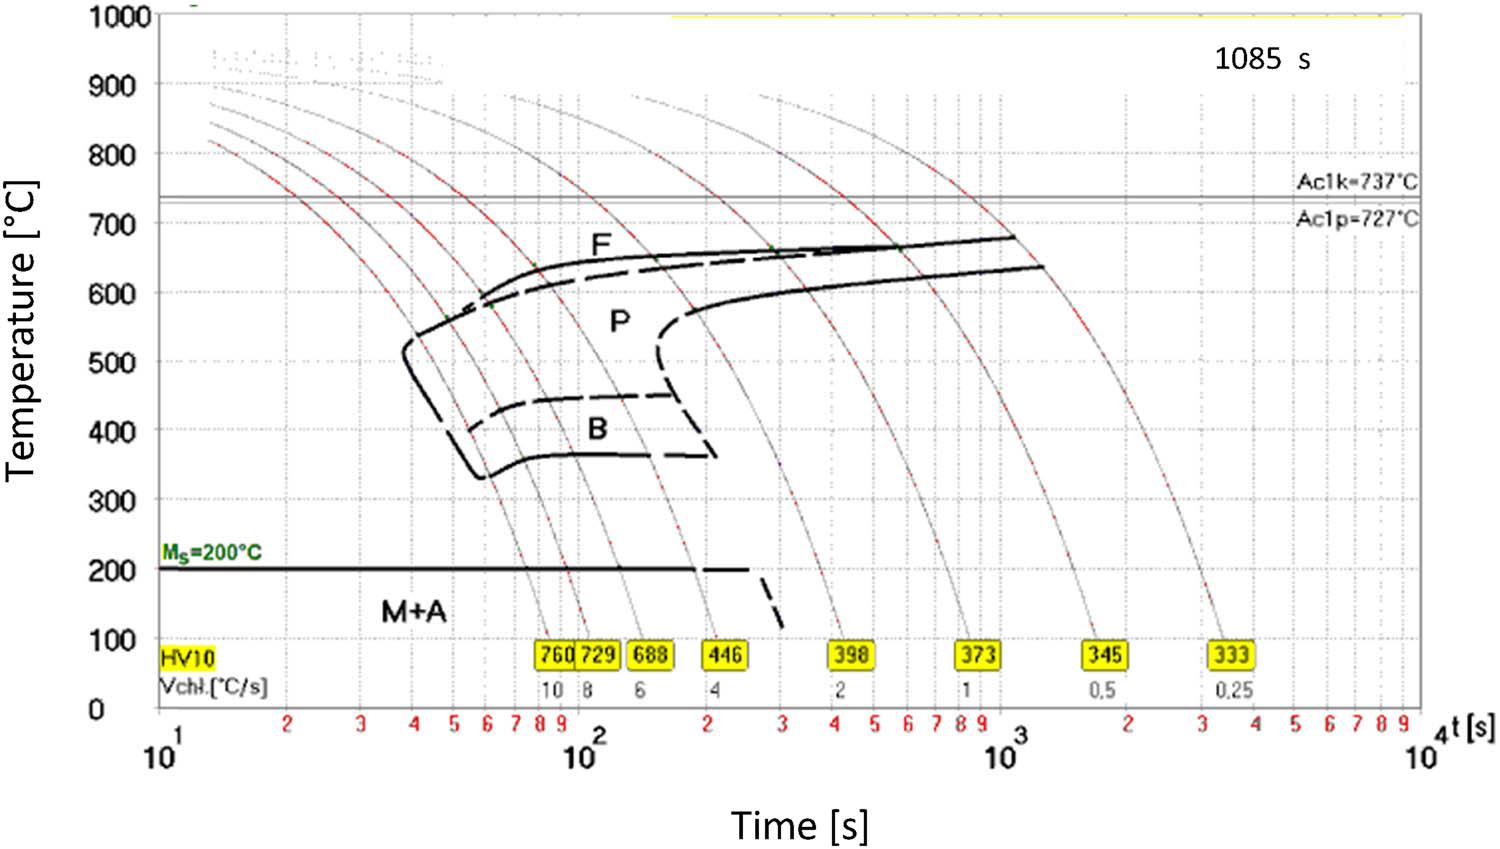
Figure 2
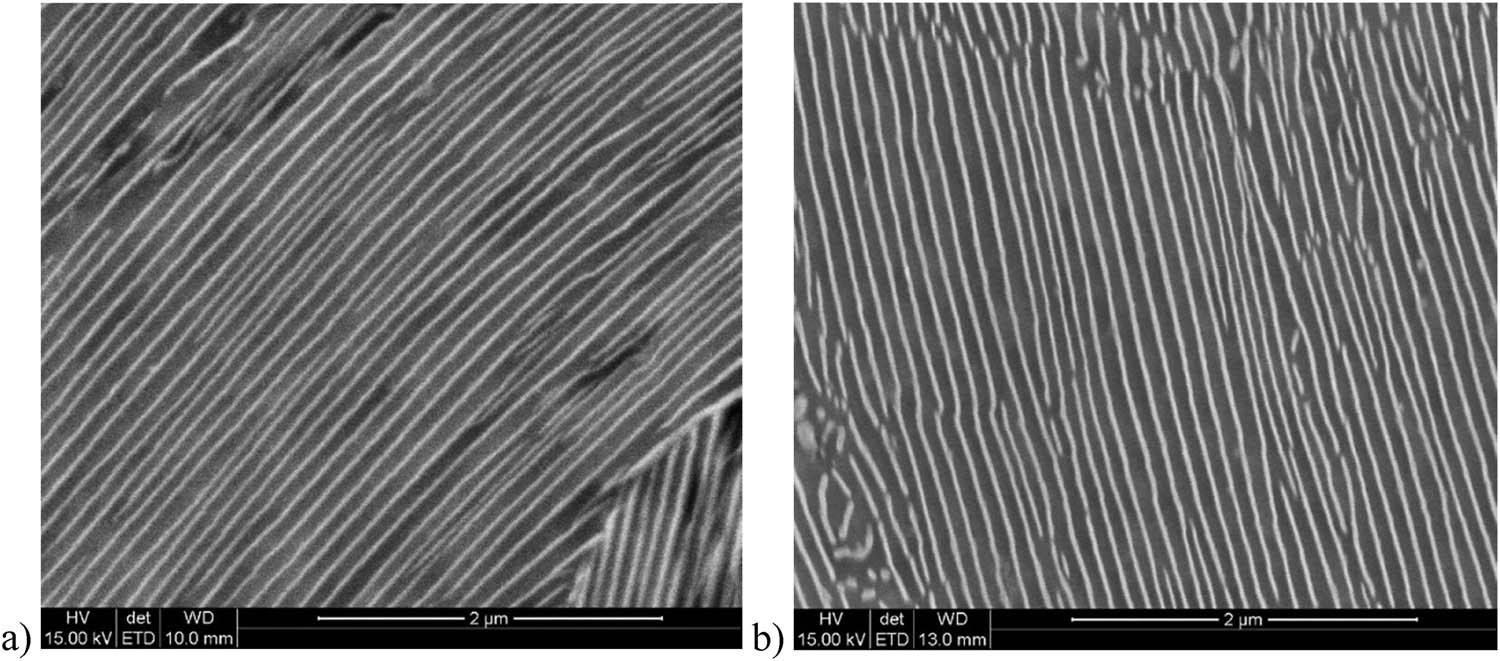
Figure 3
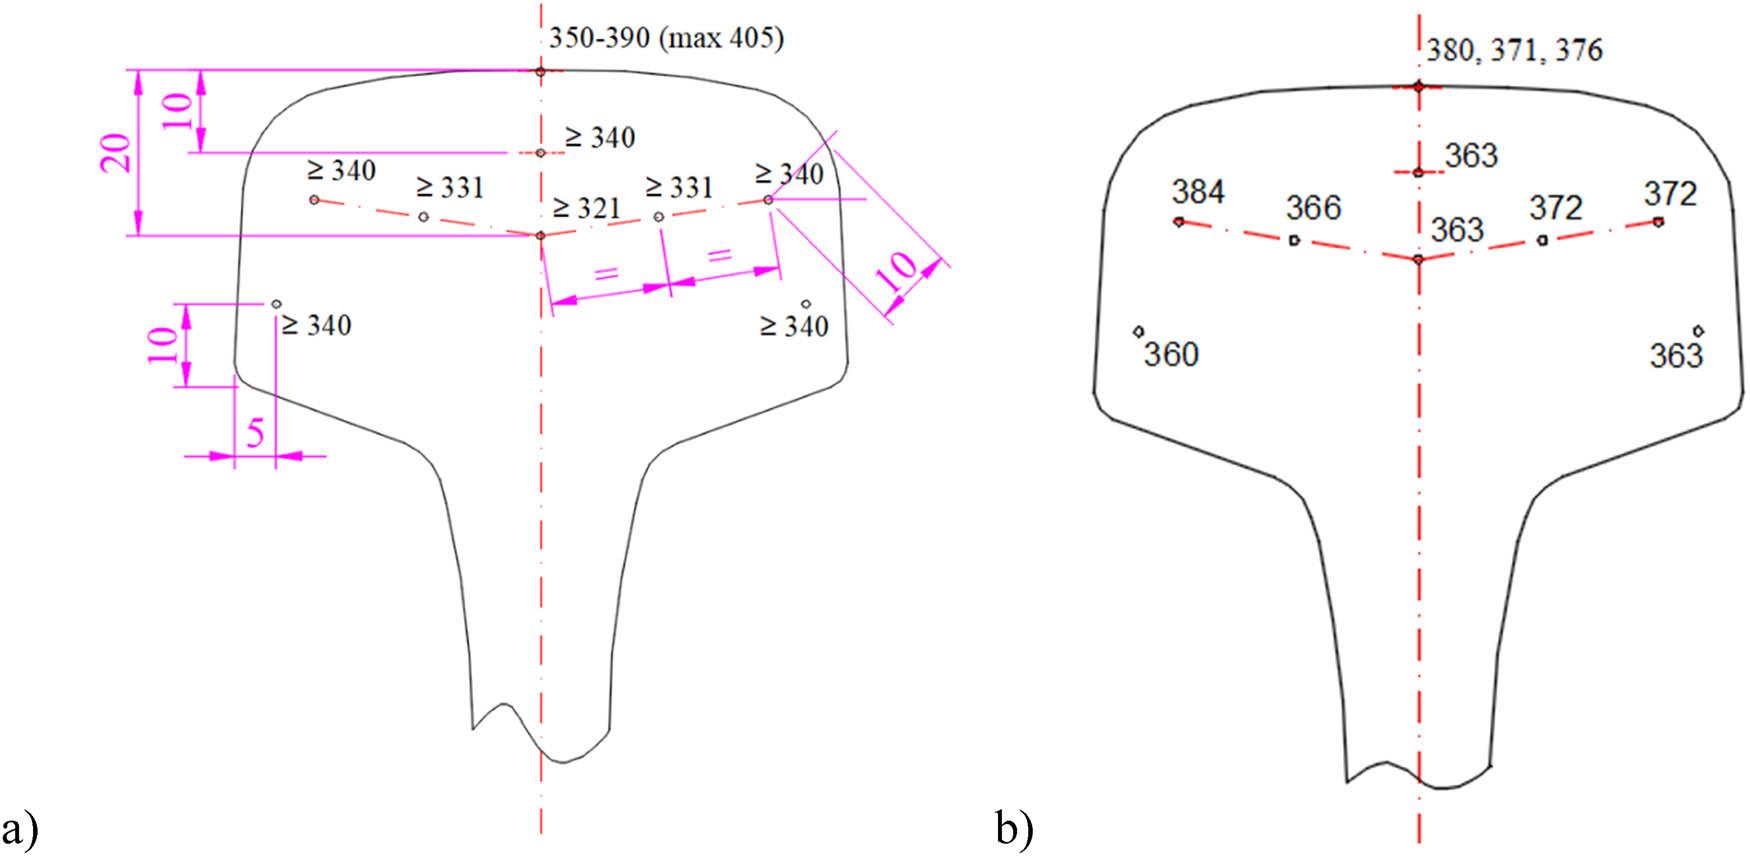
Figure 4
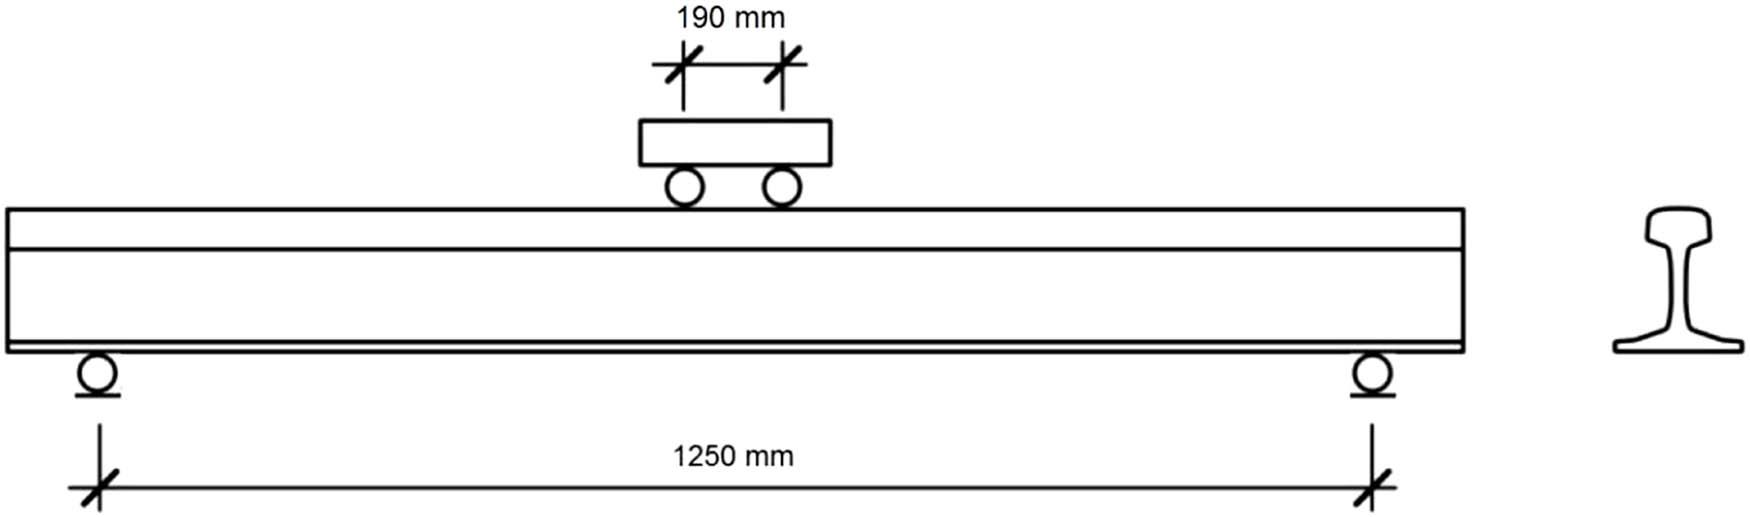
Figure 5
Figure 6
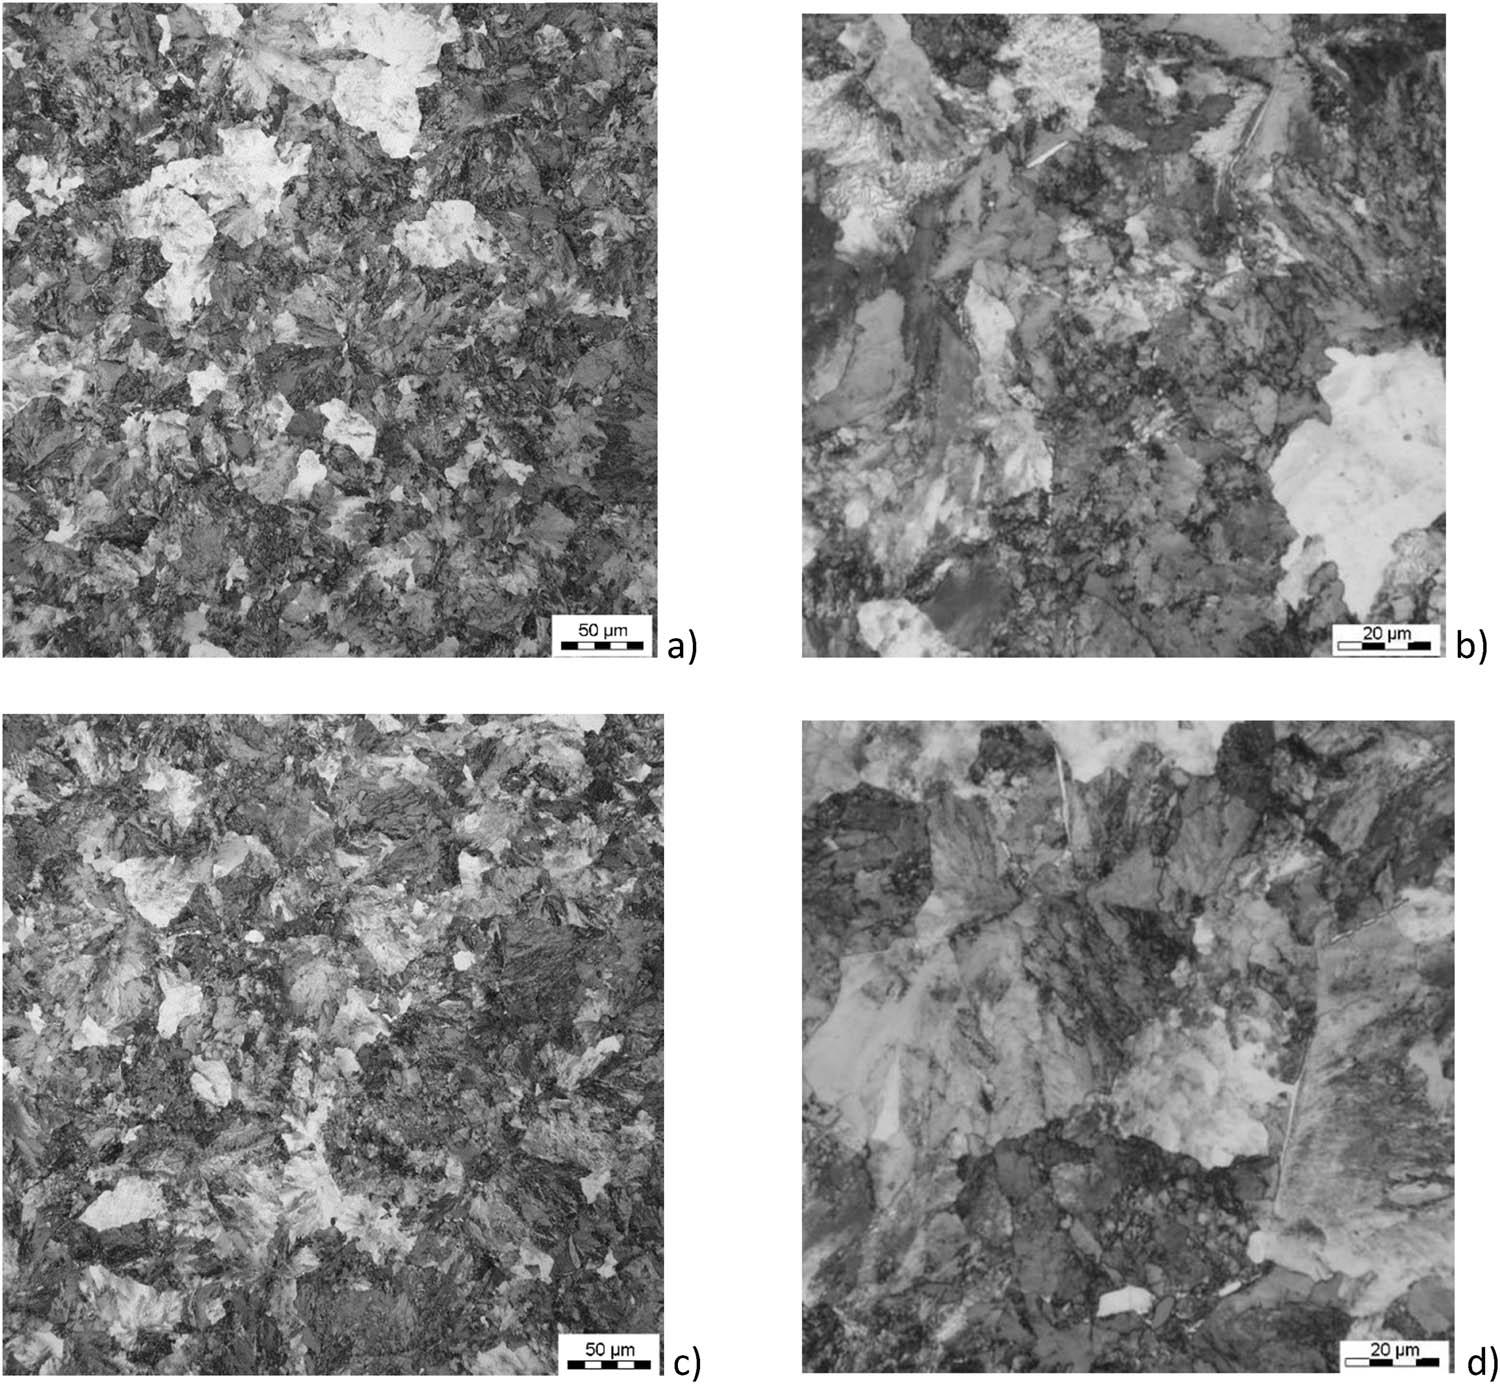
Figure 7
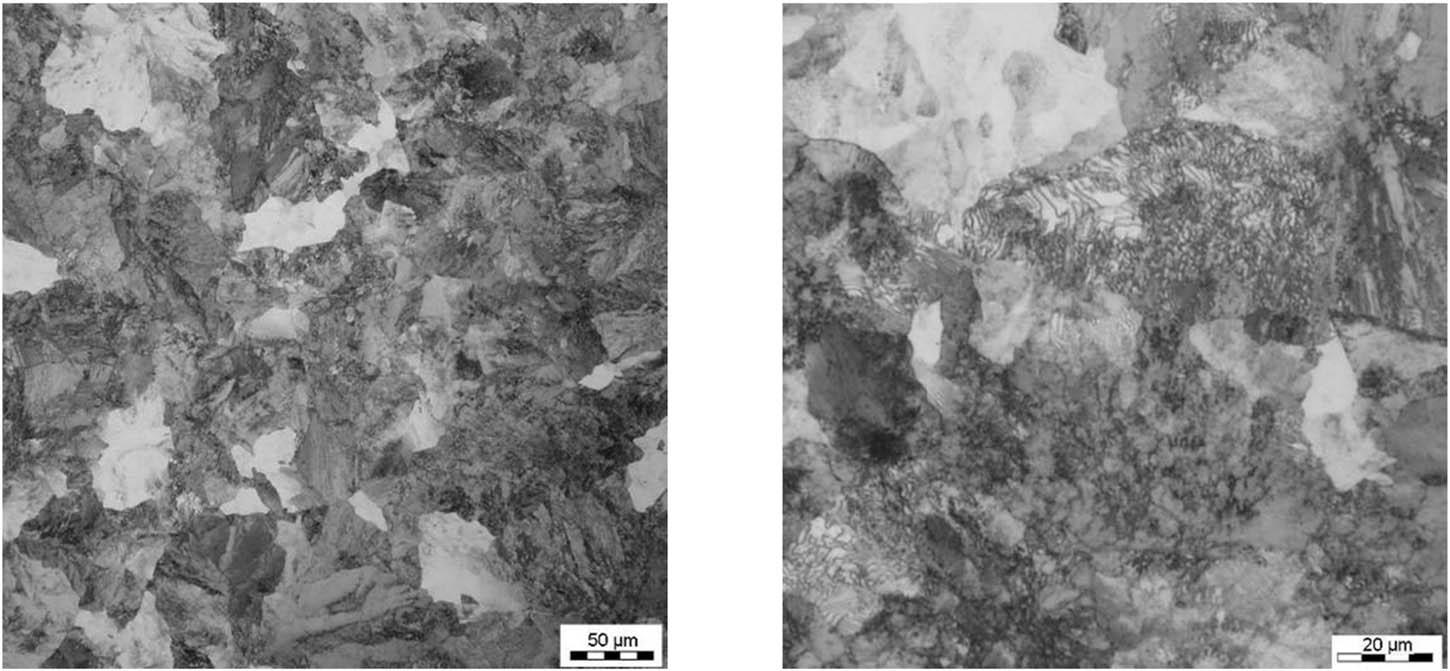
Figure 8
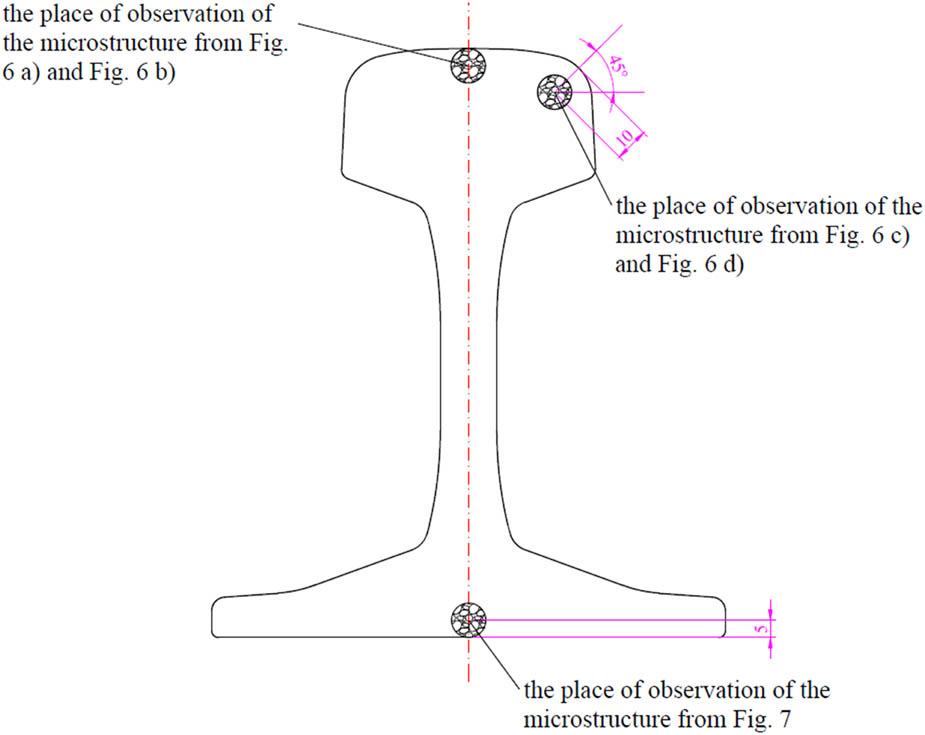
Figure 9
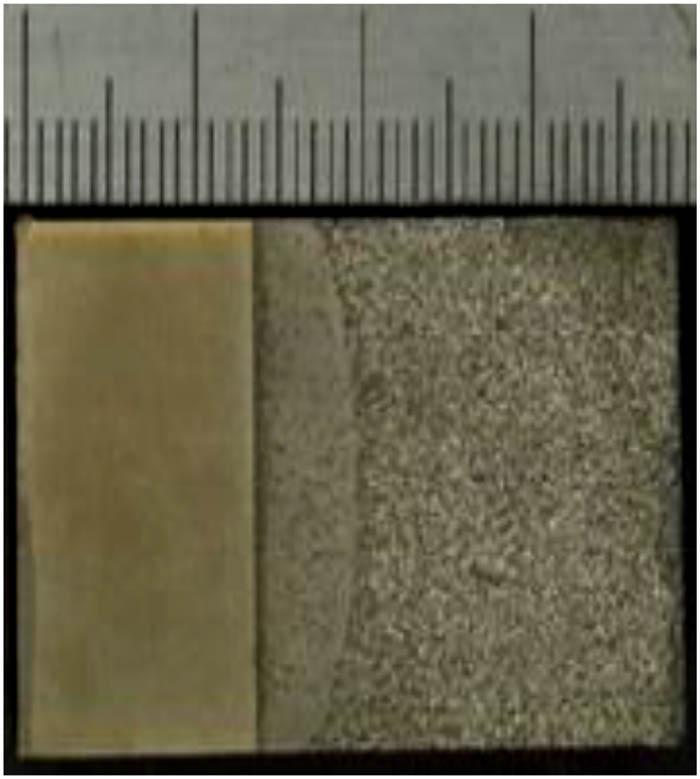
Figure 10
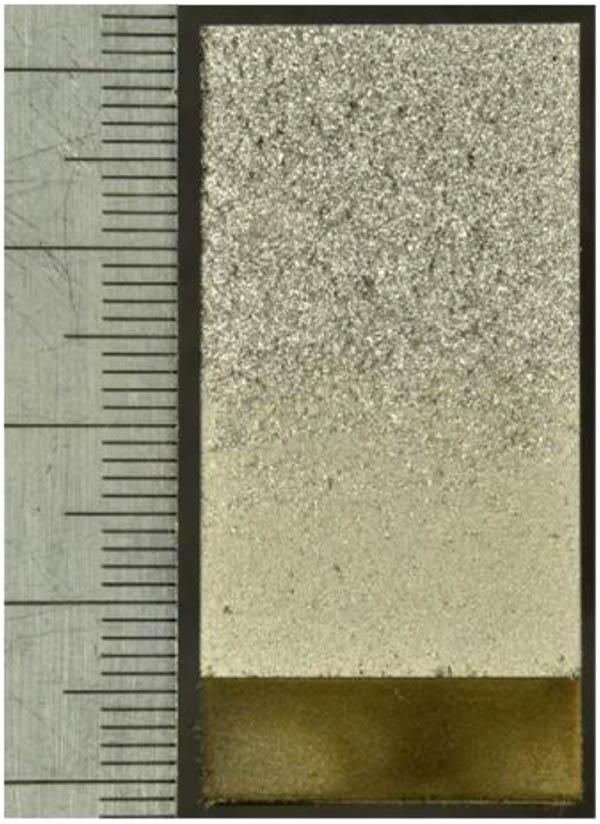
Figure 11
Figure 12
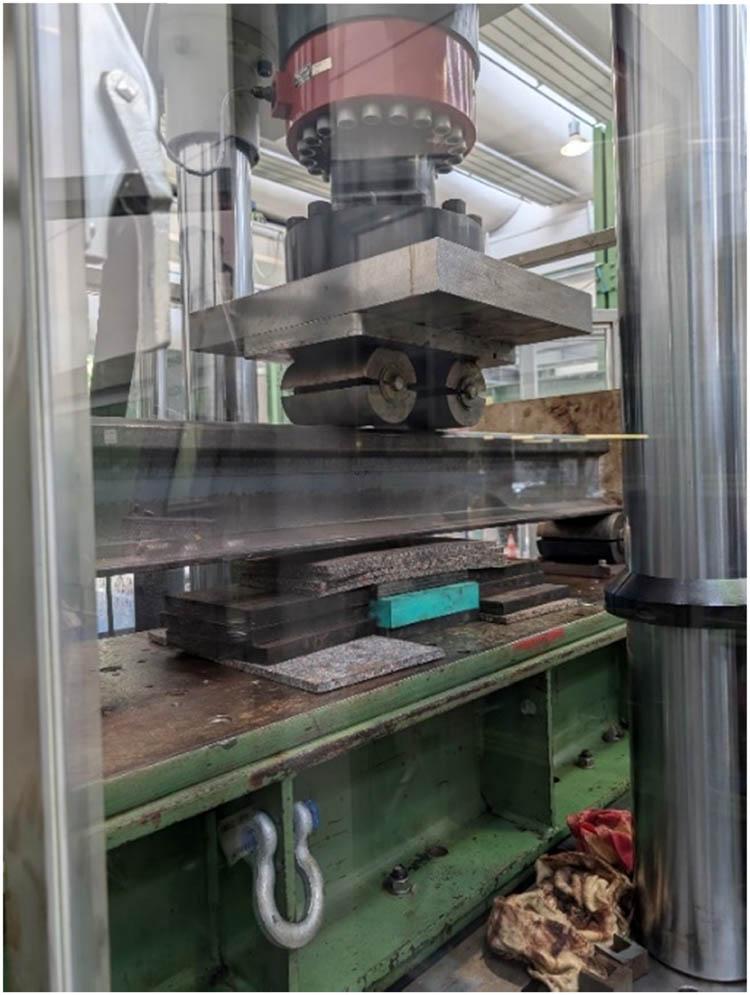
Figure 13
Figure 14
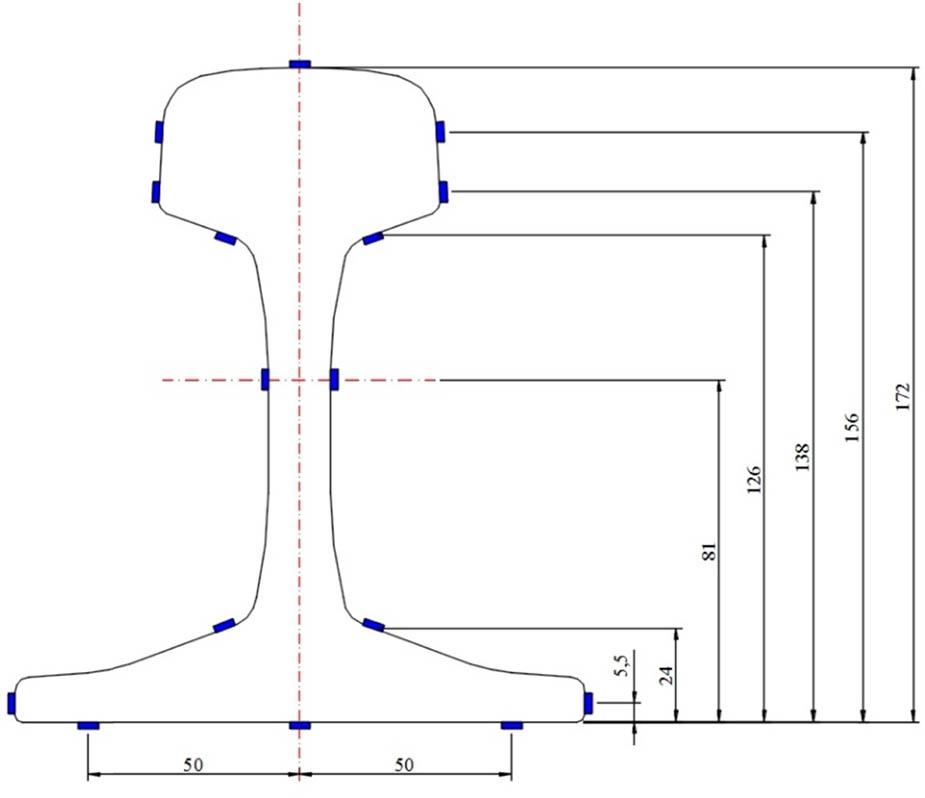
Figure 15
Fracture toughness tests [21]_
| Number of specimens | Fracture toughness K Ic, MPa m1/2 | Average value K Ic, MPa m1/2 | Standard deviation K Ic, MPa m1/2 | |
|---|---|---|---|---|
| 1 | 1–1 | 46.2 | 43.0 | 2.7 |
| 1–2 | 45.4 | |||
| 1–3 | 40.3 | |||
| 1–4 | 40.7 | |||
| 1–5 | 42.3 | |||
| 2 | 2–1 | 39.9 | 40.1 | 1.1 |
| 2–2 | 40.8 | |||
| 2–3 | 40.4 | |||
| 2–4 | 38.3 | |||
| 2–5 | 41.2 | |||
| 3 | 3–1 | 39.2 | 39.9 | 1.5 |
| 3–2 | 40.3 | |||
| 3–3 | 37.6 | |||
| 3–4 | 41.3 | |||
| 3–5 | 41.0 | |||
| Requirements according to EN13674-1 for the R350HT grade | Single min. value 30 MPa m1/2 | Average value min 32 MPa m1/2 | ||
Fatigue strength test results [21]_
| Sample No. | Strain amplitude | Force, kN | Result |
|---|---|---|---|
| 1a | 0.00135 | 10.78 | No cracks |
| 1b | 0.00135 | 10.88 | No cracks |
| 1c | 0.00135 | 10.75 | No cracks |
| 2a | 0.00135 | 10.83 | No cracks |
| 2b | 0.00135 | 10.83 | No cracks |
| 2c | 0.00135 | 10.88 | No cracks |
| 3a | 0.00135 | 10.83 | No cracks |
| 3b | 0.00135 | 10.76 | No cracks |
| 3c | 0.00135 | 10.57 | No cracks |
Averaged results of mechanical properties tests and hardness measurements on the running surface of industrially manufactured 60E1/60E2 profile rails made of R350HT steel_
| Number of samples | Cooling start temperature, °C | R p0.2, MPa | R m, MPa | A, % | Z, % | Impact strength KV2 at 20°C, J/cm2 | HBW hardness on the rolling surface – (RS)* | |
|---|---|---|---|---|---|---|---|---|
| Head | Foot | |||||||
| 1 | 830 | 724 | 1,228 | 10.2 | 19.4 | 12.7 | 10.1 | 362.1 |
| 1 | 810 | 732.2 | 1239.2 | 10.3 | 17.5 | 10.3 | 10.7 | 361.0 |
| 2 | 790 | 699.7 | 1264.3 | 9.7 | 17.1 | 10.7 | 10.7 | 367.1 |
Results of the measurement of residual stress in the rail foot_
| Number of sample | Residual stress value (MPa) |
|---|---|
| 1 | 96.9 |
| 3 | 66.4 |
| 2 | 84.9 |
| 2 | 104.9 |
| 3 | 116.7 |
| 4 | 114.3 |
| Mean value | 97.3 |
Results of the Baumann test_
| Number of sample | Number of pattern |
|---|---|
| 5 | D2, D2, D2, D2, D2, D2 |
| 6 | D2, D2, D2, D2, D2, D4 |
| 7 | D2, D2, D2, D2, D2, D2 |
Basic properties of the tested rail steel for individual rail types [21]_
| Number of sample | Basic mechanical properties | ||||
|---|---|---|---|---|---|
| Tensile strength, R m, MPa | Yield strength R p0.2, MPa | Elongation A, % | Necking Z, % | Hardness, HB | |
| 1 | 1,286 | 881 | 9.1 | 18 | 376 |
| 2 | 1,249 | 854 | 10.3 | 22 | 365 |
| 3 | 1,238 | 875 | 10.9 | 23 | 363 |
| 4 | 1,262 | 877 | 10.7 | 22 | 366 |
| 5 | 1,284 | 904 | 11.2 | 23 | 364 |
| 6 | 1,270 | 899 | 10.4 | 23 | 367 |
| 7 | 1,293 | 885 | 11.5 | 21 | 370 |
| 8 | 1,273 | 880 | 10.9 | 19 | 366 |
Summary of average fatigue test results and residual stress in the rail foot from tests 1 and 2_
| Type of study | Obtained result (average value) | Requirements according to EN 13674-1 |
|---|---|---|
| K Ic coefficient | 41 MPa m1/2 | 32 MPa m1/2 |
| 27 samples 60E1, 54E4, 49E1 | ||
| Fatigue tests | 10 × 106 cycles | 5 × 10⁶ cycles |
| 27 samples 60E1, 54E4, 49E1 | ||
| Fatigue tests | 50 × 106 cycles | — |
| 1 sample 60E1 | ||
| Fatigue crack growth rate | 6.12 m/Gc | 17 m/Gc for ΔK = 10 MPa m1/2 |
| 27 samples 60E1, 54E4, 49E1 | ||
| Fatigue crack growth rate | 15.02 m/Gc | 55 m/Gc for ΔK = 13.5 MPa m1/2 |
| 27 samples 60E1, 54E4, 49E1 |
Results of testing the fatigue crack growth rate [21]_
| Sample No. | da/dN = C (ΔK) m | Indicator m/Gc ΔK = 10, MPa m1/2 | Indicator m/Gc ΔK = 13.5, MPa m1/2 | ||
|---|---|---|---|---|---|
| C | m | ||||
| 1 | 1–1 | 1.4207 × 10⁷ | 1.9498 | 12.66 | 22.72 |
| 1–2 | 1.1649 × 10⁷ | 2.0288 | 12.45 | 22.88 | |
| 1–3 | 2.8016 × 10⁷ | 1.6677 | 13.03 | 21.50 | |
| 2 | 2–1 | 2.0673 × 10⁷ | 1.9153 | 17.00 | 30.22 |
| 2–2 | 4.8851 × 10⁸ | 2.4538 | 13.78 | 28.77 | |
| 2–3 | 8.5625 × 10⁸ | 2.2583 | 15.52 | 30.57 | |
| 4 | 4–1 | 1.3571 × 10⁷ | 2.1066 | 17.00 | 32.64 |
| 4–2 | 1.4220 × 10⁷ | 2.0735 | 16.84 | 31.38 | |
| 4–3 | 1.4038 × 10⁷ | 2.0718 | 16.56 | 30.84 | |
| Average value | 14.98 | 27.95 | |||
| Requirements of the EN13674-1 standard | max 17 m/Gc | max 55 m/Gc | |||
Rail steel grades_
| Grade | Hardness, HBW | Type of steel | Condition of the rail |
|---|---|---|---|
| R200 | 200 ÷ 240 | Carbon–manganese (C–Mn) | Raw |
| R220 | 220 ÷ 260 | Carbon–manganese (C–Mn) | Raw |
| R260 | 260 ÷ 300 | Carbon–manganese (C–Mn) | Raw |
| R260Mn | 260 ÷ 300 | Carbon–manganese (C–Mn) | Raw |
| R320Cr | 320 ÷ 360 | Alloyed (≤1.2% Cr) | Raw |
| R350HT | 350 ÷ 390 | Carbon–manganese (C–Mn) | Heat treated |
| R350LHT | 350 ÷ 390 | Low alloy (≤0.3% Cr) | Heat treated |
| R370CrHT | 370–410 | Alloyed (≤0.6% Cr) | Heat treated |
| R400HT | 400–440 | Carbon–manganese hypereutectoid (≤1% C) | Heat treated |
Rail steel parameters_
| Parameter | Condition of the rails | |
|---|---|---|
| Raw* | Heat treated | |
| Austenite grain size | 100 ÷ 120 µm | 20 ÷ 25 µm |
| Interlamellar spacing | 0.20 ÷ 0.25 µm | 0.09 ÷ 0.12 µm |
| HBW hardness | 270 ÷ 290 | 340 ÷ 390 |
Result of staircase method at vertical loading on rail profile 60E2-R350HT_
| Number of samples | Maximum stress (MPa) | Minimum stress (MPa) | Stress range σ o (MPa) | Executed load cycles | Result |
|---|---|---|---|---|---|
| 8–1 | 400 | 40 | 360 | 5,000,000 | Positive |
| 8–2 | 420 | 42 | 378 | 5,000,000 | Positive |
| 8–3 | 440 | 44 | 396 | 5,000,000 | Positive |
| 8–4 | 460 | 46 | 414 | 619,397 | Failure |
| 8–5 | 440 | 44 | 396 | 5,000,000 | Positive |
| 8–6 | 460 | 46 | 414 | 5,000,000 | Positive |
| 8–7 | 480 | 48 | 432 | 562,692 | Failure |
| 8–8 | 460 | 46 | 414 | 717,294 | Failure |
| 8–9 | 440 | 44 | 396 | 5,000,000 | Positive |
| 8-10 | 460 | 46 | 414 | 716,943 | Failure |
Chemical composition for individual melts [21]_
| Number of | Content mass in liquid state (%) | 10−4 % (ppm) | ||||||||||
|---|---|---|---|---|---|---|---|---|---|---|---|---|
| Sample | Melt | C | Mn | Si | P | S | Cr | Al max | V max | N max | O max | H max |
| 1 | 321,036 | 0.79 | 1.09 | 0.36 | 0.008 | 0.017 | 0.069 | 0.004 | 0.001 | 56 | 18 | 2.00 |
| 2 | 321,037 | 0.77 | 1.07 | 0.35 | 0.008 | 0.017 | 0.077 | 0.004 | 0.001 | 55 | 18 | 1.83 |
| 3 | 321,038 | 0.77 | 1.08 | 0.39 | 0.009 | 0.014 | 0.076 | 0.004 | 0.001 | 54 | 18 | 1.29 |
| 4 | 331,713 | 0.78 | 1.12 | 0.37 | 0.016 | 0.017 | 0.078 | 0.004 | 0.003 | 50 | 18 | 1.50 |
| 5 | 331,823 | 0.77 | 1.10 | 0.38 | 0.012 | 0.012 | 0.08 | 0.003 | 0.002 | 40 | 14 | 1.3 |
| 6 | 331,824 | 0.78 | 1.13 | 0.38 | 0.011 | 0.019 | 0.08 | 0.003 | 0.002 | 49 | 20 | 1.1 |
| 7 | 331,991 | 0.79 | 1.13 | 0.36 | 0.012 | 0.011 | 0.08 | 0.003 | 0.002 | 43 | 19 | 1.4 |
| 8 | 430,499 | 0.78 | 1.08 | 0.34 | 0.010 | 0.014 | 0.08 | 0.003 | 0.003 | 70 | 13 | 0.8 |
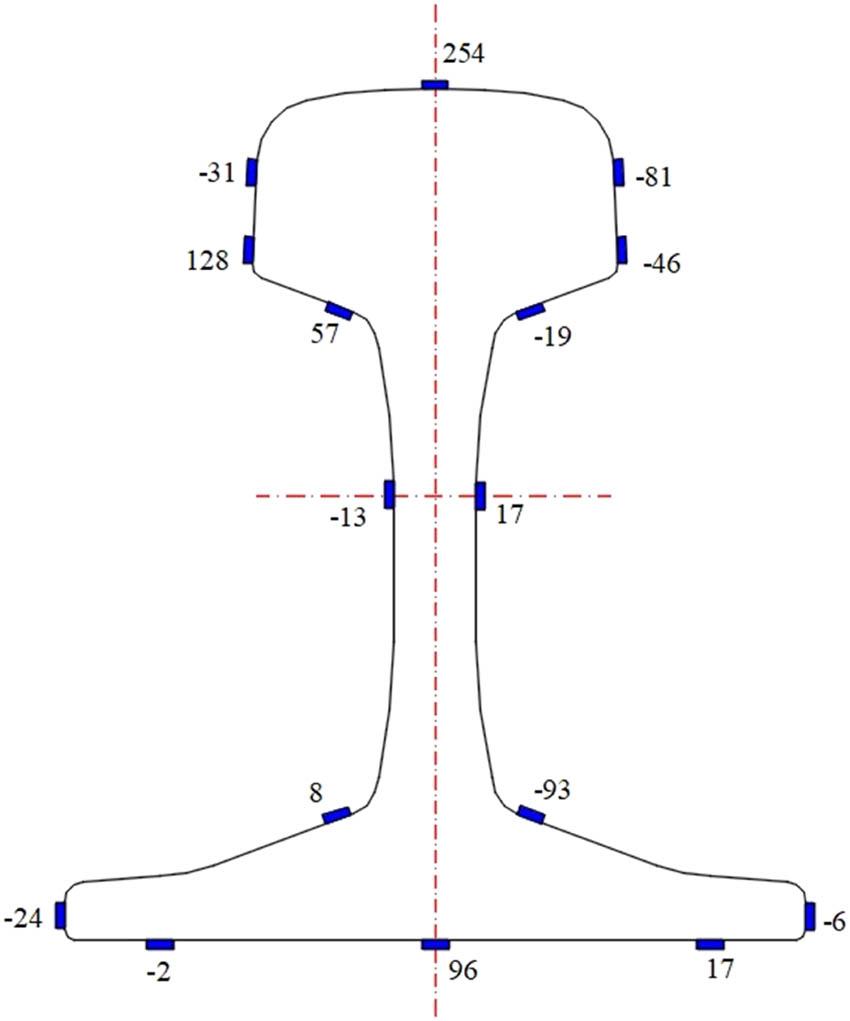
Results of residual stress measurements in the rail section taken from test 2_
| Number of sample | Strain gauge location | |||
|---|---|---|---|---|
| Foot | Head | Web point 1 | Web point 2 | |
| 2 | Deformation value after 1 cut, μm | |||
| −375 | −983 | 12 | 29 | |
| Deformation value after 2 cut, μm | ||||
| −422 | −1,225 | 36 | 51 | |
| Residual stress value, MPa | ||||
| 87 | 254 | −7 | −11 | |