Rails are a part of the railway superstructure that, while carrying high loads, must also ensure the safety of train traffic. Advances in rail production, particularly in steel metallurgy, such as the use of a combined blowing converter (TMB technology), the introduction of secondary steel treatment, and the use of continuous casting using immersion casting (eliminating secondary steel oxidation), have led to a change in the criteria for rail track service life. In the past, these criteria were based on manufacturing defects of metallurgical origin (primarily fatigue cracks and chipping on the running edge, known as shelling). Currently, the dominant defects are those that develop in the thin layer on the running surface, generated by fatigue processes occurring at the wheel-rail interface or resulting from changes in the rail material structure (local hardening of the running surface). Therefore, the wheel-rail interface is increasingly a parameter determining the operating costs of rail transport, and therefore, increasing attention is paid to ensuring the appropriate geometric characteristics of the rail profile, as well as its high properties and the selection of the rail microstructure. Pearlitic rails should be characterized by an appropriate pearlite morphology that provides resistance to the effects of diverse, yet synergistic, mechanisms that reduce the ductile properties of the running surface while simultaneously preventing changes in the railhead shape during operation [1]. Modern railway rails should have the following features:
-
–
long service life under all operating conditions (high speed, high loads, small radius bends);
-
–
appropriately modified pearlitic microstructure ensuring resistance to dynamic loads, plastic material flow, and abrasive wear;
-
–
resistance to the formation of rolling contact-fatigue defects (RCF) under given operating conditions;
-
–
minimal dimensional deviations from the nominal cross-section;
-
–
very good profile symmetry and high surface smoothness;
-
–
high homogeneity of chemical composition, low content of harmful elements, and low content of non-metallic inclusions;
-
–
high level of mechanical properties with small dispersion;
-
–
appropriate characteristics in terms of fracture toughness, fatigue strength, and fatigue crack growth rate; and
-
–
low residual stress inherited from the production process.
The standard [2] for railway rails covers nine grades of steel with seven hardness levels. All of these steels have a pearlitic structure obtained either by natural cooling or by accelerated cooling from the heat of rolling (heat treatment by reheating is also permitted). This approach is a consequence of remaining within the framework imposed by successive editions of the UIC860 Code [3], which sought to counteract rail wear by increasing the hardness and strength of rail steel. Grade development progressed from steel grade 700 with a hardness of 200 ÷ 240 HBW, through the introduction of grade 900A (hardness 260 ÷ 300 HBW), and then grade 1100 (hardness 320 ÷ 360 HBW). The strategy was based on reducing rail wear during a period when abrasive-adhesive wear was dominant, and among the various structures, pearlite possesses the highest abrasion resistance in wheel-rail contact conditions. However, wear resistance is not determined solely by hardness; it is primarily a property resulting from microstructural parameters, in particular the distance between cementite lamellae in pearlite, the thickness of the cementite lamellae, the grain size of primary austenite, and the proportion of ferrite in the structure. For pearlitic steel with a carbon content of approximately 0.70%, the microstructural parameters, depending on the extent of pearlitic transformation, are presented in Table 1 [4]:
Rail steel parameters.
| Parameter | Condition of the rails | |
|---|---|---|
| Raw* | Heat treated | |
| Austenite grain size | 100 ÷ 120 µm | 20 ÷ 25 µm |
| Interlamellar spacing | 0.20 ÷ 0.25 µm | 0.09 ÷ 0.12 µm |
| HBW hardness | 270 ÷ 290 | 340 ÷ 390 |
*raw – rails cooled naturally in the hall from the rolling heat.
It can be assumed that the grades proposed in the EN 13674-1:2011 + A1:2017 standard [2] allow for achieving the limiting properties of the pearlitic microstructure. Hardnesses above 450 HB are practically impossible to achieve. However, even when using rails with a high-strength pearlite structure, fatigue occurs due to the rolling of the wheels (RCF); there is a worldwide search for rails with higher strength properties without reduced plastic properties, while also being resistant to RCF crack formation. EN 13674-1 standard [2] includes the following steel grades specified in Table 2. The R350HT grade discussed in this article is the lowest hardness grade of rail steel intended for heat treatment, yet it provides four times the abrasion resistance of the non-heat-treated R260 grade. The highest hardness grade, R400HT, offers more than six times the abrasion resistance of the standard R260 grade, but its use is limited to tracks subject to very high loads, such as ore tracks. Therefore, the R350HT grade has the greatest practical application in railway infrastructure, ensuring long rail life and economically viable applications.
Rail steel grades.
| Grade | Hardness, HBW | Type of steel | Condition of the rail |
|---|---|---|---|
| R200 | 200 ÷ 240 | Carbon–manganese (C–Mn) | Raw |
| R220 | 220 ÷ 260 | Carbon–manganese (C–Mn) | Raw |
| R260 | 260 ÷ 300 | Carbon–manganese (C–Mn) | Raw |
| R260Mn | 260 ÷ 300 | Carbon–manganese (C–Mn) | Raw |
| R320Cr | 320 ÷ 360 | Alloyed (≤1.2% Cr) | Raw |
| R350HT | 350 ÷ 390 | Carbon–manganese (C–Mn) | Heat treated |
| R350LHT | 350 ÷ 390 | Low alloy (≤0.3% Cr) | Heat treated |
| R370CrHT | 370–410 | Alloyed (≤0.6% Cr) | Heat treated |
| R400HT | 400–440 | Carbon–manganese hypereutectoid (≤1% C) | Heat treated |
The above table shows that the hardness level of steel is determined by the content of C, Mn, and Cr additions, as well as heat treatment procedures. Compared to UIC Code 860 [3], standard [2] lowers the permissible levels of P and S and introduces new limits for the content of admixture elements for individual rail steel grades: Cr, Ni, Mo, Cu, Sn, Sb, Al, V, Ti, and Nb. Establishing the permissible content of O, N, and H gases in steel is also a crucial element. All of the above-mentioned limits are implemented to increase rail durability and minimize the likelihood of various forms of cracking. The provisions of standards, technical specifications, railway company regulations, and customer demands create new conditions for documenting the above characteristics by providing the manufacturer with:
-
–
a rail testing system independent of the human factor in terms of internal quality, surface quality, and geometry;
-
–
the ability to determine individual chemical components throughout the entire steel and rail manufacturing process;
-
–
test results of the stress intensity factor, fatigue strength, fatigue crack growth rate, and residual stress performed by centres independent of the manufacturer;
-
–
test results of rail performance properties such as operational reliability, service life, lateral and vertical wear, rail damage analysis, etc.;
-
–
quality tests of flash-welded and aluminothermic joints.
To summarize the above, it should be emphasized that, in addition to appropriate technical equipment, a high level of technology, and a quality assurance system, the manufacturer must conduct continuous testing of rail properties also outside its own production facility. This is particularly important when developing new rail production technology, such as new grades of rail steel. This is not only dictated by the formal and legal requirements contained in the relevant standards or railway company procedures, but also stems from the manufacturer’s responsibility for its product. The purpose of this article is to present a wide range of test results conducted by the manufacturer and a number of external research institutions, both domestic and foreign, for heat-treated rails of the R350HT steel grade. These tests allowed for a comprehensive assessment of the quality of R350HT rails from the new railhead heat treatment line launched at the ArcelorMittal Poland S.A. Dabrowa Gornicza Branch. This line was implemented as a result of the research and development project POIR.01.01.01-00-0438/18, co-financed by the National Centre for Research and Development Poland. The demonstration line enables heat treatment of rail heads by accelerated cooling of the rail heads in a water–polymer mixture while simultaneously blowing a water–air mixture onto the rail foot to compensate for residual stress and achieve the straightest possible rail after the heat treatment process. The available literature includes studies broadly analysing the impact of heat treatment parameters on the obtained level of rail properties [5–9], analyses of microstructure parameters of heat-treated rails, taking into account the prediction of their level on the operational properties of rails [10–14], as well as studies devoted to determining stress intensity factor in rail steel [15–18], publications on fatigue tests are also interesting [19–21]. However, there is no comprehensive summary of all types of tests in the field of qualifying tests provided for in the standard [2] and other requirements of railway companies, along with a discussion of their mutual correlation in terms of the operational properties of rails. This work describes the test procedure for the entire scope of qualifying tests, presents the results of tests of mechanical properties, assessment of macro and microstructure, and residual stress, and presents the level of fatigue tests obtained and stair method test according to the Deutsche Bahn standard [22] on a 60E1/60E2 rail profile in the R350HT steel grade. Current transport trends include the pursuit of higher passenger speeds and increased axle loads for freight wagons while maintaining a high level of safety. Transport economics and its competitiveness with other modes of transport for transporting people and goods increase the demands placed on railway products. Market expectations boil down to the availability and installation of rails characterized by long service life in all operating conditions. Heat-treated rails are characterized by greater wear resistance, resulting in longer rail service life in adverse conditions such as track curves, high axle loads, or high speeds. They also exhibit increased resistance to brittle fracture, resulting in a more durable and safer product. Therefore, presenting the latest rail production technologies meets the expectations of a wide range of rail users and specialists in this field. Furthermore, this article fills a gap in publications that would provide a comprehensive analysis of the microstructure, mechanical properties, and results of qualification and extended tests resulting from the regulations of some railway companies, while also highlighting key rail parameters that determine their operational reliability.
Implementing the production of a new type of rail, heat-treated rails, first required conducting a series of experiments under industrial conditions to select the optimal heat treatment technology and confirm the basic properties of the rails through acceptance tests in accordance with Section 9 of the standard [2]. These tests primarily include assessing the hardness level on the running surface and cross-section of the rail, determining the mechanical properties and oxide cleanness of the steel, and assessing the macrostructure. This range of tests, conducted in the manufacturer’s laboratory, allows for preliminary verification of the heat treatment technology used and compliance with the rail properties requirements. The next stage involved extended tests carried out as part of the NCBR project by subcontractors: the Łukasiewicz Network – Upper Silesian Institute of Technology in Gliwice, Poland, the Silesian University of Technology in Katowice, Poland, and the University of Science and Technology in Krakow, Poland. These tests allowed for a thorough assessment of the rail quality, including pearlite morphology analysis and fatigue testing, performed on a significantly larger number of samples than required by the standard [2] to verify various variants of rail heat treatment parameters. The positive results of the tests conducted as part of the project were the basis for initiating qualifying tests according to point 8 of the standard [2] at a body authorized to perform this type of testing, i.e. the Railway Institute in Warsaw, Poland, in cooperation with the Idonial Avilés Institute in Spain. Qualifying testing is a mandatory requirement of the standard [2] and determines the sale of rails. However, some railway companies, such as Polish State Railways and Deutsche Bahn, have introduced procedures that encompass a range of additional tests necessary before approving a new product for use on railway tracks managed by them [22–24]. Therefore, the process of evaluating a new product, such as a rail made of a given steel grade, is multi-stage, encompassing a series of diverse tests determining the required rail properties. These tests are conducted in various laboratories, primarily external laboratories independent of the manufacturer, prior to the decision to approve the new product for use on railway tracks.
The test material was R350HT rail steel with a chemical composition consistent with the melt analyses for individual melts presented in Table 3 [21]. The test samples were obtained from rails heat-treated according to the developed technology and manufactured at the ArcelorMittal Poland S.A. heavy section rolling mill on a demonstration heat treatment line using accelerated railhead cooling in a water–polymer mixture. The following heat treatment parameters were used:
-
–
immersion start temperature 810°C;
-
–
immersion time 130 s;
-
–
polymer concentration 11.8%;
-
–
polymer flow 1,000 m3/h.
Chemical composition for individual melts [21].
| Number of | Content mass in liquid state (%) | 10−4 % (ppm) | ||||||||||
|---|---|---|---|---|---|---|---|---|---|---|---|---|
| Sample | Melt | C | Mn | Si | P | S | Cr | Al max | V max | N max | O max | H max |
| 1 | 321,036 | 0.79 | 1.09 | 0.36 | 0.008 | 0.017 | 0.069 | 0.004 | 0.001 | 56 | 18 | 2.00 |
| 2 | 321,037 | 0.77 | 1.07 | 0.35 | 0.008 | 0.017 | 0.077 | 0.004 | 0.001 | 55 | 18 | 1.83 |
| 3 | 321,038 | 0.77 | 1.08 | 0.39 | 0.009 | 0.014 | 0.076 | 0.004 | 0.001 | 54 | 18 | 1.29 |
| 4 | 331,713 | 0.78 | 1.12 | 0.37 | 0.016 | 0.017 | 0.078 | 0.004 | 0.003 | 50 | 18 | 1.50 |
| 5 | 331,823 | 0.77 | 1.10 | 0.38 | 0.012 | 0.012 | 0.08 | 0.003 | 0.002 | 40 | 14 | 1.3 |
| 6 | 331,824 | 0.78 | 1.13 | 0.38 | 0.011 | 0.019 | 0.08 | 0.003 | 0.002 | 49 | 20 | 1.1 |
| 7 | 331,991 | 0.79 | 1.13 | 0.36 | 0.012 | 0.011 | 0.08 | 0.003 | 0.002 | 43 | 19 | 1.4 |
| 8 | 430,499 | 0.78 | 1.08 | 0.34 | 0.010 | 0.014 | 0.08 | 0.003 | 0.003 | 70 | 13 | 0.8 |
The first element of the test was the generation of a time-temperature-transformation (TTT) diagram for a chemical composition corresponding to the range for the R350HT grade. The graph indicates that the rail cooling rate should be within 1–2°C/s. In industrial practice, in order to obtain the appropriate refinement of the pearlitic structure, the rail cooling rate is kept in the upper range of the given range. This ensures the avoidance of bainite precipitation and the achievement of a pearlite hardness of HV in the range of 370–400. The TTT diagram is shown in Figure 1.
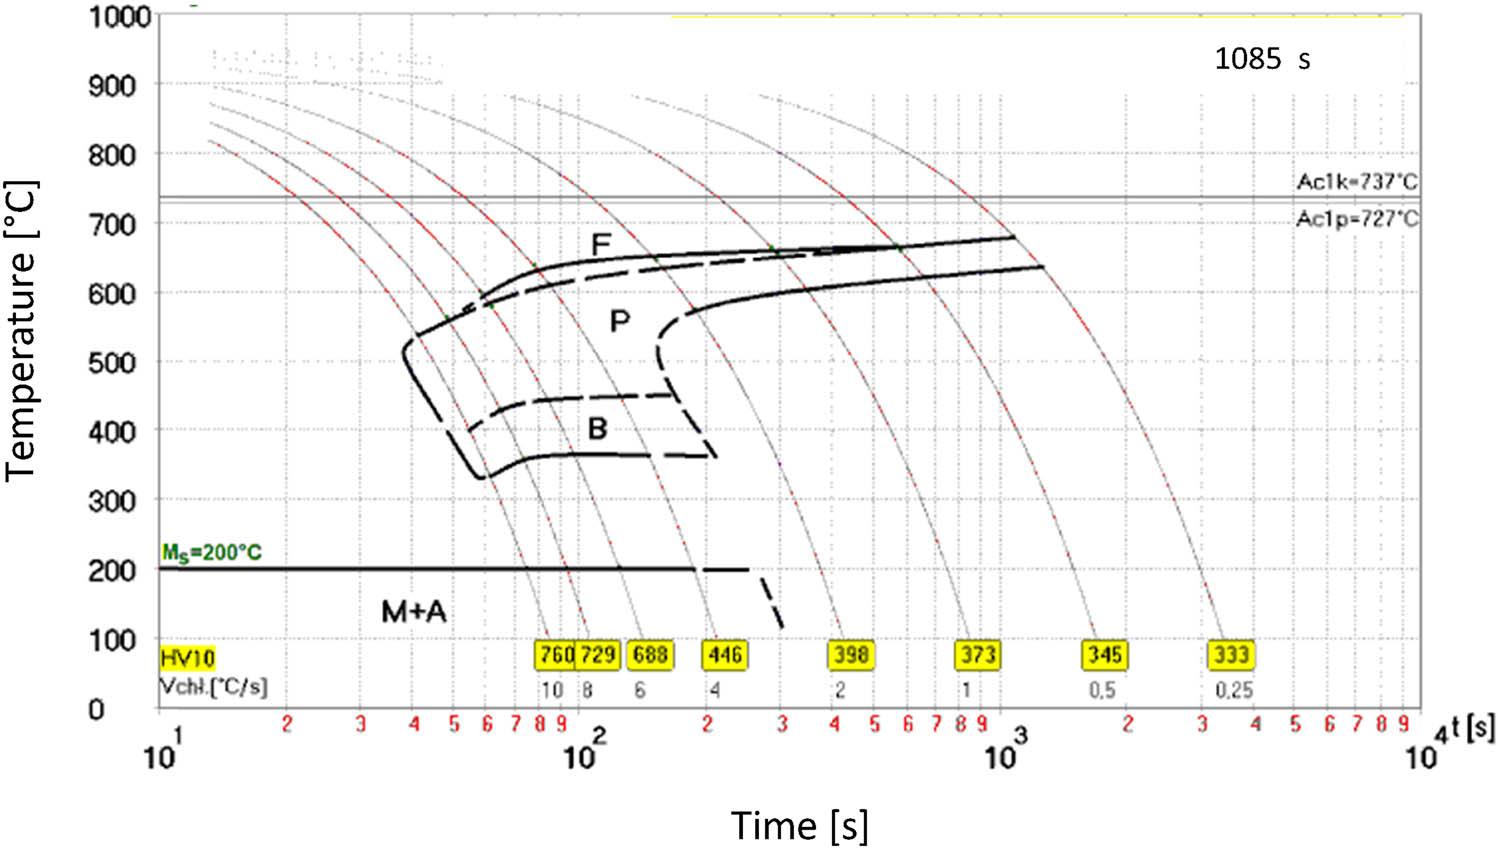
TTT diagram for the R350HT grade.
For the selected heat treatment parameters, finely lamellar pearlite was obtained, characterized by an average interlamellar distance in pearlite measured at the head corner of 95 nm.
The rails used for the tests had the properties given in Table 4 [21]. The parameters: R m, R p0.2, A, and the hardness on the rolling surface were determined in accordance with the standard [2]. The hardness testing methodology is described in the standard [2] and defines the Brinell hardness measurement method using a ball with a diameter of 2.5 mm and a pressure force of 187.5 N according to the EN ISO 6506-1 standard [25] as the predetermined method.
Basic properties of the tested rail steel for individual rail types [21].
| Number of sample | Basic mechanical properties | ||||
|---|---|---|---|---|---|
| Tensile strength, R m, MPa | Yield strength R p0.2, MPa | Elongation A, % | Necking Z, % | Hardness, HB | |
| 1 | 1,286 | 881 | 9.1 | 18 | 376 |
| 2 | 1,249 | 854 | 10.3 | 22 | 365 |
| 3 | 1,238 | 875 | 10.9 | 23 | 363 |
| 4 | 1,262 | 877 | 10.7 | 22 | 366 |
| 5 | 1,284 | 904 | 11.2 | 23 | 364 |
| 6 | 1,270 | 899 | 10.4 | 23 | 367 |
| 7 | 1,293 | 885 | 11.5 | 21 | 370 |
| 8 | 1,273 | 880 | 10.9 | 19 | 366 |
An example image of the microstructure on the cross-section obtained after industrial hardening tests of the corner of the rail head is shown in Figure 2. The structure of the tested rails was fully pearlitic. The size of the pearlite colony in the head was in the range of 3.4–9.28 µm. Average size of perlite colony in the rail head was 6.34 µm. The measurements of the perlite colony size were carried out using specialist μgrain computer software. The correctness of the structure was checked on all discussed samples numbered 1–8, which were the subject of the evaluation of the tests; in no case were undesirable bainite or martensite precipitations recorded, which indicates the consistency and effectiveness of the heat treatment process and its repeatability leading to obtaining fine-lamellar pearlite on the entire cross-section of the rail head.
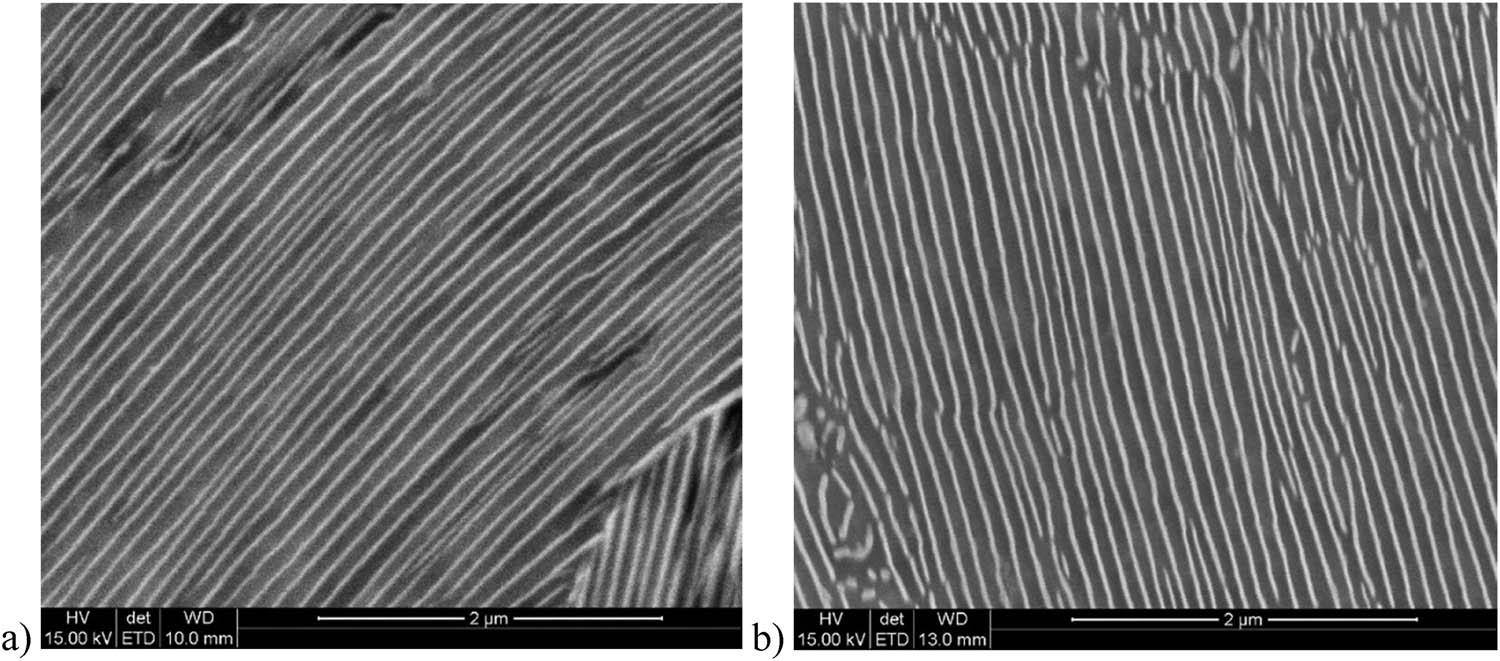
Image of the microstructure at the corner of the rail heads after heat treatment: (a) rail from melt no. 321036, and (b) rail from melt no. 321037.
For heat-treated rails, in addition to measuring the hardness on the running surface, it is also necessary to measure the hardness on the cross-section of the rail head at points precisely defined by the standard, shown in Figure 3(a). The study of the hardness distribution across the rail cross-section stems from the need to determine the hardness gradient in the internal area of the rail head to ensure a minimum hardness level at defined points for operational reasons. The hardness level obtained on the rail head cross-section of sample number 4 is shown in Figure 3(b). As can be seen, this sample has an average hardness of 375 HBW on the running surface. A slight hardness drop is observed at distances of 10 and 20 mm from the running surface, as well as a symmetrical hardness distribution about the vertical axis of the rail. This hardness distribution is beneficial from the perspective of rail use because it ensures uniform rail wear during track operation. This is due to the fact that the rail head is not only hardened in the near-surface layer but also exhibits a high level of hardness across the entire cross-section.
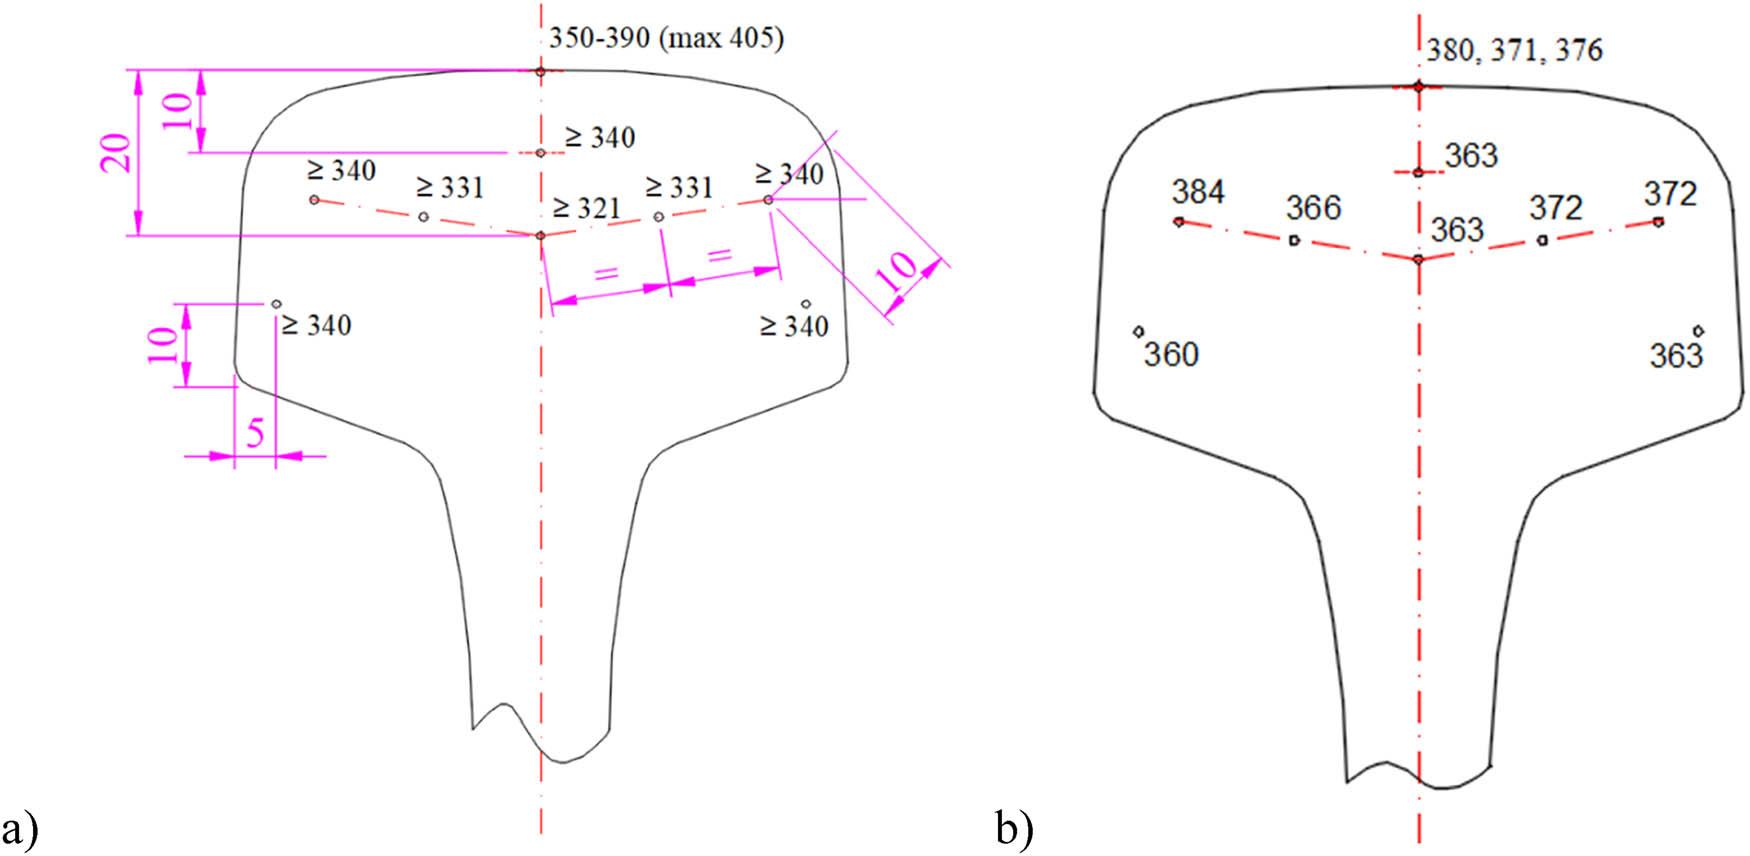
Hardness distribution on the cross-section of the rail head for the R350HT grade according to the standard [2] (a), hardness distribution on the cross-section of the rail head – sample 4 (b).
The experimental procedure for different types of fatigue tests is presented as follows:
For steel grade R350HT, the minimum single K Ic value should be greater than 30 MPa m1/2, and the minimum average value should exceed 32 MPa m1/2. The determination of the stress intensity factor shall be performed in accordance with the procedure described in ASTM E399 [26], except that those requirements are superseded by those specified in Annex B of the standard [2] and apply only to the determination of the plane strain fracture toughness of rail grade steels defined in this standard. The initial fatigue crack of the sample should be generated in the temperature range +15 to +25°C using a stress factor in the range > 0 < +0.1. Initial fatigue cracking occurs at a cycle frequency ranging from 15 to 120 Hz. The ratio of the total crack length to the sample width should be from 0.45 to 0.55, and during the last 1.25 mm of crack growth, K max is required to be in the range of 18–22 MPa m1/2. A bending specimen with a single notch on the edge is loaded with displacement control using a three-point bending method. The support spacing is defined as four times the width (W) of the sample. The test should be carried out at a temperature of −20°C ± 2°C. Samples with the following dimensions were used: length of 210 mm, width of 20 mm, height of 40 mm.
The test is performed in accordance with the general requirements contained in the ISO 12108 Standard [27]. The fatigue crack growth rate (m/Gc) for the parameter ΔK = 10 MP m1/2 should not exceed the following values for R350HT steel: 17 m/Gc, while for the parameter ΔK = 13.5 MP m1/2 it should not be greater than the value of 55 m/Gc. A minimum of three tests shall be performed for each rail under the following conditions:
-
–
test temperature range +15 to +25°C;
-
–
ratio of minimum cyclic load to maximum cyclic load R = 0.5;
-
–
the load cycle frequency should be in the range of 15–40 Hz; and
-
–
the spacing of supports for the three-point bending of the sample is to be 4 W.
Samples with the following dimensions were used: length 230 mm, width 20 mm, and height 45 mm.
It should be performed at constant amplitude in accordance with the ISO 1099 standard [28]. A minimum of three tests are required for each rail under the following conditions:
-
–
test temperature range: +15 to +25°C;
-
–
the variability of the axial strain amplitude should be controlled;
-
–
the deformation cycle should be symmetrical with respect to the initial, zero load.
The qualification criterion is as follows: for a total strain amplitude of 0.00135, the durability of each sample should be greater than 5 × 10⁵ cycles. The durability is determined by the number of cycles until the complete separation of the tested sample. Fatigue tests were carried out on the Inova FU 250 testing machine, at room temperature, on nine cylindrical samples made in accordance with the standard [2]. The samples for fatigue strength testing came from three different melts. Dynamic axial loads of about zero were applied with an amplitude of 0.00135 and a frequency of 15 Hz, the number of cycles was 5 million, the test temperature was 22.29°C ± 1°C, and no sample cracked during the test.
-
–
Tests should be performed based on Annex J of EN 14730-1:2017 [29] using the staircase method.
-
–
Samples should be taken from new, rolled rails; the rail surface must not be machined in any way. Surface roughness is determined in accordance with EN ISO 4287 [30] at the centre of the sample, over a measuring section at least 100 mm long along the centre axis of the rail foot before the form strength test. The mean roughness value R a of the individual measuring sections and the average value of the individual measuring sections should be documented.
-
–
Determine and document the average fatigue strength value. A minimum fatigue strength value is not required. If calculating the calibration curve is not required, the force levels for the selected support span should be selected so that the theoretical moment of the specified profile produces a stress at the rail root edge in increments of 10 MPa. Start the test with a stress value of 400 MPa.
-
–
A sinusoidal cyclic load should be applied depending on the force.
-
–
Loading frequency f = 4 (±1) Hz.
-
–
Failure of the sample to crack after 5 million cycles increases the maximum stress in the next test by Δσ = 10 MPa; cracking of the sample reduces the maximum stress by Δσ = 10 MPa.
The spacing of the lower supports and force application points is shown in Figure 4.
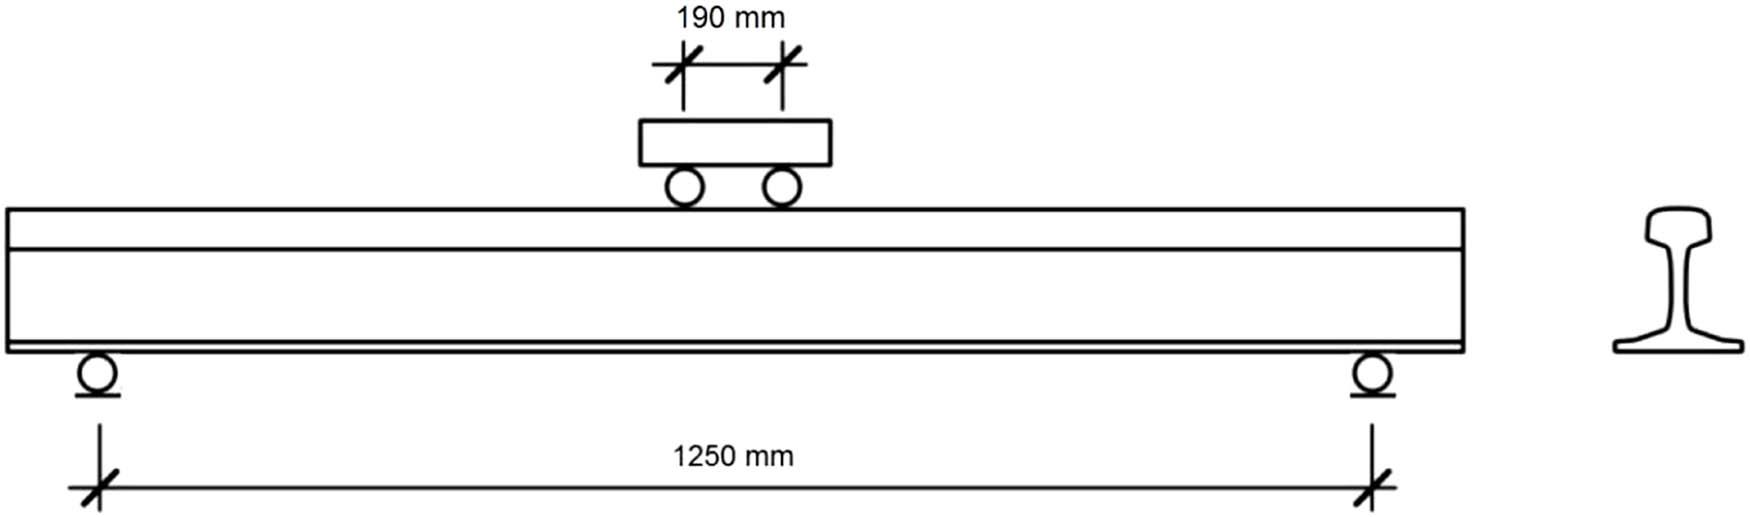
Spacing of supports and force application points for fatigue strength in the vertical plane.
-
–
Tests should be performed based on Annex J of EN 14730-1:2017 [29].
-
–
The rail is placed on supports after being rotated 90° around its longitudinal axis. The inner and outer spans remain unchanged. Supports and force application points should be distributed according to the rail contour along the entire height of the profile, ensuring a stable, form-fit connection.
For the inner span W, the following applies: 150 mm ≤ W ≤ 190 mm, and for the outer span L, the following applies: 1,250 mm ≤ L ≤ 1,450 mm.
-
–
The strain gauge should be mounted centrally on the side of the rail foot, on the side opposite the load application. A strain gauge with a nominal resistance of 350 Ω and an extension length of 6 mm is used. The extension factor must be known with a 1% error limit. Three identical strain gauges should be mounted on a different piece of rail made of the same grade of steel.
-
–
Samples should be taken from newly rolled rails; the rail surface must not be machined in any way. Surface roughness is determined in accordance with EN ISO 4287 [30] at the centre of the sample, over a measuring section at least 100 mm long along the rail foot edge before the profile strength test. The average roughness value R a of the individual measuring sections and the mean value of the individual measuring sections should be documented.
-
–
The average fatigue strength value should be determined and documented. A minimum fatigue strength value is not required. If calculating the calibration curve is omitted, the force levels for the selected support span should be selected so that the theoretical required profile moment produces a stress at the rail root edge in steps of 20 MPa.
-
–
Start the test with a stress value of 400 MPa for the R350HT grade.
-
–
Apply a sinusoidal, cyclic load depending on the force.
-
–
Load frequency f = 4 (±1) Hz.
-
–
If the sample fails to crack after 5 million cycles, the maximum stress in the next test increases by Δσ = 20 MPa. If the sample cracks, the maximum stress decreases by Δσ = 20 MPa.
The spacing of the lower supports and force application points is shown in Figure 5.
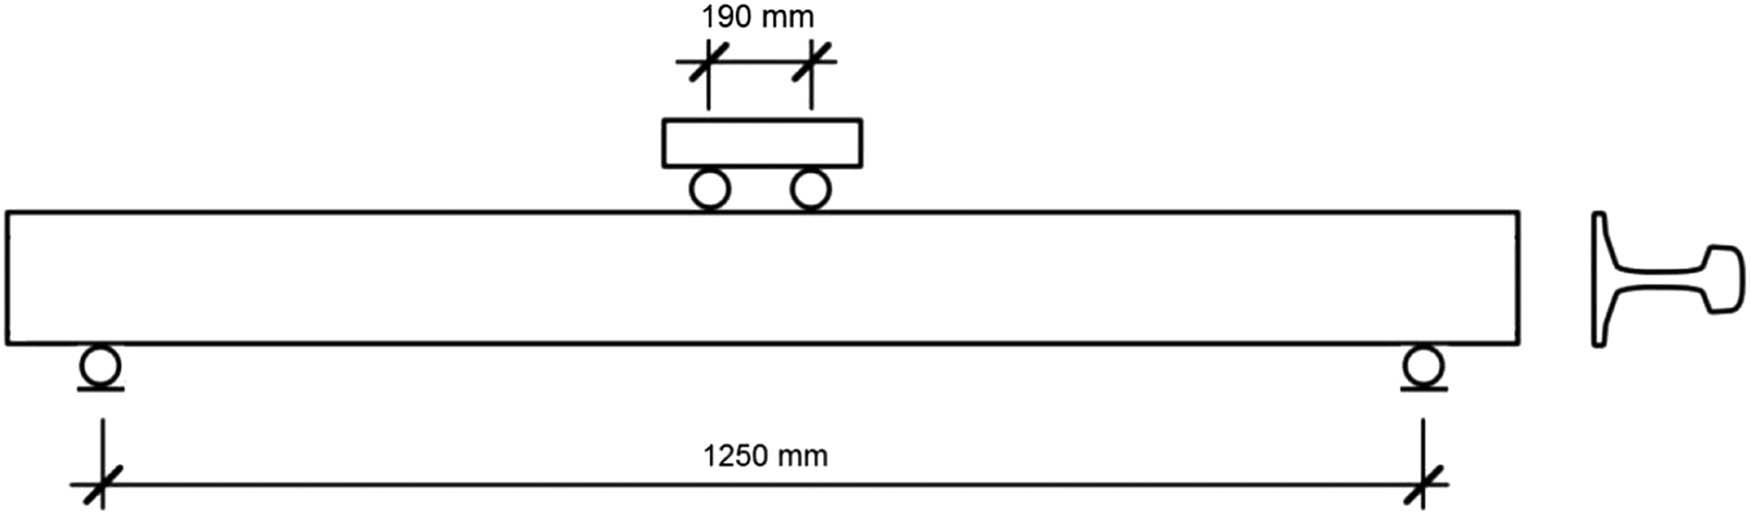
Spacing of supports and force application points for fatigue strength in the vertical plane.
After installing the heat treatment line, the following approaches were adopted to assess the quality of rails subjected to railhead hardening. Industrial experiments were conducted for three types of rails: the heaviest rail produced according to standard [2], 60E1/60E2, the average unit weight of the 54E4 rail, and the lightest produced profile, 49E1, at three different heat treatment start temperatures, with other process parameters remaining constant: immersion time, water–polymer mixture concentration, cooling medium temperature, and coolant flow. This approach aimed to determine the permissible temperature range for which the desired range of properties could be achieved. For example, for the 60E1/60E2 profile, substitute start temperatures of 830, 810, and 790°C were used. These studies were conducted by the Łukasiewicz Research Network – Upper Silesian Institute of Technology, and, in the field of fatigue testing, by the Silesian University of Technology and the AGH University of Science and Technology. They covered the following scope:
-
–
hardness testing on the running surface and cross-section of the rail head;
-
–
static tensile testing;
-
–
KV2 impact testing at 20°C in the rail head and foot;
-
–
microstructure assessment in the rail head and foot;
-
–
tensometric testing of residual stress in the foot, head, and on both sides of the rail web along the rail’s neutral axis;
-
–
determination of the stress intensity factor for samples from each temperature variant;
-
–
fatigue crack growth rate; and
-
–
fatigue strength test.
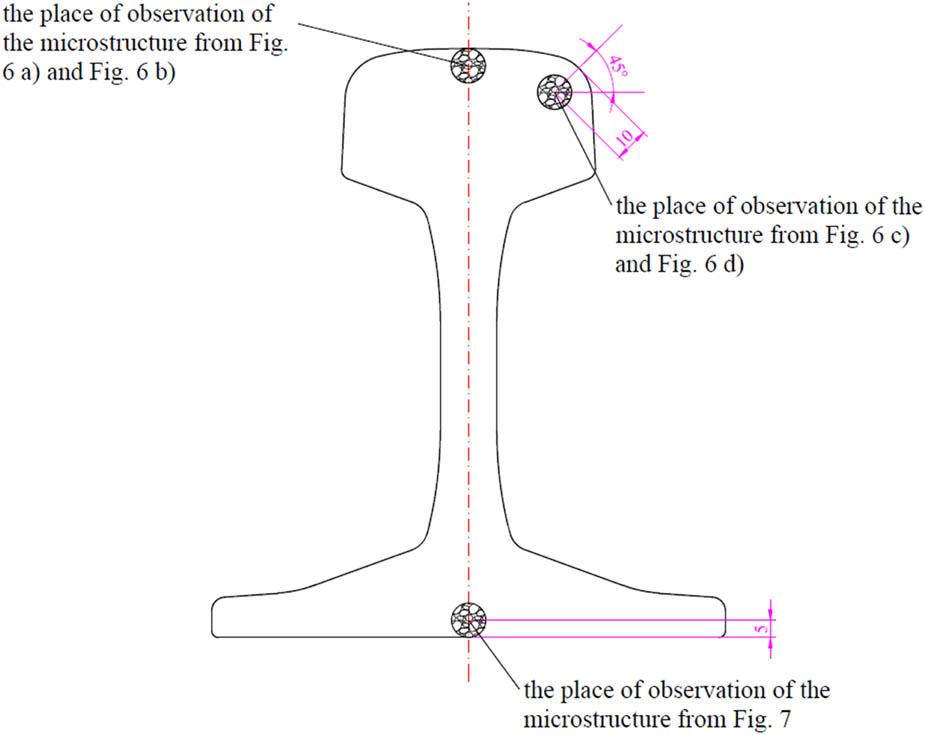
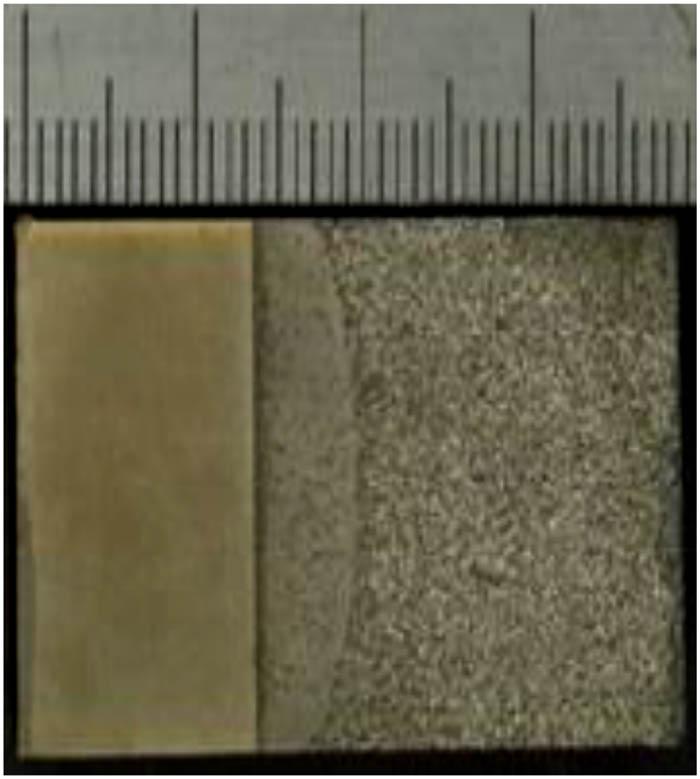
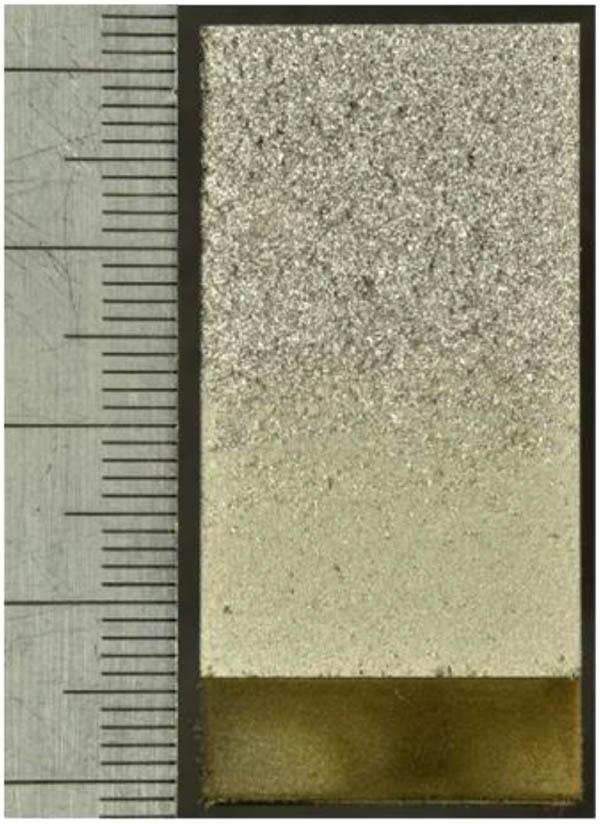
An example image of the microstructure of sample no. 2, obtained from light microscopy observations in the near-surface area of the rail head and at a distance of 10 mm from the rail head corner, in accordance with the guidelines of the standard [2], is presented in Figure 6. Figure 7 shows the microstructure in a cross-section in the area of the rail foot centre at a distance of 5 mm from the surface. A graphical illustration of the places on the rail for which the microstructure was observed is presented in Figure 8. On all rails subjected to industrial experiments, a pearlitic structure was observed in both the rail head and rail foot areas. The control of the microstructure in the rail foot is justified by the sequential cooling of the rail foot during the heat treatment of the rail head to compensate for residual stress after the heat treatment process, and is of an informative nature. Table 5 presents average values of fatigue strength and rolling surface hardness for three different heat treatment initiation temperatures. Based on the obtained results, the 810°C heat treatment variant can be identified as optimal due to achieving the highest mean yield strength with similar elongation and hardness results. One-meter sections were taken from each tested rail to assess residual stress levels using the strain gauge method. Standard [2] defines the location for residual stress measurement at the centre of the rail foot symmetry axis, but the tests conducted at this stage of rail heat treatment technology verification were additionally extended to include measurement of residual stress at the rail head symmetry axis and on both sides of the rail web at the rail neutral axis. This approach provides a better picture of the residual stress distribution around the rail perimeter to assess its symmetry. An example summary of the measured values of residual stress in various parts of the rail is presented in Table 6. In relation to the requirements of the standard [2], i.e. the measurement of residual stress in the rail foot, the following range of stress was obtained for individual rail profiles:
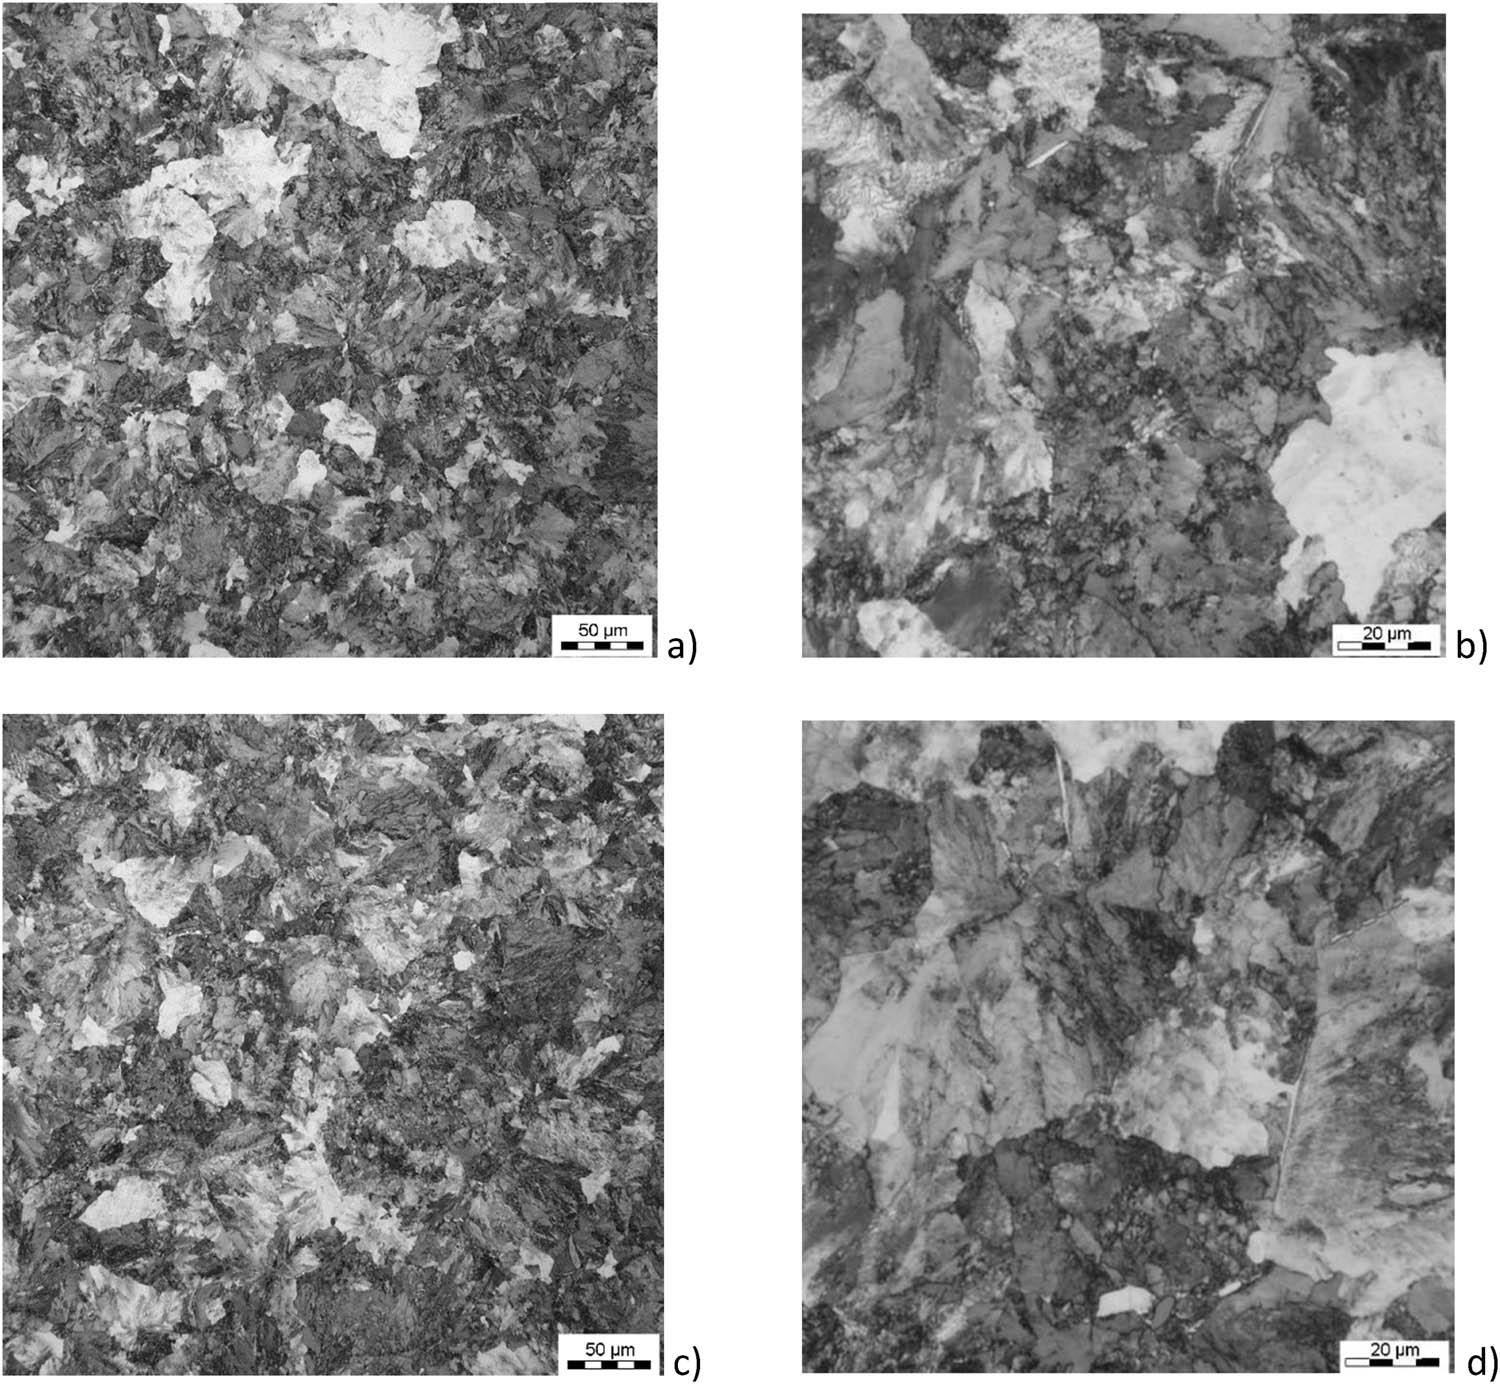
Microstructure of R350HT steel in the cross-section of the rail head corner – sample no. 2 after industrial head hardening tests: (a) and (b) near-surface area, (c) and (d) area 10 mm below the surface; pearlitic structure, light microscope.
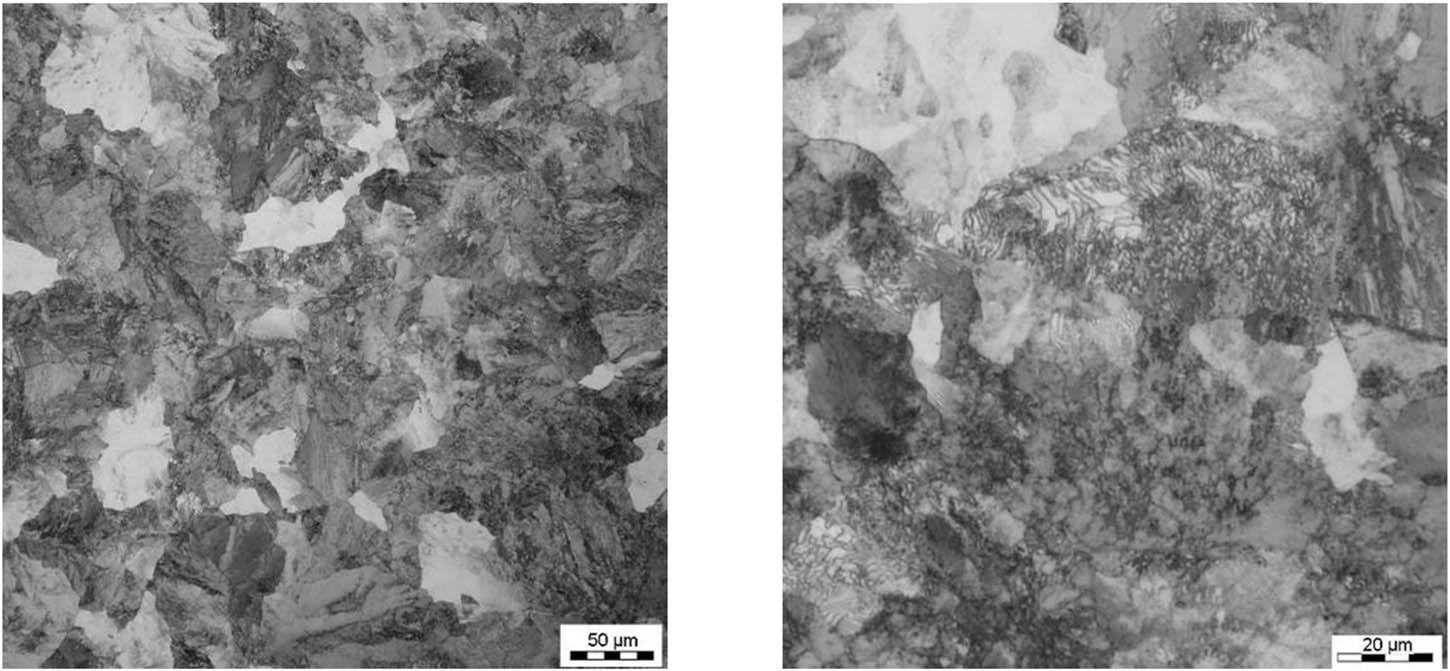
Microstructure in the cross-section in the area of the foot centre (5 mm below the surface) – sample 2 after industrial tests; pearlitic structure, light microscope.
Averaged results of mechanical properties tests and hardness measurements on the running surface of industrially manufactured 60E1/60E2 profile rails made of R350HT steel.
| Number of samples | Cooling start temperature, °C | R p0.2, MPa | R m, MPa | A, % | Z, % | Impact strength KV2 at 20°C, J/cm2 | HBW hardness on the rolling surface – (RS)* | |
|---|---|---|---|---|---|---|---|---|
| Head | Foot | |||||||
| 1 | 830 | 724 | 1,228 | 10.2 | 19.4 | 12.7 | 10.1 | 362.1 |
| 1 | 810 | 732.2 | 1239.2 | 10.3 | 17.5 | 10.3 | 10.7 | 361.0 |
| 2 | 790 | 699.7 | 1264.3 | 9.7 | 17.1 | 10.7 | 10.7 | 367.1 |
*The measurement was carried out after removing a 0.5 mm layer.
Results of residual stress measurements in the rail section taken from test 2.
| Number of sample | Strain gauge location | |||
|---|---|---|---|---|
| Foot | Head | Web point 1 | Web point 2 | |
| 2 | Deformation value after 1 cut, μm | |||
| −375 | −983 | 12 | 29 | |
| Deformation value after 2 cut, μm | ||||
| −422 | −1,225 | 36 | 51 | |
| Residual stress value, MPa | ||||
| 87 | 254 | −7 | −11 | |
60E1/60E2: 79–111 MPa
54E4: 69–95 MPa
49E1: 40–63 MPa
A clearly observable decrease in residual stress is observed with a decrease in the unit mass of the rail. Even for the heaviest 60E1/60E2 profile, the average stress level was 100 MPa, which is two and a half times lower than the value permitted by the standard [2].
The next stage of the research involved performing fatigue tests on a number of samples several times larger than the requirements of the standard [2]. The results of these tests are presented in Table 7. It is important to emphasize the high level of the stress intensity factor, the average value for all tests was 41 MPa m1/2, and the very good results of fatigue crack growth rate for both the ΔK = 10 MPa m1/2 and ΔK = 13.5 MPa m1/2 criteria. In the case of fatigue strength tests, all samples withstood the required load of 5 million cycles without fracture, while one sample was subjected to fatigue tests up to 50 million cycles. The sample passed this test without fracture.
Summary of average fatigue test results and residual stress in the rail foot from tests 1 and 2.
| Type of study | Obtained result (average value) | Requirements according to EN 13674-1 |
|---|---|---|
| K Ic coefficient | 41 MPa m1/2 | 32 MPa m1/2 |
| 27 samples 60E1, 54E4, 49E1 | ||
| Fatigue tests | 10 × 106 cycles | 5 × 10⁶ cycles |
| 27 samples 60E1, 54E4, 49E1 | ||
| Fatigue tests | 50 × 106 cycles | — |
| 1 sample 60E1 | ||
| Fatigue crack growth rate | 6.12 m/Gc | 17 m/Gc for ΔK = 10 MPa m1/2 |
| 27 samples 60E1, 54E4, 49E1 | ||
| Fatigue crack growth rate | 15.02 m/Gc | 55 m/Gc for ΔK = 13.5 MPa m1/2 |
| 27 samples 60E1, 54E4, 49E1 |
The European rail standard [2] specifies the following types of qualification tests:
-
–
fracture toughness (K Ic determination);
-
–
fatigue crack growth rate (da/dN determination);
-
–
fatigue strength (number of cycles to sample failure);
-
–
measurement of residual stress in the rail foot;
-
–
Baumann test; and
-
–
testing hardness changes on the rail running surface.
Qualification tests are always performed by external institutions designated to conduct this type of testing. The qualification tests described below for the 60E1 rail made of R350HT steel grade were performed by the Polish Railway Institute in cooperation with the Idonial Institute in Spain. The test materials consisted of rails from melts designated as test s1–4, with the chemical composition given in Table 3 and the basic mechanical properties presented in Table 4.
The determination of the stress intensity factor was carried out according to the procedure described in the ASTM E399 standard [26], taking into account the limitations imposed by the EN13674-1 standard [2]. The tests were performed on a total of 15 samples from 3 different rails. Test results in accordance with the standard [2] should be presented as K Ic, K Q* values, or K Q values, where K Q* values are those K Q values that do not meet the correctness criteria due to one or more of the following criteria:
-
(1)
P max/P Q > 1,1;
-
(2)
Exceeding the criterion 2.5 (K Q/R p0.2);
-
(3)
Displacement-crack opening force relationship.
Mean values and standard deviations for both K Ic and K Q* values should be recorded. The value used for the acceptance criteria is the average K Ic value and should be based on at least five K Ic values. If five K Ic values are not obtained, any K Q* values should be included in the acceptance criterion along with the average K Ic values. However, in this case, the measurement results should be based on a minimum of 10 measurements. The research results are presented in Table 8 [21].
Fracture toughness tests [21].
| Number of specimens | Fracture toughness K Ic, MPa m1/2 | Average value K Ic, MPa m1/2 | Standard deviation K Ic, MPa m1/2 | |
|---|---|---|---|---|
| 1 | 1–1 | 46.2 | 43.0 | 2.7 |
| 1–2 | 45.4 | |||
| 1–3 | 40.3 | |||
| 1–4 | 40.7 | |||
| 1–5 | 42.3 | |||
| 2 | 2–1 | 39.9 | 40.1 | 1.1 |
| 2–2 | 40.8 | |||
| 2–3 | 40.4 | |||
| 2–4 | 38.3 | |||
| 2–5 | 41.2 | |||
| 3 | 3–1 | 39.2 | 39.9 | 1.5 |
| 3–2 | 40.3 | |||
| 3–3 | 37.6 | |||
| 3–4 | 41.3 | |||
| 3–5 | 41.0 | |||
| Requirements according to EN13674-1 for the R350HT grade | Single min. value 30 MPa m1/2 | Average value min 32 MPa m1/2 | ||
For all the tested sections of rails, stress intensity factor values were obtained in the range of 37.6–46.2 MPa m1/2. The average value of the stress intensity factor from all 15 tests was 41.0 MPa m1/2. These are results similar to those presented in the literature [17,31], where the given ranges of stress intensity factor values determined on heat-treated rail samples are in the range of 37–42 MPa m1/2. To calculate the K Ic value, the values of the conventional yield strength R p0.2 determined at a temperature of −20°C were adopted. The fracture image of the sample that gave the lowest K Ic result of 41.2 MPa m1/2 is shown in Figure 9. It can be seen that the fatigue fracture is ductile, and the zone fatigue scrap is approximately 6 mm.
View of fracture for samples 2–5.
The fatigue crack growth rate test was performed in accordance with the ISO 12108 standard [32]. The tests were performed on a total of 9 samples from 3 different rails. The tests were carried out at room temperature. During the test, the load factor (R = P min/P max) was 0.5 in accordance with the standard [2]. The equation of Paris’s law in zone II was determined using the following data pairs: crack growth rate da/dN [mm/cycle] in relation to the range of stress intensity factor ΔK [MPa m1/2], generated after applying a controlled sinusoidal load with a frequency of 15 Hz. The initial fatigue crack was generated at room temperature by recording the following parameters: load frequency, ΔK, K max, crack size, and total number of cycles. A strain gauge was used to measure the crack. Data pairs da/dN [mm/cycle] with respect to ΔK [MPa m1/2] were recorded every 0.08 mm of crack growth during the test. A double logarithmic zone plot was constructed from the recorded data and the line graph and fitted to the potential equation by calculating the parameters “C” and “m” in accordance with Paris’s law da/dN = C (ΔK) m . The obtained results of the fatigue crack growth rate for all tested samples are presented in Table 9. Each sample meets the requirements of the standard [2]. Compared to the fatigue crack growth rate results obtained in the tests described in Section 5.1, the fatigue crack growth rate results obtained in the qualification tests for both criteria ΔK = 10 and ΔK = 13.5 were approximately twice as high. This is due to the use of a different type of notch for the samples prepared by the Idonial Institute. Nevertheless, all results obtained in the qualification tests were consistent with the requirements of the standard [2]. The results of fatigue crack growth rate are presented in Table 9 [21].
Results of testing the fatigue crack growth rate [21].
| Sample No. | da/dN = C (ΔK) m | Indicator m/Gc ΔK = 10, MPa m1/2 | Indicator m/Gc ΔK = 13.5, MPa m1/2 | ||
|---|---|---|---|---|---|
| C | m | ||||
| 1 | 1–1 | 1.4207 × 10⁷ | 1.9498 | 12.66 | 22.72 |
| 1–2 | 1.1649 × 10⁷ | 2.0288 | 12.45 | 22.88 | |
| 1–3 | 2.8016 × 10⁷ | 1.6677 | 13.03 | 21.50 | |
| 2 | 2–1 | 2.0673 × 10⁷ | 1.9153 | 17.00 | 30.22 |
| 2–2 | 4.8851 × 10⁸ | 2.4538 | 13.78 | 28.77 | |
| 2–3 | 8.5625 × 10⁸ | 2.2583 | 15.52 | 30.57 | |
| 4 | 4–1 | 1.3571 × 10⁷ | 2.1066 | 17.00 | 32.64 |
| 4–2 | 1.4220 × 10⁷ | 2.0735 | 16.84 | 31.38 | |
| 4–3 | 1.4038 × 10⁷ | 2.0718 | 16.56 | 30.84 | |
| Average value | 14.98 | 27.95 | |||
| Requirements of the EN13674-1 standard | max 17 m/Gc | max 55 m/Gc | |||
Photo of the fracture surfaces for samples 4–3 is presented in Figure 10. Based on the observations of the fractures of the discussed samples, it can be concluded that the fatigue fracture is ductile, and the fatigue scrap zone for all samples is approximately 15–17 mm.
Fracture of sample numbers 4–3 for determining the fatigue crack growth rate.
The results of the fatigue strength test are presented in Table 10 [21]. Fatigue strength tests were carried out on nine samples. All samples withstood a load of 5 million cycles.
Fatigue strength test results [21].
| Sample No. | Strain amplitude | Force, kN | Result |
|---|---|---|---|
| 1a | 0.00135 | 10.78 | No cracks |
| 1b | 0.00135 | 10.88 | No cracks |
| 1c | 0.00135 | 10.75 | No cracks |
| 2a | 0.00135 | 10.83 | No cracks |
| 2b | 0.00135 | 10.83 | No cracks |
| 2c | 0.00135 | 10.88 | No cracks |
| 3a | 0.00135 | 10.83 | No cracks |
| 3b | 0.00135 | 10.76 | No cracks |
| 3c | 0.00135 | 10.57 | No cracks |
Residual stress testing was performed on six samples from different rails. The residual stress measurement results are presented in Table 11. The average residual stress value in the rail foot obtained during the qualification tests was 97 MPa, which is practically the same as the result obtained during the tests conducted at Łukasiewicz – Upper Silesian Institute of Technology, demonstrating the stability of the obtained residual stress level inherited from the production process.
Results of the measurement of residual stress in the rail foot.
| Number of sample | Residual stress value (MPa) |
|---|---|
| 1 | 96.9 |
| 3 | 66.4 |
| 2 | 84.9 |
| 2 | 104.9 |
| 3 | 116.7 |
| 4 | 114.3 |
| Mean value | 97.3 |
Regarding the assessment of sulphur segregation, standard [2] requires that this test be performed according to ISO 4968 [33], while Baumann prints should be assessed and classified according to the standards provided in Annex D of standard [2]. The approach to determining samples for assessing sulphur segregation is standardized in standard [2] and requires sampling from each strand of the casting machine, excluding the mixing zone, for three different melts. Table 12 presents the results of the assessment of the Baumann test standards for all tested rails. One sample was assessed as standard D4, which indicates low positive sulphur segregation, while all other samples were assessed as high standard D2, which indicates low negative and positive segregation.
Results of the Baumann test.
| Number of sample | Number of pattern |
|---|---|
| 5 | D2, D2, D2, D2, D2, D2 |
| 6 | D2, D2, D2, D2, D2, D4 |
| 7 | D2, D2, D2, D2, D2, D2 |
Examples of Baumann prints for the tested rails are presented in Figure 11.
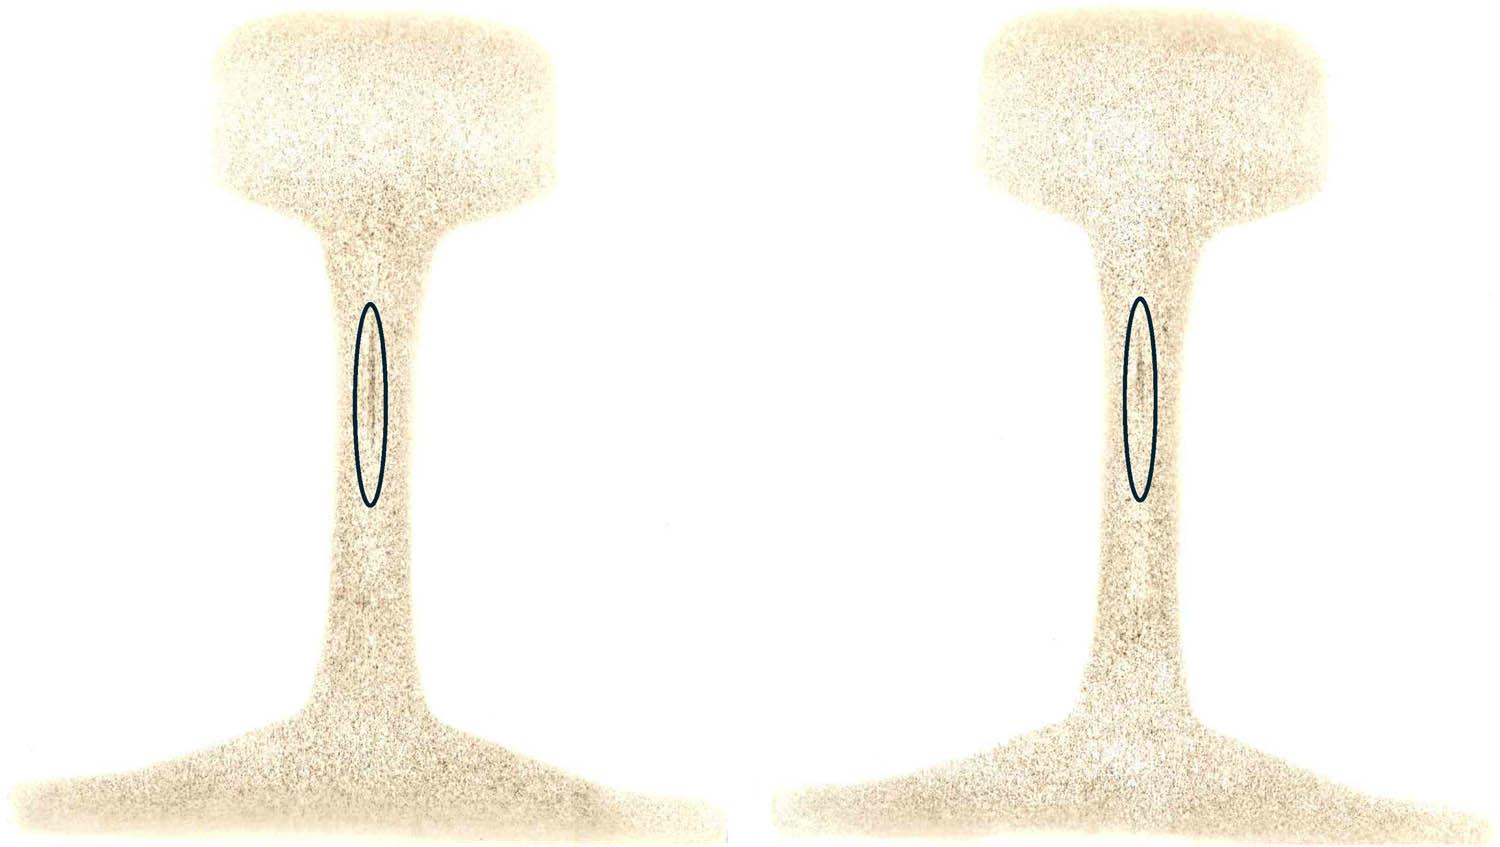
Baumann’s print: (a) sample 7 – pattern D2, (b) sample 7 – pattern D2. The area of positive sulphur segregation with a small amount of negative sulphur segregation in the rail web is marked.
For the assessment of hardness distribution on the rail surface, standard [2] requires that such an assessment be performed by taking 1-meter-long sections from both rail ends and every 20 m from one end. Hardness measurements should be performed in accordance with ISO 6506-1 [25], along the running surface axis of these sections every 25 mm, after removing the 0.5 mm decarburized layer. The results of individual hardness measurements should not differ by more than ± 15 HBW from the average result. To verify this criterion, test sections were taken from a 120-m rail from sample no. 3, and the average hardness value obtained from all 280 hardness measurements was 356 HBW. The minimum result was 350 HBW, while the maximum hardness was 366 HBW. This indicates a significantly smaller hardness distribution on the running surface of the tested rail than the maximum limit defined in standard [2].
The tests carried out in accordance with the scope included in the technical conditions DBS 918 254-1:2022 [22] were performed by the Technical University of Munich.
Vertical fatigue strength testing was performed on 10 rail samples. The initial stress was 400 MPa, assuming that cracking or undergoing 5 million cycles results in a change in the maximum stress by Δσ = 10 MPa. 7 samples withstood the specified stress for 5 million load cycles without cracking. However, three samples, No. 8-1, 8-7, and 8-9, cracked before reaching the limiting number of load cycles. Table 13 presents the test results.
Result of staircase method at vertical loading on rail profile 60E2-R350HT.
| Number of sample | Maximum stress (MPa) | Minimum stress (MPa) | Stress range σ o (MPa) | Executed load cycles | Result |
|---|---|---|---|---|---|
| 8–1 | 400 | 40 | 360 | 549,596 | Failure |
| 8–2 | 390 | 39 | 351 | 5,000,000 | Positive |
| 8–3 | 400 | 40 | 360 | 5,000,000 | Positive |
| 8–4 | 410 | 41 | 369 | 5,000,000 | Positive |
| 8–5 | 420 | 42 | 378 | 5,000,000 | Positive |
| 8–6 | 430 | 43 | 387 | 5,000,000 | Positive |
| 8–7 | 440 | 44 | 396 | 537,726 | Failure |
| 8–8 | 430 | 43 | 387 | 5,000,000 | Positive |
| 8–9 | 440 | 44 | 396 | 5,000,000 | Positive |
| 8–10 | 450 | 45 | 405 | 324,394 | Failure |
The evaluation of the staircase method in accordance with EN 14730-1 over 10 tests shows a mean fatigue strength under vertical loading of σ m = 382.5 MPa with a standard deviation of s = 68.5 MPa. Figure 12 shows a rail 60E2 R350HT from sample 8 in the vertical fatigue strength test.
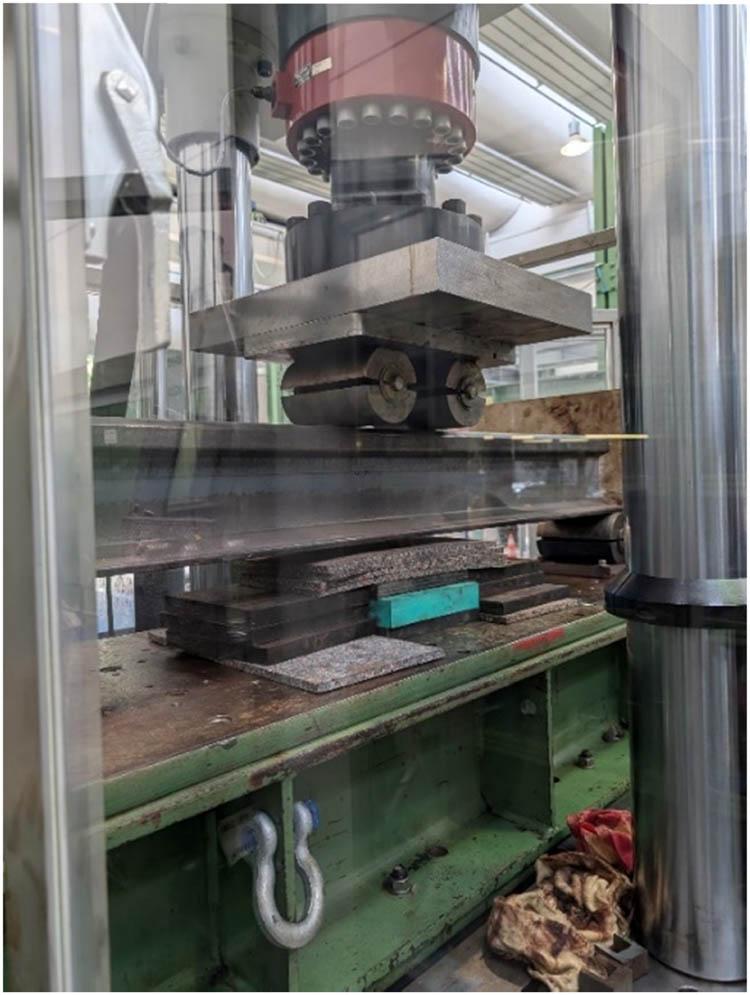
Rail sample 60E2 R350HT in the vertical fatigue strength test.
Lateral fatigue strength testing was performed on 10 rail samples. The initial stress was 400 MPa, assuming that cracking or undergoing 5 million cycles results in a change in the maximum stress by Δσ = 20 MPa. Six samples withstood the specified stress for 5 million load cycles without cracking. However, three samples, No. 8–4, 8–7, 8–8, and 8–10, cracked before reaching the limiting number of load cycles. Table 14 presents the test results. The evaluation of the staircase method in accordance with EN 14730-1 over ten tests shows a mean fatigue strength under lateral loading of σ m = 409.5 MPa with a standard deviation of s = 6.3 MPa. Figure 13 shows a rail sample 60E2-R350HT in the vertical fatigue strength test.
Result of staircase method at vertical loading on rail profile 60E2-R350HT.
| Number of samples | Maximum stress (MPa) | Minimum stress (MPa) | Stress range σ o (MPa) | Executed load cycles | Result |
|---|---|---|---|---|---|
| 8–1 | 400 | 40 | 360 | 5,000,000 | Positive |
| 8–2 | 420 | 42 | 378 | 5,000,000 | Positive |
| 8–3 | 440 | 44 | 396 | 5,000,000 | Positive |
| 8–4 | 460 | 46 | 414 | 619,397 | Failure |
| 8–5 | 440 | 44 | 396 | 5,000,000 | Positive |
| 8–6 | 460 | 46 | 414 | 5,000,000 | Positive |
| 8–7 | 480 | 48 | 432 | 562,692 | Failure |
| 8–8 | 460 | 46 | 414 | 717,294 | Failure |
| 8–9 | 440 | 44 | 396 | 5,000,000 | Positive |
| 8-10 | 460 | 46 | 414 | 716,943 | Failure |
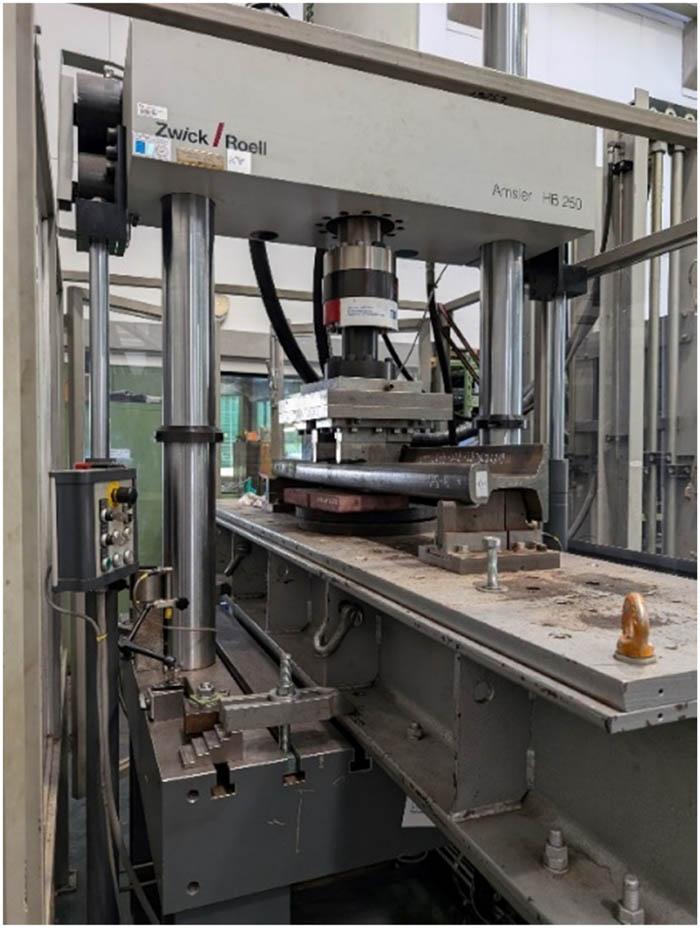
Rail sample 60E2 R350HT in the vertical fatigue strength test.
The fatigue strength results in both the vertical and horizontal planes meet the requirements of the standard [22]; it should be emphasized that the high fatigue strength value obtained for both types of tests is high.
An important element of assessing a new product according to the requirements of the Technical Conditions of the German Railways [22] is the testing of residual stress. Compared to the requirements of standard [2], the number of measurement points on the rail perimeter has been increased. In addition to testing the residual stress in the rail foot, standard [22] defines an additional 15 measurement points in the locations indicated in Figure 14. The results of the residual stress measurements on the rail perimeter are informative (except for the value at the centre of the foot), but they clearly emphasize the importance that German Railways attaches to the level of residual stress in the rails, also in terms of their symmetrical distribution along the rail axis.
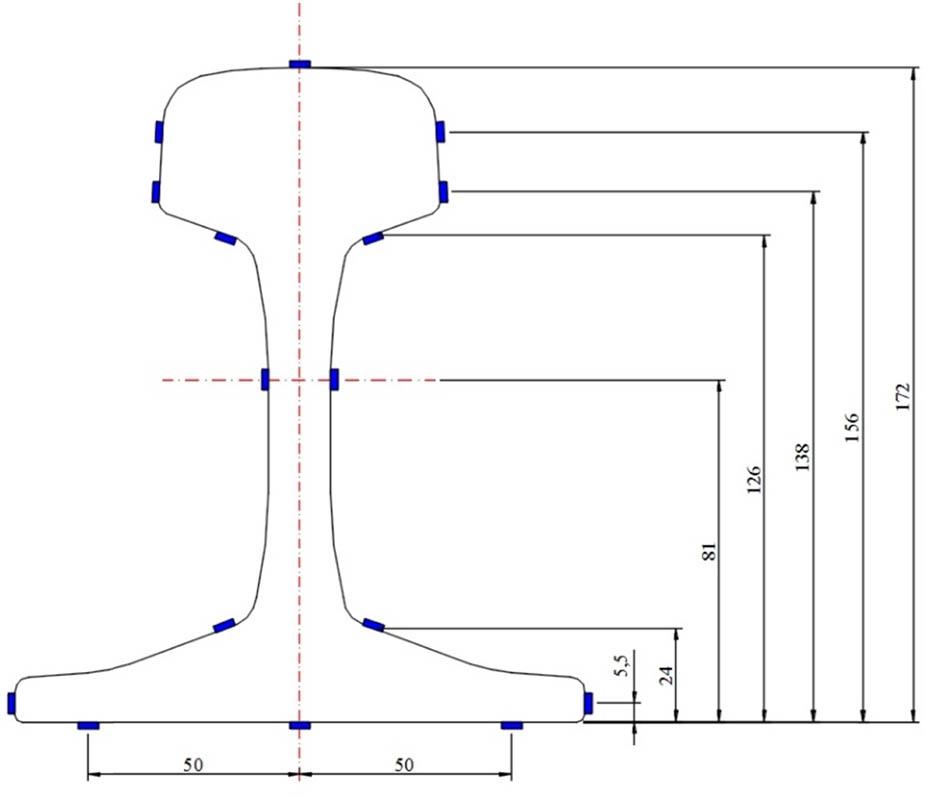
Schematic diagram of the arrangement of strain gauges on the perimeter of the 60E2 rail.
The obtained residual stress results in the foot axis of symmetry ranged from 96 to 106 MPa, with an average value of 100 MPa, which is at the same level as those obtained in previously discussed studies conducted by other research centres. An example of the residual stress distribution around the perimeter of the rail from test no. 8 is presented in Figure 15.
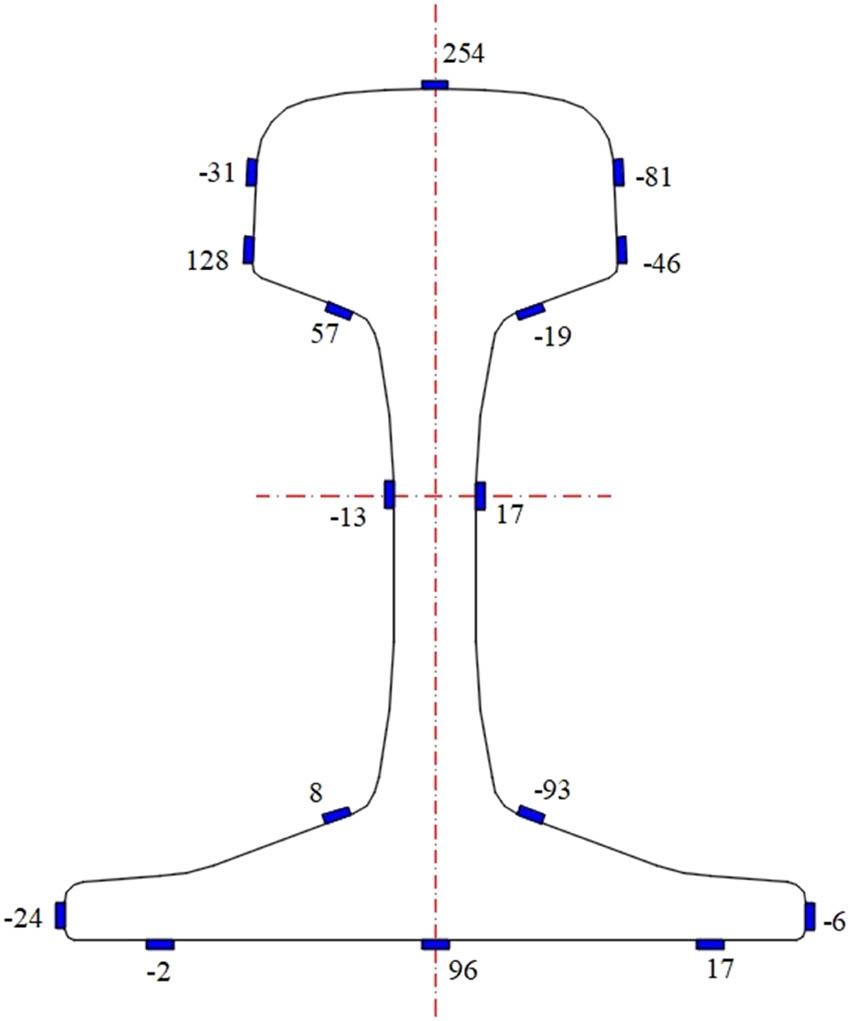
Distribution of residual stress on the perimeter of the rail from test no. 8.
This chapter presents the most important research results that constitute the basis for the evaluation of a new product, a heat-treated railway rail, resulting from standard requirements and additional procedures imposed by railway companies. The actual scope of research conducted as part of the NCBR project was much broader. All conducted tests confirm compliance with the requirements of the normative documents, demonstrating the high quality of the railway rails manufactured by ArcelorMittal Poland S.A. Conducting a wide range of additional tests during the validation phase of the heat treatment technology also demonstrates the manufacturer’s responsibility for its product through verification of its quality by external, independent research entities. Meeting the requirements of the relevant product standards is a necessary condition for the manufacturer to approve rails for use in railway tracks. However, the final and most important verification of rail quality takes place on the track. Therefore, testing of heat-treated R350HT rails under real-world operating conditions has begun. The results of these tests will allow for an assessment of the wear of heat-treated rails, their susceptibility to RCF contact fatigue defects, and their expected life cycle.
-
(1)
The scientific objective of this study was to confirm the stability of rail heat treatment technology by examining mechanical properties, determining the stress intensity factor, examining fatigue crack growth rate, testing fatigue strength, determining fatigue strength using the staircase method, and determining residual stress levels at the rail perimeter. Analysis of the obtained test results conducted by various independent research units supports the conclusion that the developed railhead heat treatment technology meets stringent quality requirements for this product.
-
(2)
The test material came from almost three times more melts than required by the standard [2]. This approach allowed for the assessment of a wider range of chemical compositions resulting from actual production conditions under constant heat treatment process parameters. Simultaneously, tests verifying the properties of the heat-treated rails were performed by several external research units, thus confirming the high quality of the heat-treated rails, which often exceeded standard requirements, and the operational stability of the rail heat treatment line.
-
(3)
All tested rails exhibited a fully pearlite structure in the hardened rail head, without undesirable bainite or martensite precipitation. This demonstrates the correct selection of the rail head cooling rate in the water–polymer mixture and the correct selection of heat treatment parameters. Low sulphur segregation was also observed in the Baumann test.
-
(4)
As a result of the applied heat treatment of the rail head, the morphology of the pearlite was modified so that the interlamellar distance in the pearlite was 95 nm, which translated into an average R m value of 1,269 MPa, an elongation of 10.6%, and an average hardness value on the running surface of 367 HBW. This not only meets the requirements of the standard [2] for mechanical properties, but also provides the heat-treated rails with adequate abrasion resistance in conditions of wheel-rail contact. Such properties allow the use of heat-treated rails in specific applications, such as highly loaded tracks and small-radius curves.
-
(5)
Both in the tests carried out as part of the project assessment and in the qualification tests, all results of the stress intensity factor, fatigue crack growth rate, and fatigue strength confirm that the requirements of the standard are met with a large margin, which is a good indication in terms of the operational properties of these rails in the tracks.
-
(6)
The obtained level of the average tensile residual stress in the rail foot of type 60E1/60E2 rails, amounting to 100 MPa, is significantly lower than the standard limit [2] of 250 MPa, which, taking into account the high fracture toughness of this steel, will provide heat-treated rails with high resistance to cracking under operating conditions because the critical crack length leading to the formation of a fracture in the rail increases. In the case of rails with a lower unit weight, 54E4 and 49E1, an even lower level of residual stress in the rail foot was obtained. This combination of the above parameters will directly impact rail safety.
-
(7)
Hardness is a measure of the abrasion resistance of pearlitic rails. The average rolling surface hardness value obtained from tests 1–8 was 367 HBW. This provides heat-treated rails with approximately four times greater abrasion resistance than heat-treated rails made of R260 steel grade.
-
(8)
A study of the residual stress distribution at 16 points around the rail perimeter, according to the DBS standard [22], confirmed relatively low tensile stress values in the rail foot and head and their symmetrical distribution about the vertical axis of symmetry of the rail. This is a favourable distribution of residual stress around the rail perimeter from an operational and technological perspective.
-
(9)
Fatigue tests using the staircase method performed in the vertical and horizontal planes of the rail confirmed compliance with the DBS standard [22] by recording high values of fatigue strength of heat-treated rails, which were σ m = 382 MPa for the test in the vertical plane and σ m = 409 MPa for the test in the horizontal plane.
The research was supported by the National Centre for Research and Development, Poland within the research project entitled “Reliable and durable in operation, modern railway rails with a length of 120 m, characterized by high mechanical properties, high resistance to cracking and modified microstructure of the material as a result of the modernization of the cooling process after rolling” – POIR.01.01.01-00-0438/18.
The author states no funding involved.
The author confirms the sole responsibility for the conception of the study, presented results and manuscript preparation.
The author states no conflict of interest.