
The growing demand for new types of extruded sections made of aluminium and its alloys particularly for modern structural applications in the construction, automotive, and aerospace industries necessitates modifications of their dimensions, increased shape complexity, or reduced wall thickness. These requirements are associated with the emergence of new application areas, the integration of multiple functions within sections of complex geometry and varying wall thickness, and the drive to reduce manufacturing costs.
Extrusion is one of the most important metal forming processes for producing profiles of various shapes. While axisymmetric profiles have been extensively studied, the extrusion of non-axisymmetric shapes remains insufficiently explored. Accurate prediction of extrusion loads and deformation zone parameters is essential for improving process efficiency and product quality. The extrusion of sections with complex cross-sectional geometries requires a careful determination of process parameters and implementation conditions, owing to the challenges of achieving shape accuracy, dimensional stability, surface quality, and uniform structure and material properties. The reviewed works consistently point to the crucial role of die geometry, flow balance, and defect prevention in the extrusion of complex aluminium profiles. Research on aluminium extrusion has highlighted the central role of flow balance and die design in determining product quality. Liu et al. [1] investigated the defect formation mechanisms in porthole-die extrusion of hollow thin-walled profiles, showing that velocity gradients at the die exit strongly affect dimensional accuracy and surface quality. Building on this, Ma et al. [2] demonstrated that optimisation of porthole die geometry in 6063 aluminium alloy extrusion improves flow uniformity and enhances the overall performance of thin-walled multicavity profiles, offering practical guidelines for die design. Similar conclusions were drawn by Nguyen et al. [3], who analysed AA7005 alloy extrusions with complex geometries and confirmed that refined die design significantly reduces distortion and improves flow distribution, thus enabling extrusion of high-strength alloys with intricate shapes. Qian et al. [4] further highlighted the effect of local die structure, showing that appropriate design helps maintain wall thickness uniformity in thin-walled components with longitudinal ribs. Complementary to these experimental and design studies, Zhang et al. [5] illustrated the potential of virtual try-out in predicting flow imbalance in complex dies, demonstrating how simulation-based optimisation reduces the need for costly physical trials. Collectively, these works emphasise that precise control of material flow, supported by die optimisation and virtual modelling, is fundamental for achieving dimensional accuracy and minimising defects in the extrusion of complex aluminium profiles.
Recent studies have shown that numerical modelling and optimisation techniques play a crucial role in improving extrusion performance. Chen [6] applied finite element (FE) simulations to the extrusion of hollow thin-walled aluminium profiles, identifying critical die zones that directly influence flow balance and product quality. Building on this approach, Liu et al. [7] used design of experiments and response surface methodology to optimise the extrusion of large reinforced thin-walled profiles, demonstrating how statistical methods can complement simulations in isolating key factors affecting accuracy and performance. Similarly, Kathirgamanathan and Neitzert [8] focused on pocket design optimisation for thin and complex aluminium profiles, proving that pocket geometry strongly governs flow uniformity and dimensional precision. Together, these works underline the effectiveness of combining numerical analysis with optimisation strategies to refine die design and ensure high-quality extrusion of thin-walled and complex sections.
Optimisation of extrusion dies has also been a subject of focused research on hollow aluminium sections. Ji et al. [9] demonstrated that careful refinement of die geometry directly affects material flow, weld seam quality, and dimensional accuracy in hollow aluminium profiles. Their findings confirmed that inadequate die design can lead to defects and distortions, whereas optimisation significantly improves profile quality, especially in complex hollow sections. This study reinforces the central role of die geometry in achieving defect-free extrusion and complements other works that highlight the relationship between die structure and product performance.
The characteristics of the extruded product and the determination of basic process parameters (temperature, extrusion speed, and extrusion force) are directly influenced by the mechanics of plastic flow. These are defined by the configuration of the plastic zones, their volume and shape, and the distributions of particle velocity, strain, and stress.
A broad range of studies has employed FE analysis, analytical modelling, and optimisation to better understand the extrusion of complex aluminium profiles. Jo et al. [10] demonstrated through non-steady-state FE analysis that material flow during tube extrusion evolves dynamically, with die geometry strongly influencing weld formation and dimensional stability. Similarly, Zhang et al. [11] and Chen et al. [12] highlighted the importance of process velocity, showing that stem and ram speeds directly affect flow balance, extrusion force, and wall thickness accuracy in hollow profiles. At the theoretical level, Gordon et al. [13] introduced a flexible velocity-field approach for axisymmetric extrusion, while Kar et al. [14] extended upper bound solutions to T-section bars, exposing the challenges of predicting loads in non-axisymmetric geometries. Mohammed [15] further emphasised the role of die angle, confirming its influence on deformation zones and extrusion force.
Moving towards more complex sections, Yang et al. [16] used integrated FE simulations to capture interactions between die shape and flow uniformity, and Qamar et al. [17] proposed a quantitative framework for assessing shape complexity in extrusion. Optimisation methods have also been applied: Xu et al. [18] performed multi-objective optimisation of multi-cavity dies with significant wall thickness differences, while Zhang et al. [19] developed a strain-compensated constitutive model for thin-walled profiles, improving prediction of flow and force. Zhao et al. [20] combined simulations with die trials, showing that numerical optimisation effectively reduces physical try-outs while enhancing dimensional accuracy. Collectively, these works demonstrate how simulation, analytical models, and optimisation approaches complement each other in advancing the design and control of extrusion processes for complex profiles.
The influence of cross-sectional shape on the size and form of deformation zones, and consequently on the extrusion force, is particularly evident in profiles with non-axisymmetric cross-sections.
A substantial body of work has examined the role of dead metal zones (DMZ) and deformation zones in shaping material flow during extrusion. Zhang et al. [21] showed that die orifice layout in porthole extrusion of aluminium tubes directly affects flow distribution, weld formation, and overall profile quality, while Selvaggio et al. [22] demonstrated that die features such as choking and bearing length can be tuned to restore flow balance and minimise distortion. Building on analytical approaches, Karami et al. [23] introduced a new definition of DMZ in forward extrusion of shaped sections, linking its geometry to pressure and material flow. Eivani and Karimi Taheri [24] confirmed the significance of DMZ in equal channel angular extrusion, showing its influence on strain distribution and extrusion load. Complementary to this, Qamar [25] applied finite element modelling (FEM) to relate shape complexity with DMZ size, while Li et al. [26] quantified the correlation between deformation zone geometry and extrusion force in FE studies of ECAE (Equal Channel Angular Extrusion).
Other contributions focused on linking deformation mechanics with energy and process conditions. Zhang et al. [27] developed a model for flow behaviour and energy consumption in complex aluminium profiles, underlining the efficiency implications of deformation mechanisms. Qamar and Pervez [28] investigated how extrusion parameters such as ram speed and extrusion ratio affect DMZ size and flow, confirming the process sensitivity of dead zone formation. Qamar et al. [29] extended this analysis by showing that greater shape complexity induces larger dead zones and requires higher ram pressures. Numerical studies by Lof and Blokhuis [30] confirmed that FE simulations can effectively capture non-uniform deformation fields in thin-walled sections, while Abrinia and Ghorbani [31] combined theoretical and experimental analysis to demonstrate the challenges of predicting load and flow in non-symmetric profiles. Finally, Qamar [32] reinforced the centrality of DMZ in cold extrusion, confirming its role as a critical factor in the mechanics of non-axisymmetric sections.
Together, these studies establish that DMZ geometry, deformation zone size, and die design are intimately linked with extrusion force, flow balance, and product quality.
The literature cited in this work mainly focuses on defining process parameters (such as temperature and extrusion speed) and implementation conditions, highlighting the challenges of ensuring shape accuracy, dimensional stability, surface quality, homogeneous structure, and consistent material properties.
Similarly, the characteristics of the extruded product and key process parameters (e.g. extrusion force) are governed by the mechanics of material plastic flow, which are defined by the configuration of the plastic zones, their volume and shape, and the distributions of particle velocity, strain, and stress.
The variation in the size and configuration of deformation zones as a function of cross-sectional shape and extrusion force is particularly pronounced for non-axisymmetric profiles. However, the reviewed literature does not attempt to mathematically describe or relate the influence of deformation zone configuration to the process parameters of extrusion for profiles with complex shapes.
Existing studies and results on this topic mainly concern extruded circular profiles or highly symmetric sections. Research on force evaluation reports variations in extrusion force depending on product shape, but does not provide explanations for this phenomenon.
Each of the cited publications provides only partial insights that are of limited use for a comprehensive theoretical analysis of the extrusion process of profiles with complex cross-sections.
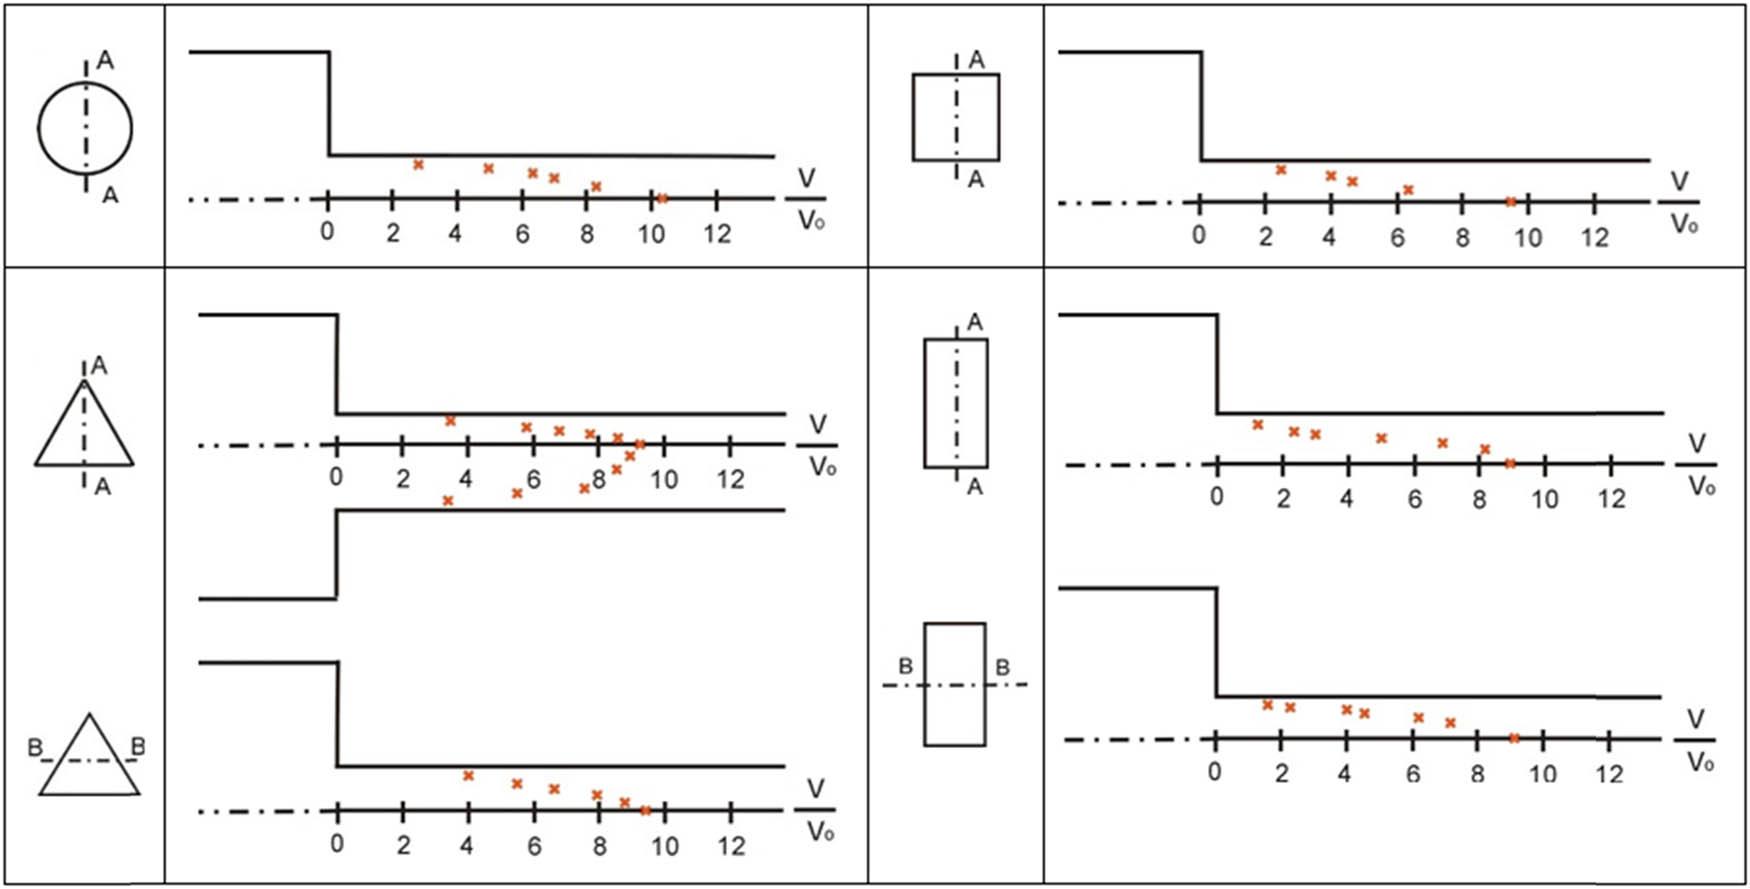
In the case of extrusion of axisymmetric cross-sections (e.g. circular), a conical plastic zone model is typically assumed. This assumption does not hold for non-axisymmetric sections. During extrusion of such profiles, the plastic zone takes on a different shape compared to that of a circular profile. This variation arises from the complex nature of the flow caused by the transition from the circular ingot cross-section to the non-circular product cross-section, as well as from the different configurations of deformation zones (in terms of size, shape, and volume) depending on the product geometry (Figure 1).
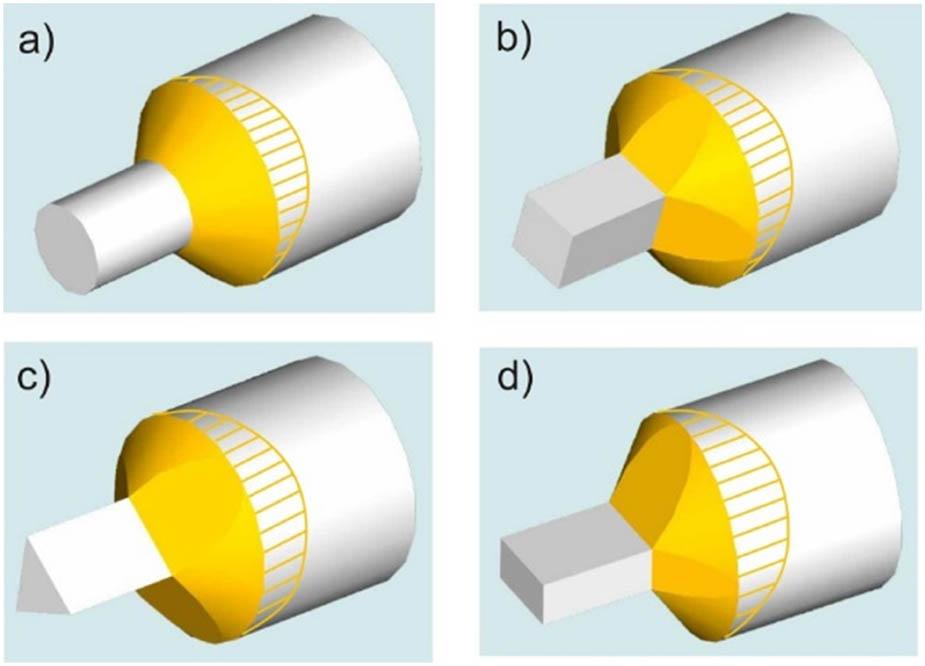
Configuration of plastic zones during extrusion of (a) circular, (b) square, (c) triangle, and (d) rectangle cross-sections.
The design of new plastic forming technologies requires a thorough understanding of metal flow kinematics and force–energy parameters. However, under industrial conditions, it is often very difficult, and sometimes impossible, to perform appropriate experimental tests because of difficulties in controlling actual manufacturing conditions. For this reason, various modelling methods are employed to analyse plastic forming processes in detail. Physical modelling serves to verify material flow (die filling), evaluate tooling and machine loads, determine stress and strain distributions, and assess the influence of different process parameters. The model materials used in these methods are typically metallic and easily deformable, such as lead and aluminium. Lead is the most common choice in experimental studies: its structure is comparable to that of several steel grades, and its flow behaviour at 20°C corresponds well to that of many steels under hot forming conditions.
The research presented in this article focuses on determining the relationship between metal flow behaviour, extrusion force parameters, and the cross-sectional shape of the extruded product.
The identification and description of deformation zones, as well as the determination of deformation heterogeneities in the extrusion of complex-shaped products, are essential steps in process analysis. Establishing relationships between deformation zone parameters (such as plastic zone depth, dead zone height, and dead zone angle) and extrusion force levels – while accounting for shape factors in analytical formulations – provides a basis for developing guidelines for both theoretical modelling and extrusion die design.
Extrusion process modelling is a key engineering tool for improving production efficiency and quality. However, it requires adequate technical knowledge, careful data collection and analysis, and continuous process optimisation and monitoring. In the case of established conventional manufacturing processes, the selection of operating parameters, equipment, or tool design is often based on recommendations and analytical relationships provided in standards or technology manuals, as well as on experience gained from previous production of similar products. For new, complex, or unconventional processes, however, generalised recommendations and analytical formulae are only indicative and usually insufficient. In addition, direct testing on production equipment is often impractical due to high costs and risks to safety or equipment integrity. A rational alternative in such cases is to apply physical or analytical evaluation of the process, which is the focus of this study.
Extrusion modelling is an analysis and optimisation technique designed to improve the performance of material extrusion processes, particularly in the manufacturing industry. When sections with complex cross-sectional geometries are extruded under industrial conditions, it is necessary to determine process parameters carefully in order to ensure high product quality, including dimensional stability, homogeneous structure, and consistent material properties.
The novelty of this research lies in establishing quantitative relationships between deformation zone configuration (plastic zone depth and volume, dead zone height and angle) and extrusion force for non-axisymmetric profiles. These relationships were validated through the combination of physical and analytical evaluation. Unlike previous studies, which mainly focused on axisymmetric profiles or offered only fragmentary insights, this work demonstrates that non-axisymmetric profiles require extrusion loads up to 35–40% higher than circular profiles at λ = 60. Recent works further highlight advances in related areas, offering broader methodological and application-oriented perspectives that complement and extend the present study.
Although not directly focused on extrusion, several studies from related fields provide valuable methodological insights into modelling and optimisation of metal forming. Liu et al. [33] developed a mathematical model for the tailor rolled blank process, showing how predictive frameworks can capture thickness variation and deformation during rolling. Tooling innovation and geometric control were addressed by Wang et al. [34], who proposed adjustable mandrels and advanced 3D registration methods for bent thin-walled tubes. Yao et al. [35] analysed the dynamic response of thin-walled and stiffened plates under blast loading, demonstrating how equivalent models can reproduce complex deformation mechanisms under extreme conditions. In a different context, Zhang et al. [36] applied wire-based friction stir additive manufacturing to reinforced aluminium composites, highlighting new possibilities for producing advanced materials that may later be adapted to extrusion applications. Collectively, these studies illustrate how approaches developed in rolling, bending, impact modelling, and additive manufacturing can enrich the methodological background of extrusion research by extending the toolkit of modelling strategies, optimisation methods, and material innovations.
The reviewed studies clearly demonstrate the importance of die geometry, flow balance, and defect prevention for ensuring quality in aluminium extrusion. Nevertheless, the majority of works are concentrated on dimensional accuracy and overall process optimisation, whereas the quantitative description of deformation zones – particularly the plastic and dead zones – remains insufficiently addressed. In this context, the aim of the present study is to fill this gap by combining physical modelling of non-axisymmetric profile extrusion with analytical evaluation of deformation zone parameters (depth L pz, height L dz, angle α dz, and volume V pz). The approach allows for establishing systematic relationships between deformation zone geometry and extrusion force, thereby providing new insights for die design and process planning.
The aim of this study is to analyse the mechanics of material plastic flow – specifically the configuration and size of plastic zones and the distribution of particle velocities – and their influence on the magnitude of extrusion force in non-axisymmetric profiles. The analytical evaluation results presented here can be integrated into widely used simulation programmes for plastic forming, enabling the identification of process parameters that yield optimal results.
The aim of the experimental study was to analyse the characteristics of material flow during co-extrusion using single-hole flat dies with varying extrusion ratios λ and die orifice shapes. The results were then related to the extrusion force.
The study employed a combination of visioplasticity experiments and analytical evaluation. In the physical modelling tests, cylindrical lead billets with a diameter of 36 mm and a height of 58 mm were used. The dies were manufactured with exit dimensions matching the respective profile geometries (circular, square, triangular, and rectangular). These dimensions were produced with a tolerance of ±0.01 mm to avoid unintended variations that could affect extrusion force measurements. The surface roughness of the die channels was controlled and expressed as R a (arithmetical mean roughness), ensuring repeatable and reliable contact conditions during extrusion.
In the physical tests, a thin Teflon film (0.2 mm) was placed between the billet and the container/die walls to minimise frictional effects, ensuring that the observed flow primarily reflected deformation zone behaviour. Friction was not included in the analytical calculations, as the study was designed to isolate the geometric contribution of deformation zones. In the mathematical model currently under development, friction will be incorporated according to the relation τ = m·k, in order to provide a more complete predictive framework for extrusion.
The scope of the study included:
-
–
realisation of the extrusion process using flat dies with various extrusion ratios (λ) and different extruded section shapes with model material,
-
–
measurement of the total extrusion force,
-
–
identification of metal plastic flow, including determination of deformation zone parameters (L pz, L dz, α dz) using the visioplasticity method,
-
–
determination of the shape and volume of the plastic zone.
The experimental study involved physical modelling with lead as the model material. The choice of lead was motivated by the need for a quick and inexpensive means of visualising the effect of die geometry on material flow, as well as its favourable deformability.
The influence of cross-sectional shape on metal flow was studied using the visioplasticity method with split ingots onto which a measuring grid had been applied. Observation of grid deformation after partial extrusion of the ingot enabled estimation of the deformation zone extent and the inclination angle of the dead zones.
Continuous data recording during the tests enabled the determination of process force characteristics and the effect of cross-sectional shape on the maximum extrusion force.
The basic idea of the model-material technique is to substitute the real metal undergoing plastic deformation with a soft model material that behaves analogously. This approach makes it possible to obtain information about the real process, including the directions of metal flow, strain and strain-rate distributions, load, friction conditions, and defects. The main advantages of using soft materials to study metal deformation are linked to their yield stresses, which are typically 500–1,000 times lower than those of real metals. As a result, inexpensive tool materials and simple presses can be employed to observe and record material flow while also reducing experimental time.
Metallic extrusion tests were performed using the co-rotating method on a 100-tonne hydraulic vertical press equipped with a state-of-the-art measurement and control system for recording punch force and displacement. An image of the test stand is presented in Figure 2.
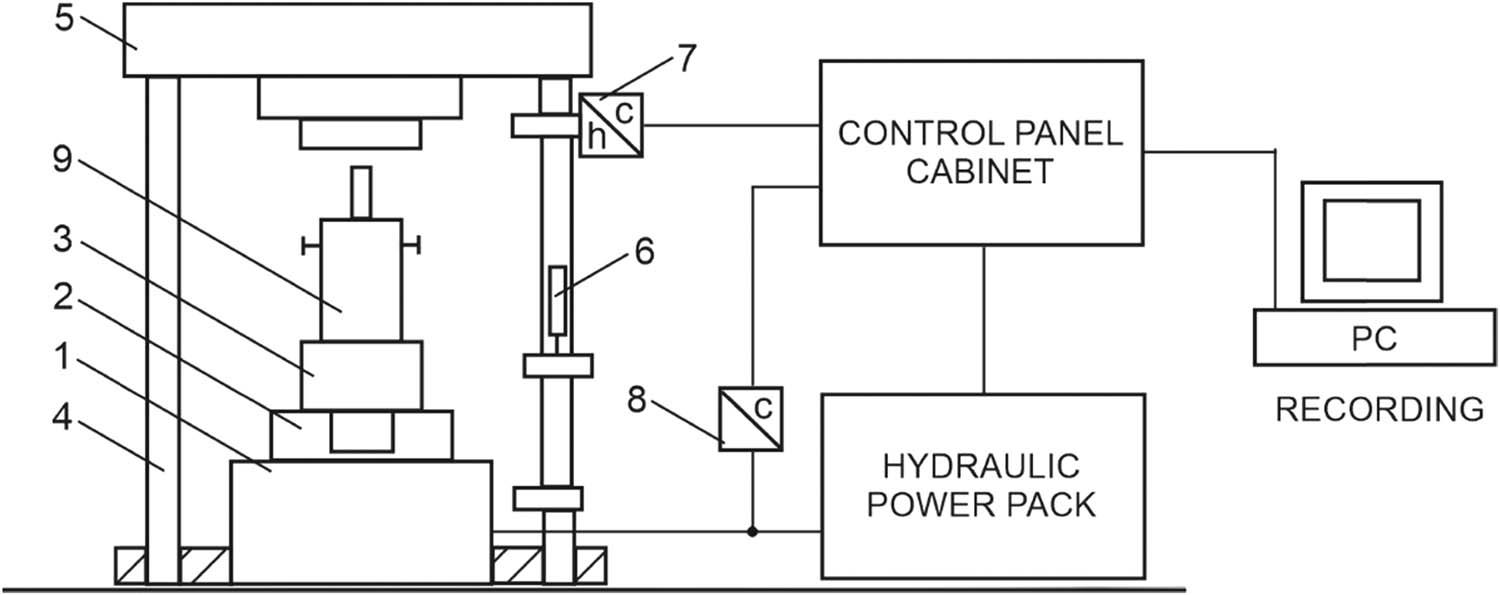
Test stand schematic diagram.
The basic assemblies and components of the extrusion test stand are as follows: hydraulic cylinder (1), hydraulic cylinder plunger (2), container base (3), press columns (4), crosshead (5), displacement sensor (6), electronic assembly of the displacement transducer (7), force sensor (8), and tooling set for extrusion tests (9).
The tooling assembly (9) is mounted on the base (3), which is coupled to the ram (2) of the hydraulic cylinder (1). A displacement transducer (6) is fixed to one of the columns. On the press upper crosshead, directly above the punch, a force transducer (load cell) (7) is installed.
During the extrusion process, the signals from the force and displacement transducers are fed to a signal conditioner, then logged and saved on a PC as measurement data. The data are written to a file to enable subsequent retrieval and further processing.
To perform the co-extrusion tests, a dedicated tool set was designed (Figure 3), consisting of container base (1), support plate (2), die (3), container (4), pressing die (6), and punch (7). The inner diameter of sleeve (2) matches the outer diameter of die (3), which ensures precise closure of the container during extrusion. After the die has been positioned in the container, the billet (4) is inserted. The lower base (1) facilitates the smooth flow of extruded material out of the container and die.
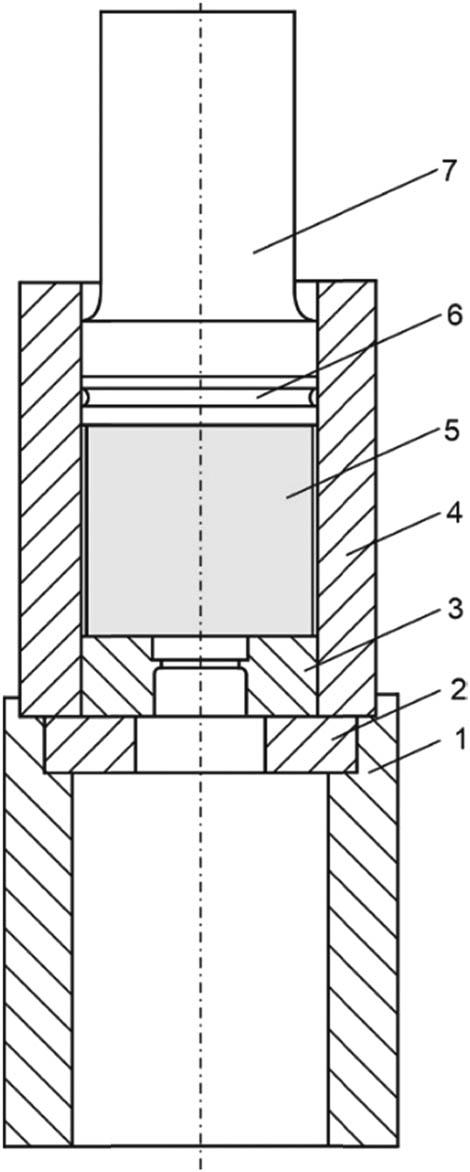
Tool set for extrusion testing of model material (1 – container base, 2 – support plate, 3 – die, 4 – container, 5 – billet, 6 – embosser, and 7 – punch).
The tools were made of low-carbon NC10 steel, hardened and tempered to HRC 52. Particular attention was paid to ensure high and uniform quality of the die working surfaces (side surfaces) and to maintain bore symmetry during manufacture.
The dies were made from SW7N steel, hardened and tempered to HRC 60. The die schematics are shown in Figures 4 and 5. The die exit holes were machined to a tolerance of ± 0.01 mm to ensure reproducibility and accuracy, and the surface roughness parameter R a was specified in the drawings.
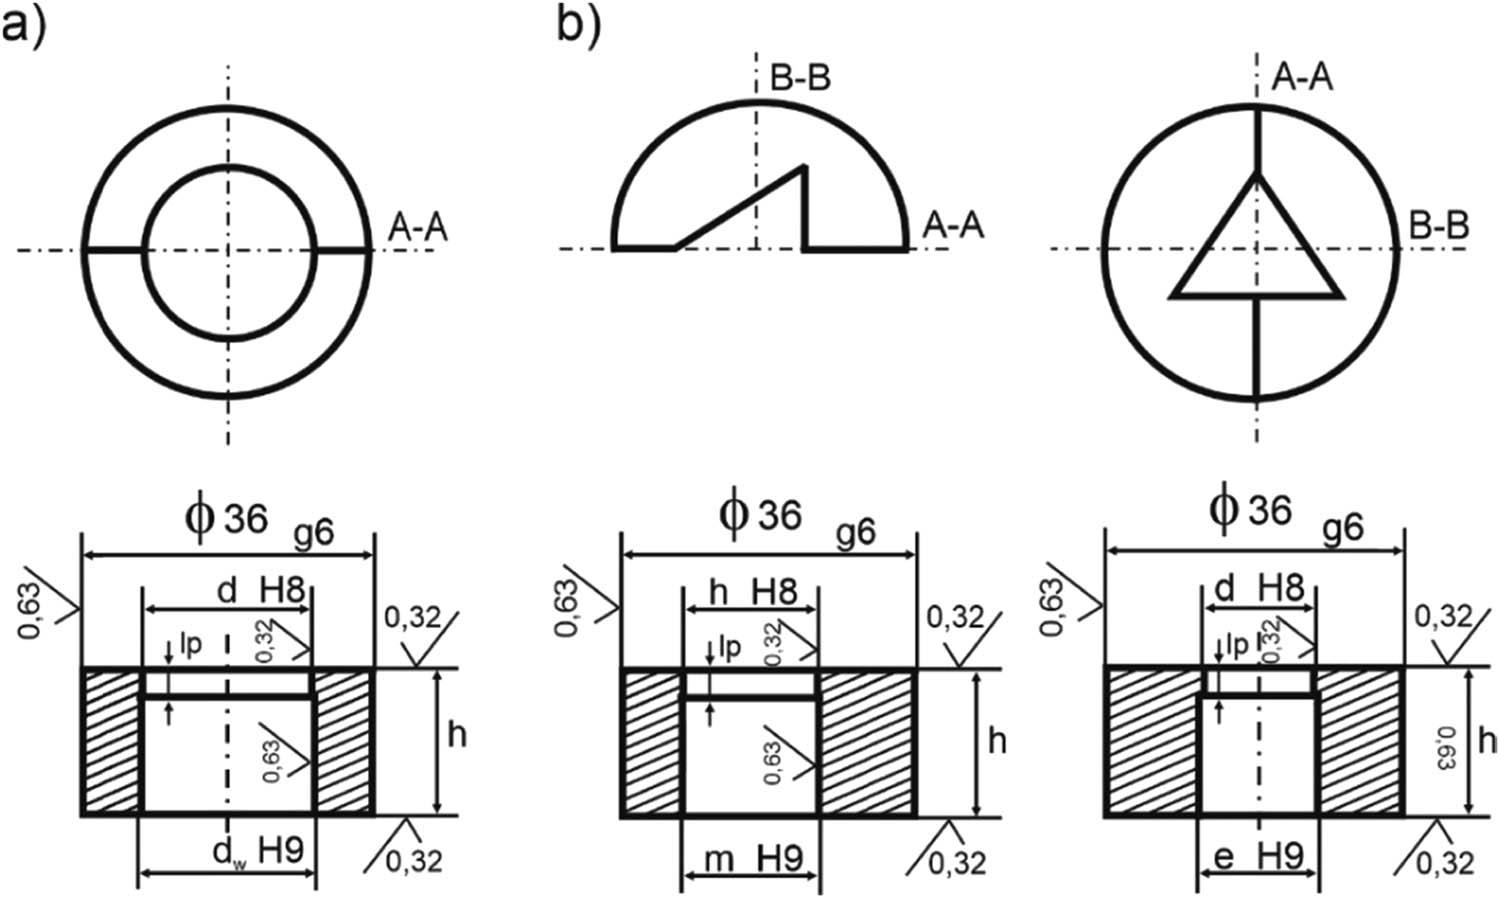
Extrusion test dies: (a) Circular die opening and (b) triangular die opening.
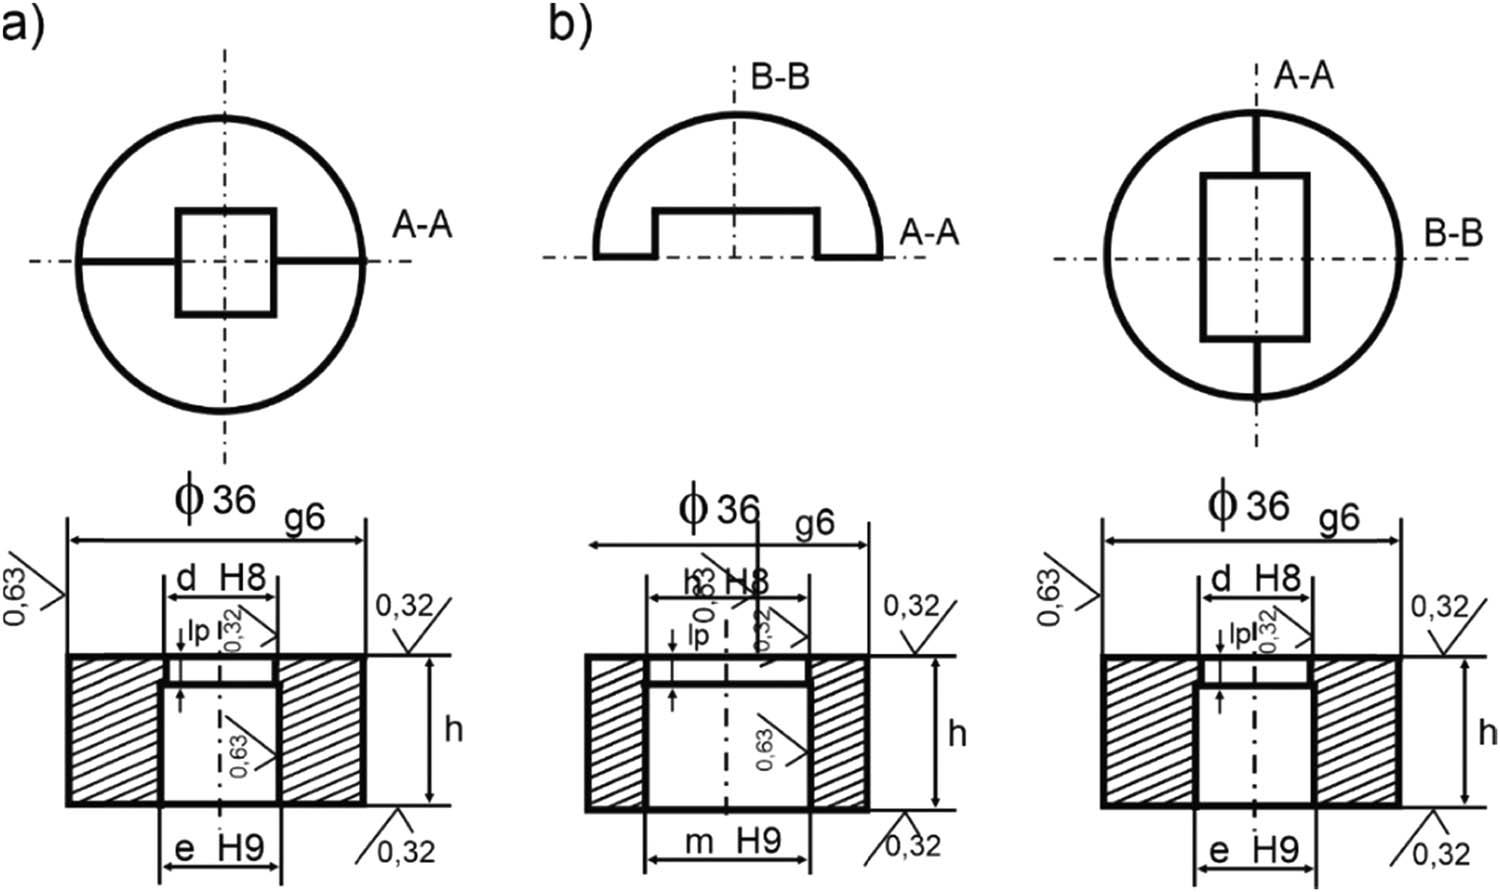
Extrusion test dies: (a) Square-shaped die opening and (b) rectangular die opening.
Billets of Pb1 lead alloy were used in the study. The chemical composition is presented in Table 1, and the basic mechanical properties are listed in Table 2. The billets were prepared from pre-extruded material.
Chemical composition of the material used in the study (Pb1) – weight%.
| Pb | Ag | As | Bi | Fe | Cu | Zn | Sb | Sn |
|---|---|---|---|---|---|---|---|---|
| 99,98 | 0.0005 | 0.0005 | 0.0100 | 0.0006 | 0.0005 | 0.0005 | 0.0005 | 0.0005 |
Basic mechanical properties of the material used in the study (Pb1).
| Unit | ||
|---|---|---|
| Tensile strength R m | MPa | 17 |
| Yield strength R e | MPa | 5 |
| Elongation A | % | 45 |
The stress–strain relationship for Pb1 lead was determined experimentally in an upsetting test. To minimise the effect of friction during the upsetting process, a 0.2 mm thick Teflon film was used between the tool plates and specimen faces. Figure 6 presents the stress–strain curve for Pb1.
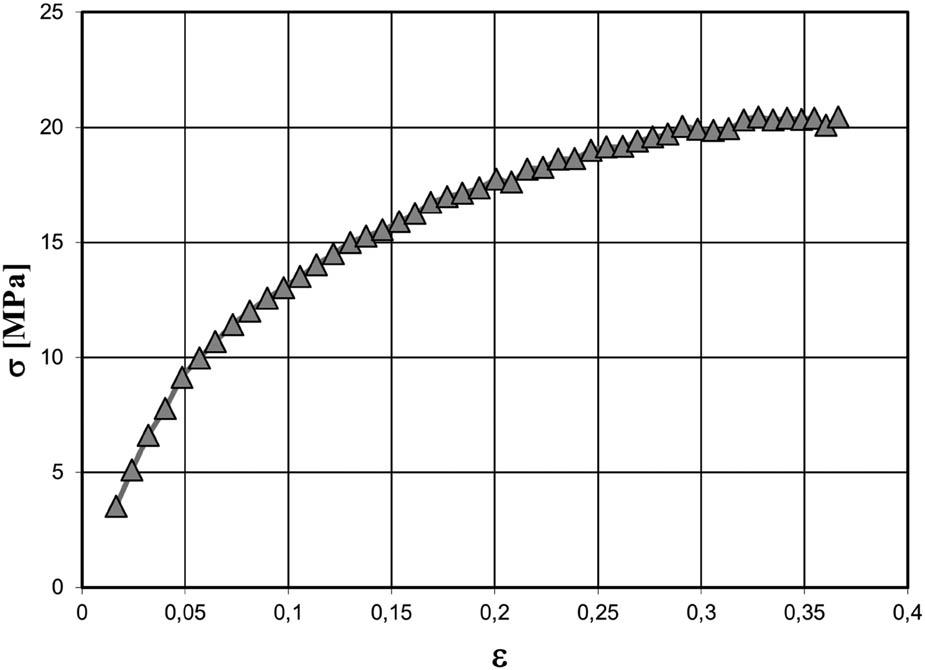
Stress–strain relationship obtained experimentally in the upsetting test for Pb1.
The starting material for extrusion consisted of lead billets. Before extrusion, the billets were cut along the longitudinal axis. A 1.5 mm square grid was mechanically imprinted on one half, after which the halves were reassembled (Figure 7). This specimen preparation method enabled identification of the deformation zone after extrusion using the visioplasticity method.
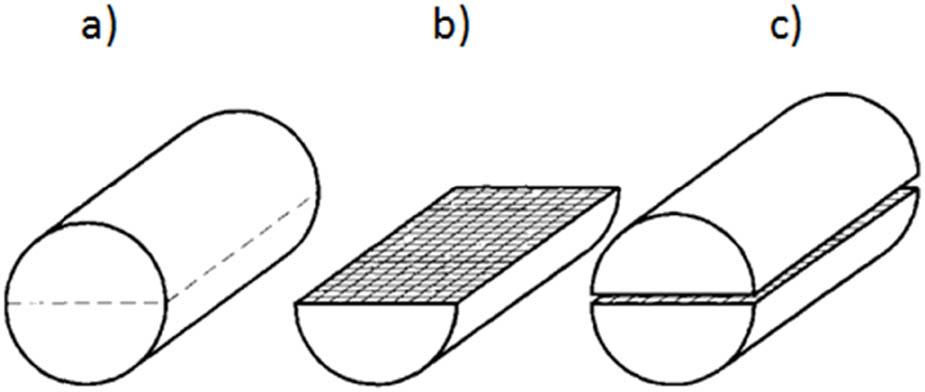
Preparation of split ingots for testing using the visioplasticity method: (a) Split ingot, (b) half of ingot with grid applied, and (c) assembled ingot prepared for testing.
The extrusion speed was selected to ensure a comparable discharge rate from the die orifice for all profiles.
The following series of tests were carried out on the complete set of dies:
-
–
extrusion of the entire billet from the container to record extrusion force variation during the process,
-
–
partial extrusion of the split ingot from the container to analyse the plastic flow of the extruded material.
The split specimens were not fully extruded. The test was stopped once steady-state flow was reached, after the extruded length reached about ten die orifice diameters. This amount of material ensured that steady-state flow was achieved in the container. At the end of the test, the die containing the remaining billet and extruded profile was released from the container and removed from the die holder. After removal of the residual film, the deformed grid was photographed to analyse metal flow.
The extrusion process parameters are presented in Table 3.
Extrusion parameters.
| Extrusion speed (mm/s) | 1 |
| Extrusion ratio λ | 3; 12; 60 |
The results recorded during the experiments were saved in an Excel file for later analysis and presented as graphs of extrusion force vs punch displacement. These data enabled the creation of accurate plots illustrating changes in extrusion force throughout the process.
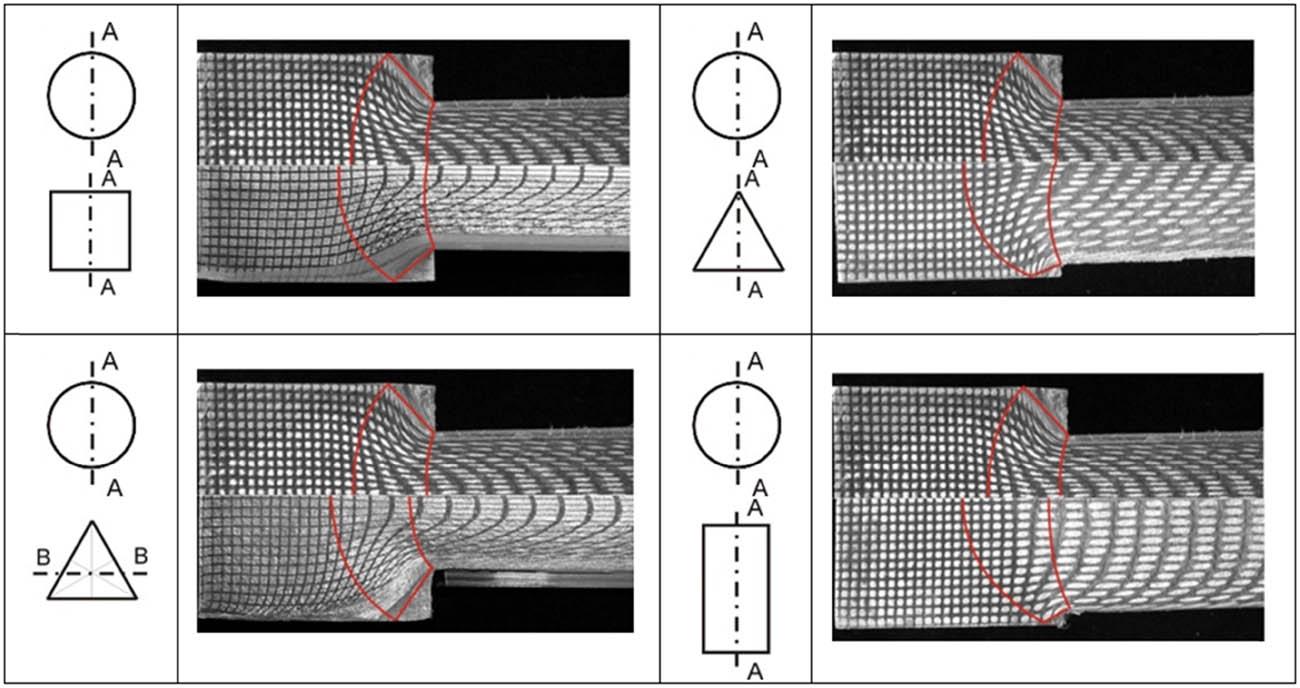
Figure 8 shows images of model material flow obtained during the extrusion of circular, square, triangular, and rectangular sections.
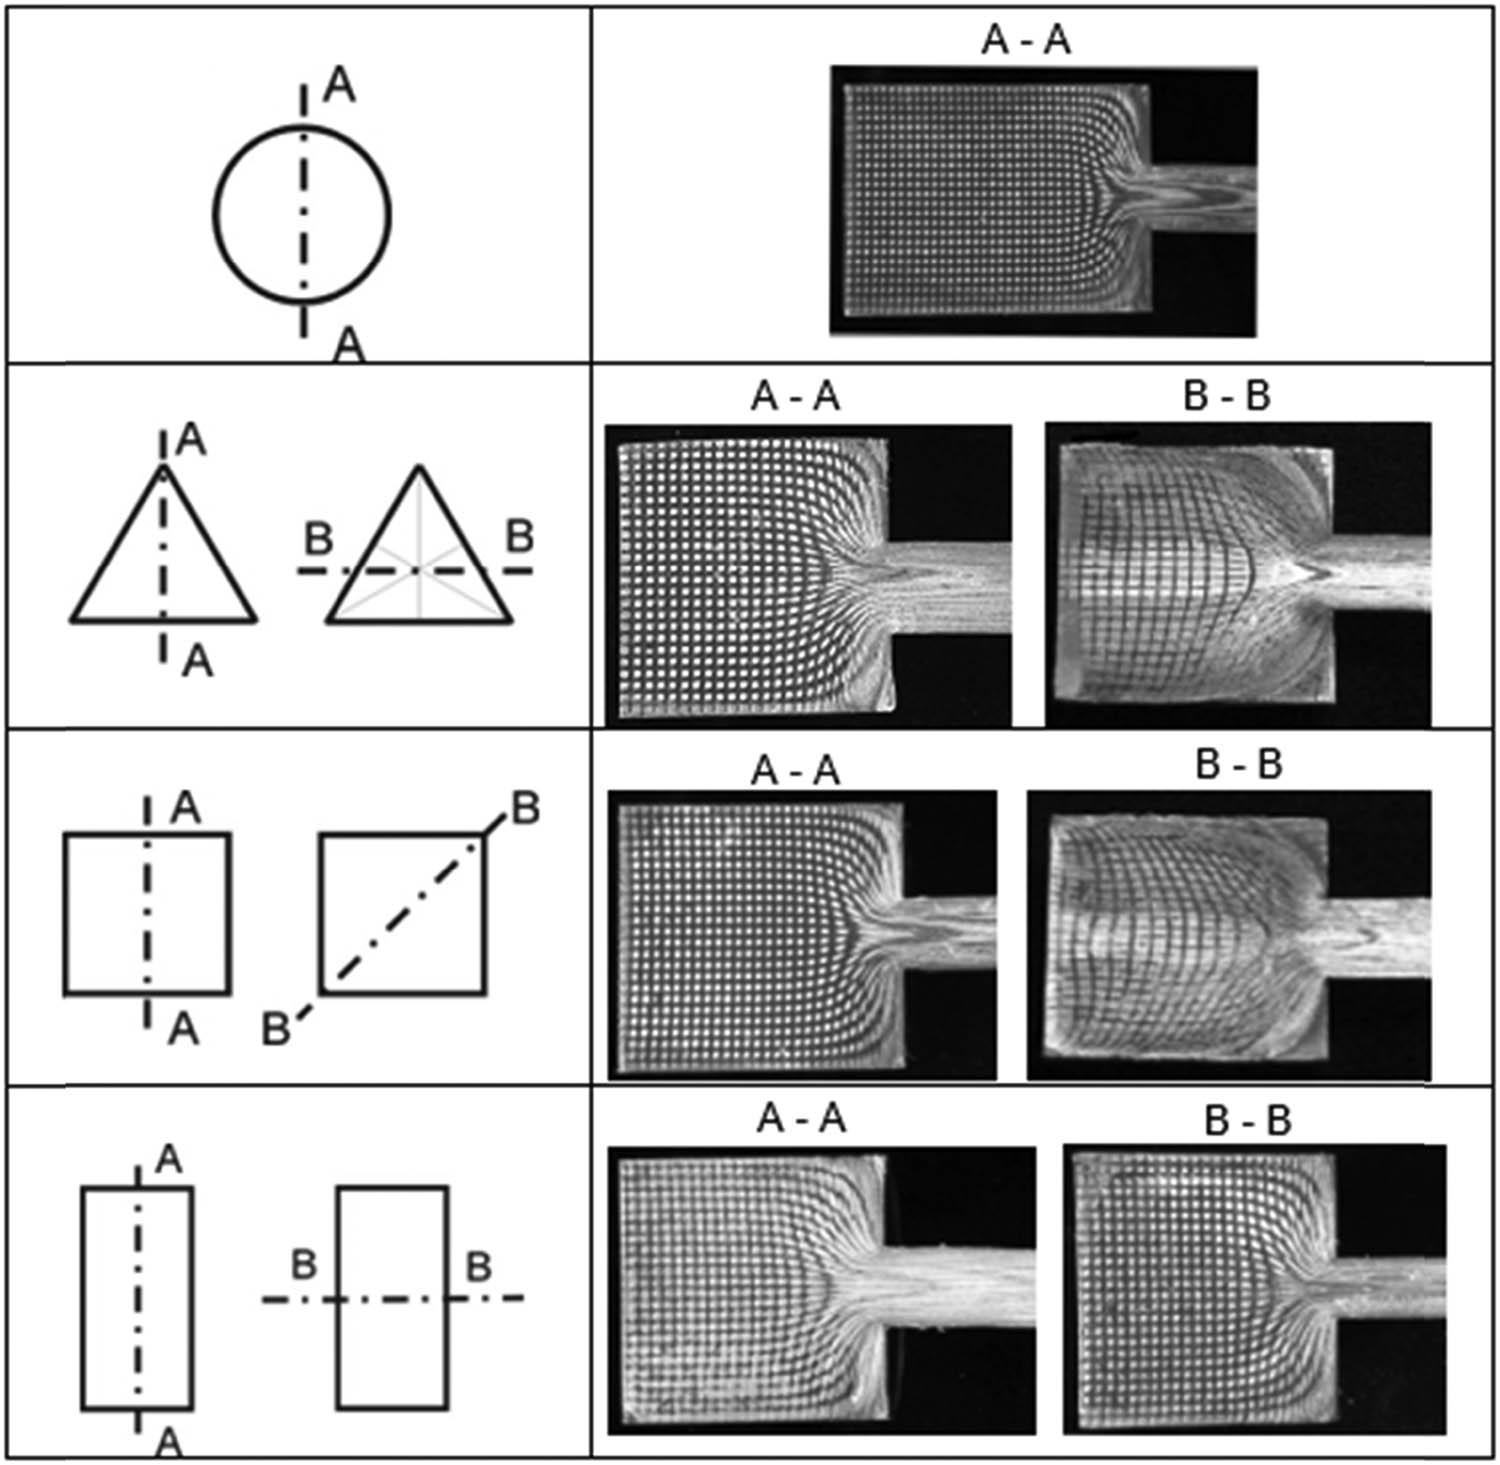
Grid deformation during extrusion of lead through flat dies with various orifice shapes (λ = 12).
The longitudinal grid lines (Figure 8) deform as they pass through the region of intense deformation. The transverse grid lines bend symmetrically, convex in the direction of punch movement, due to the retardation of the outer layers relative to the inner layers. The deflection of the transverse lines increases with distance from the specimen face, which results from frictional forces between the specimen and the container.
The images of the deformed grid, particularly the changes in spacing between the vertices of the transverse lines along the length, indicate significant heterogeneity in the deformation behaviour of the inner layers of the material. This deformation heterogeneity, illustrated by the grid distortion, results from the complex physical processes occurring during extrusion. It is especially pronounced in the extrusion of products with non-axisymmetric cross-sections.
Based on the flow images obtained, the depths of the deformation zones in the ingot – the plastic zone (L pz) and the dead zone (L dz) were measured. The visioplasticity method, involving deformation analysis of grids applied to the longitudinal ingot section (Figure 3), enabled accurate determination of the extent of these zones.
In a partially extruded ingot, areas can be observed where the applied grid is severely deformed and others where it remains almost intact. From these observations, the depth of the deformation zone in the ingot (L pz), the height of the dead zone (L dz), and the dead zone angle (α dz) were determined. The measurement scheme for L pz, L dz, and α dz is shown in Figure 9.
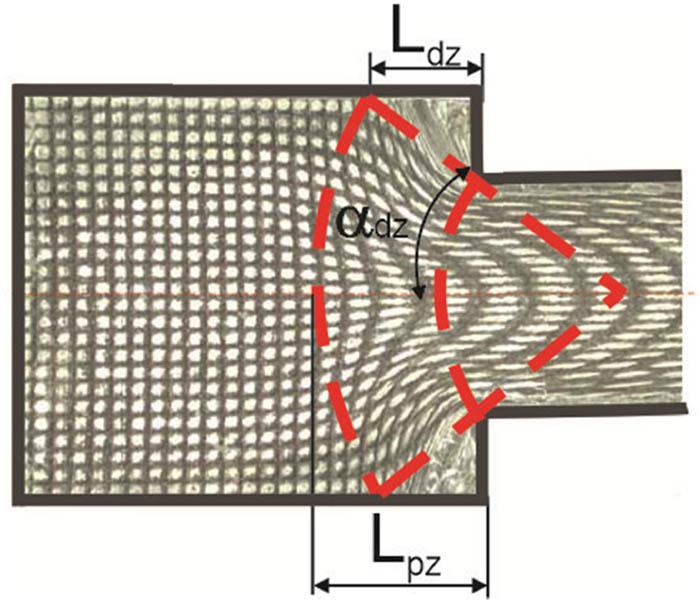
Scheme of measuring the depth of the plastic zone L pz, the dead zone L dz, and the dead zone angle α dz.
The deformation zone was assumed to begin between two successive grid lines whose spacing along the ingot axis is significantly greater than the initial distance. The measured values of the plastic zone depth (L pz), dead zone height (L dz), and dead zone angle (α dz) for all die orifice shapes, as a function of extrusion ratio (λ), are presented in Figures 10–12.
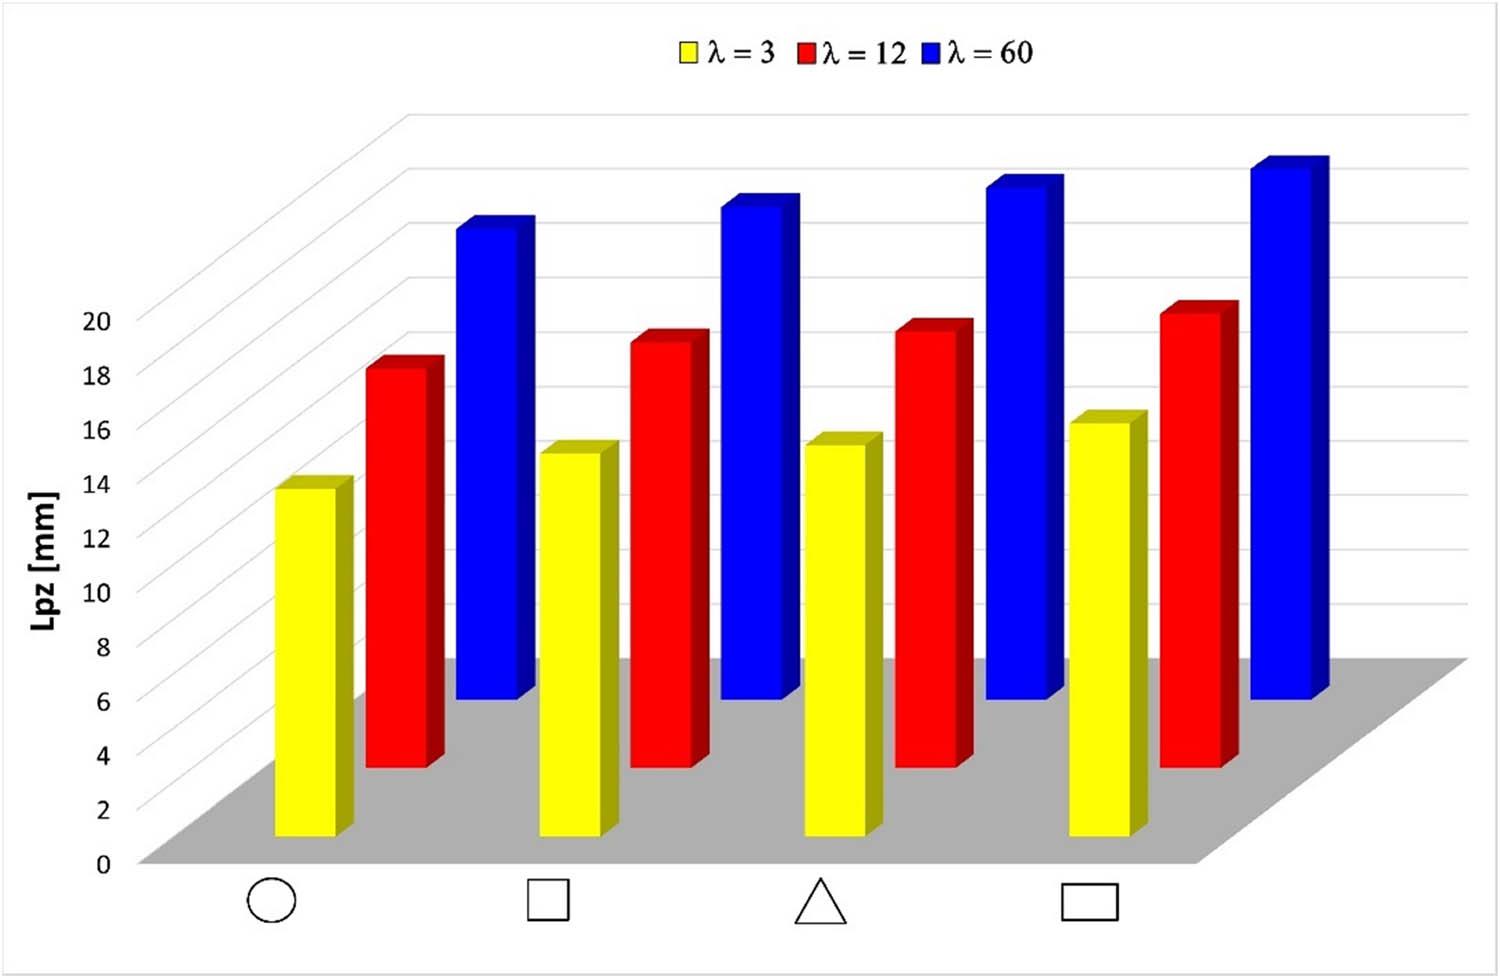
Relationship between the plastic zone depth (L pz) and the cross-sectional shape of the extruded product.
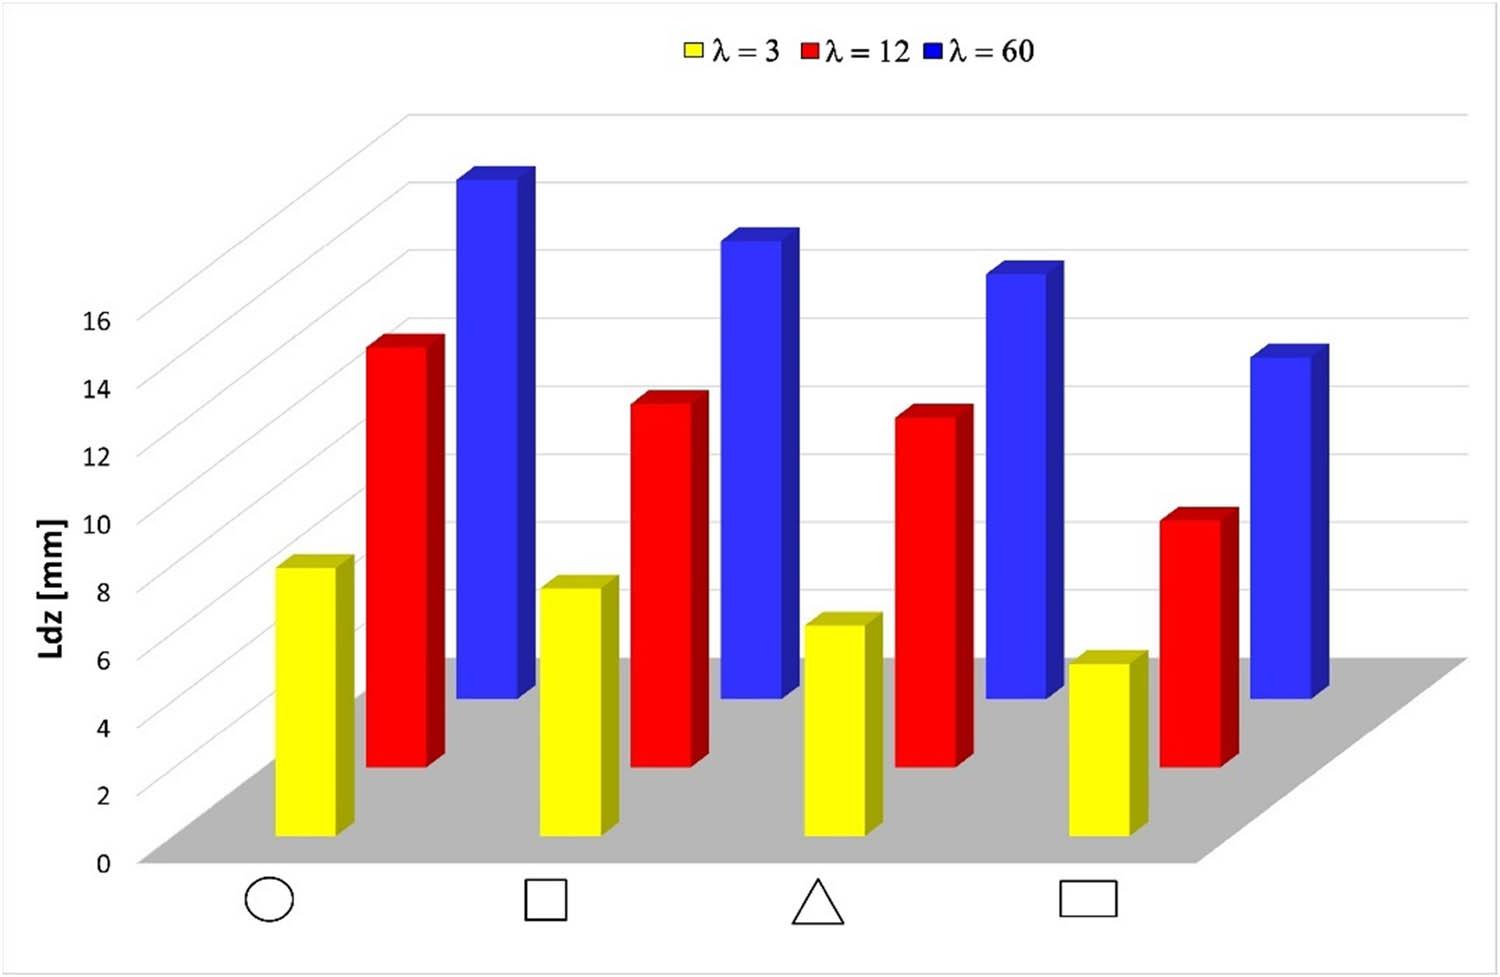
Relationship between the height of the dead zone (L dz) and the cross-sectional shape of the extruded product.
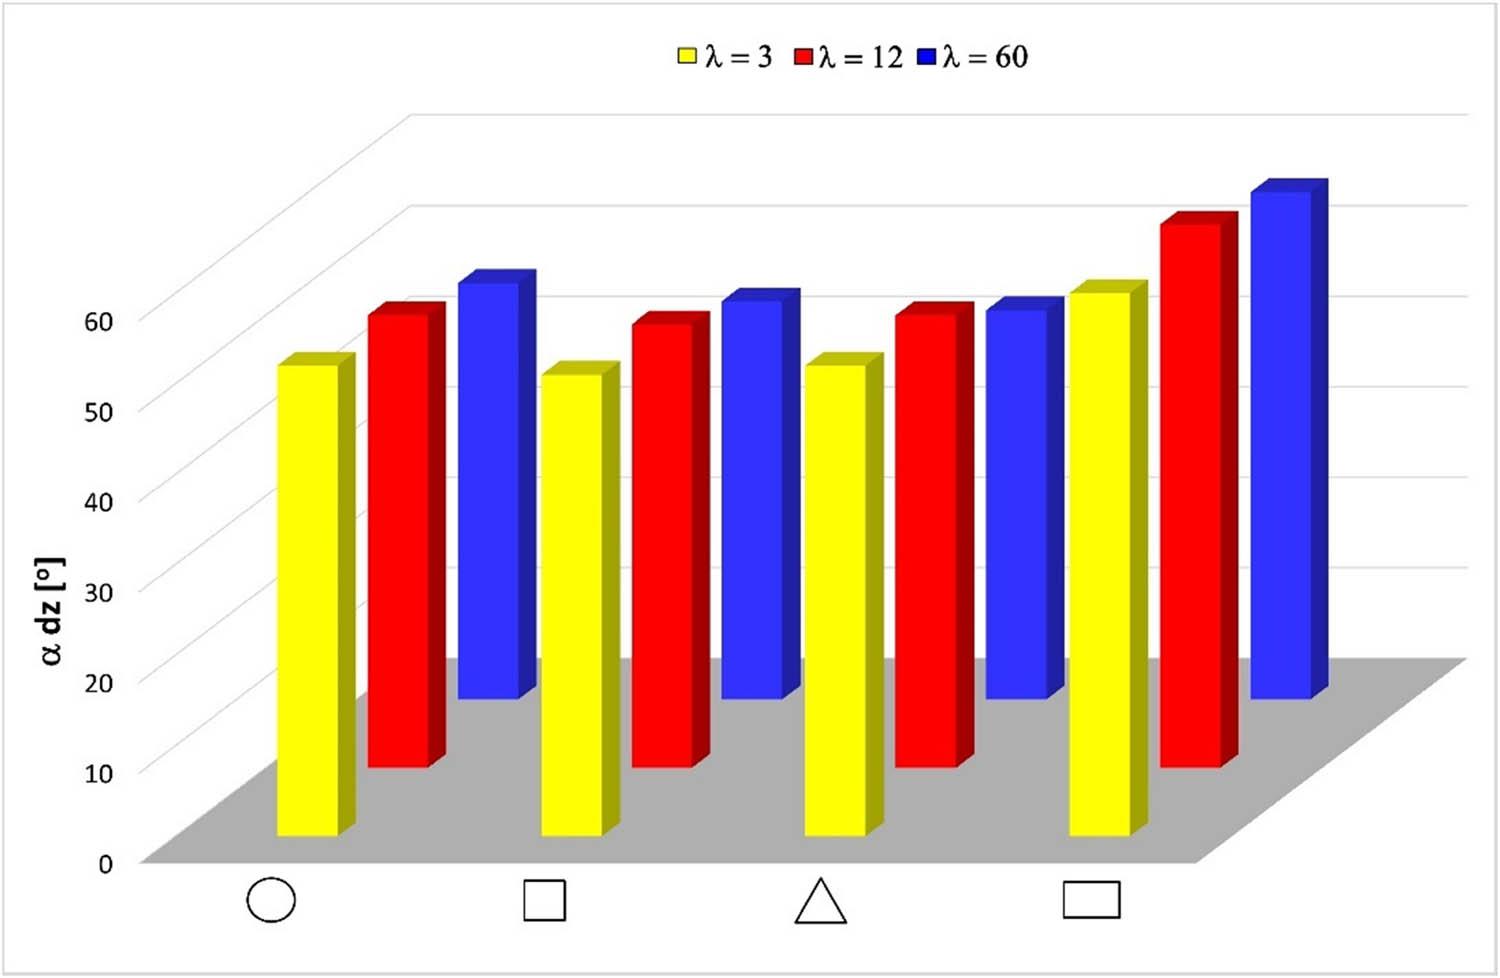
Relationship between the dead zone angle (α dz) and the cross-sectional shape of the extruded product.
Depending on the cross-sectional shape of the extruded product, different values of plastic zone depth (L pz), dead zone height (L dz), and dead zone angle (α dz) were observed. The depth of the plastic zone and the height of the dead zone increased with increasing extrusion ratio (λ), whereas the dead zone angle decreased.
Plastic zone depth (L pz), dead zone height (L dz), and dead zone angle (α dz) are closely related to the cross-sectional shape of the extruded product. Variations in the measured values of L pz, L dz, and α dz result from differences in metal flow behaviour depending on product shape. Figures 13–15 present the relationship between the recorded maximum extrusion load (F max) and L pz, L dz, and α dz.
Relationship of maximum extrusion force (F max) to plastic zone depth (L pz), cross-sectional shape of the extruded product, and extrusion ratio (λ).
Relationship of maximum extrusion force (F max) to dead zone height (L dz), cross-sectional shape of the extruded product, and extrusion ratio (λ).
Relationship of maximum extrusion force (F max) to dead zone angle (α dz), cross-sectional shape of the extruded product, and extrusion ratio (λ).
The maximum extrusion force (F max) increases with both plastic zone depth (L pz) and dead zone angle (α dz), as shown in Figures 13 and 15. In contrast, F max increases as the dead zone height (L dz) decreases (Figure 14).
From the deformed grid on the longitudinal section of the extruded specimen, and considering the principle of constant volume conservation, the logarithmic axial strain (ε z) and logarithmic radial strain (ε r) were calculated. The following relationships were applied:
-
–
logarithmic axial strain
{\varepsilon }_{z}=\hspace{.25em}\mathrm{ln}\hspace{.25em}\frac{{l}_{n}}{{l}_{0}} -
–
logarithmic radial strain
{\varepsilon }_{r}=\hspace{.25em}\mathrm{ln}\hspace{.25em}\frac{{r}_{n}}{{r}_{0}}
Owing to the symmetry of the ingot with respect to the intersection plane, the calculations considered half of the cross-section of the extruded specimen. Calculations were performed for all four cross-sectional shapes (circle, square, triangle, and rectangle) and for different extrusion ratios (λ). Two deformed grid lines on the longitudinal cross-section were used to describe ε z and ε r, denoted as ε z(1,2) and ε r(1,2). Figure 16 shows the relationships between ε z, ε r, and billet length.
Axial strains (ε z) and radial strains (ε r) as functions of ingot length for extruded cross-sections at λ = 12.
Analysis of the graphs shows that the largest deformations occur in the outer layers of the extruded ingot (layer 2), while the inner layers (layer 1) undergo slightly smaller strains. The axial strains (ε z) in the outer layers are greater than those in the inner layers, even though metal flow is facilitated in the inner region. The increased elongation results from frictional forces between the metal and the tool walls (container and die). This effect is also visible in the deformed grid image (Figure 8), where the outer sections are clearly longer than the inner sections.
From the analysis of changes in the positions of the coordinate grid nodes, the relative velocity distribution of particles in the die orifice region was determined. The results are presented in Figure 17.
Velocity distribution in the die orifice region (λ = 12).
Analysis of the particle velocity distribution in the die orifice region shows differences depending on the cross-sectional shape of the extruded product. For the triangular product (Figure 17, cross-section A–A), the velocity distribution is asymmetric.
The non-uniform particle velocity distribution in the die orifice region results from differences in material deformation depending on product cross-sectional shape. To highlight the differences in size and shape of the plastic zone between axisymmetric and non-axisymmetric extruded sections, and to examine the relationship between metal flow behaviour and force parameters, the volume of the plastic zone formed during extrusion was calculated.
The volume of the plastic zone was divided into three parts, designated V 1, V 2, and V 3, as illustrated in Figure 18.
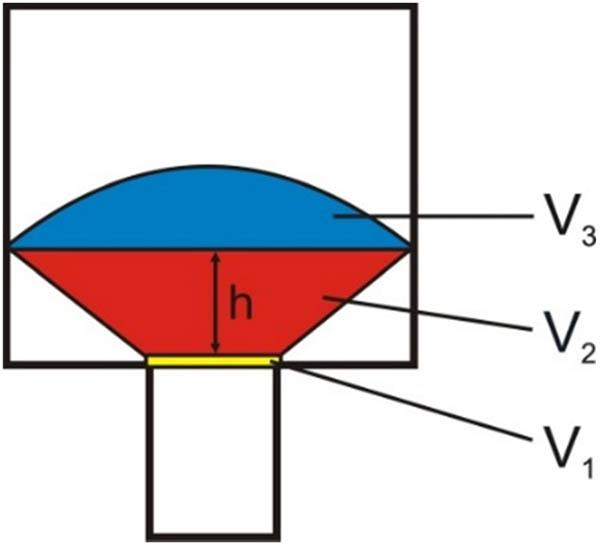
Division of the plastic zone volume into three components: V 1, V 2, and V 3.
To calculate V 1, representing the volume of metal in the calibration strip, the following relationships were applied:
-
1)
For an extruded circular section
(1) {V}_{1}=\pi {r}^{2}{l}_{p}. -
2)
For an extruded square section
(2) {V}_{1}={a}^{2}{l}_{\text{p}}. -
3)
For an extruded triangular section
(3) {V}_{1}=\frac{{b}^{2}\sqrt{3}}{4}{l}_{\text{p}}. -
4)
For an extruded rectangular section
(4) {V}_{1}=cd{l}_{\text{p}},
The volume V 2 was determined using an engineering method involving liquid displacement measurements. Approximately, V 2 can also be calculated using the following relationships:
-
1)
For an extruded circular section
(5) {V}_{2}=\frac{\pi }{3}h({R}^{2}+Rr+{r}^{2}). -
2)
For an extruded square section
(6) {V}_{2}=\frac{h}{3}(\pi {R}^{2}+{a}^{2}+\sqrt{\pi {R}^{2}+{a}^{2}}). -
3)
For an extruded triangular section
(7) {V}_{2}=\frac{h}{3}\left(\pi {R}^{2}+\frac{{b}^{2}\sqrt{3}}{4}+\sqrt{\pi {R}^{2}+\frac{{b}^{2}\sqrt{3}}{4}}\right). -
4)
For an extruded rectangular section
The determination of h is illustrated in Figure 18. The third component of the volume (V
3) was calculated using the following relation:
The coefficients a
0, a
1, a
2, a
3 of the polynomial describing curve A (Figure 19) were determined from four known points (x
ᵢ
, y
ᵢ
), where i = 1, 2, 3, 4. Each point satisfies the following condition:
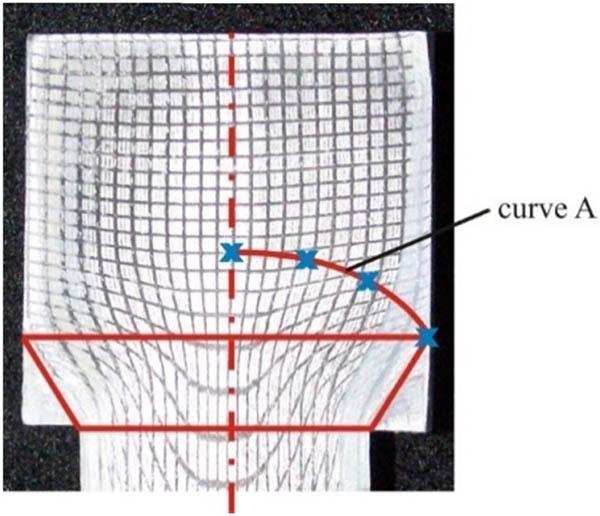
Method for Selecting the Point that Defines the Boundary of the Plastic Zone.
This set of four equations can be expressed in matrix form as follows:
By solving this system of linear equations, the values of a 0, a 1, a 2, a 3 were obtained. These coefficients define the polynomial curve representing the plastic zone boundary, which was subsequently integrated to calculate the volume component V 3.
The following shows how to calculate the coefficients a 0, a 1, a 2, a 3 for an extruded circular section (λ = 12):
-
1)
The system of equations (the x and y values are the coordinates of the four points lying on curve A – Figure 19)
-
2)
Matrix notation
Aa=b, (11) A=\left[\begin{array}{cccc}1& 0& 0& 0\\ 1& {5.45}^{2}& {5.45}^{4}& {5.45}^{6}\\ 1& {11.61}^{2}& {11.61}^{4}& {11.61}^{6}\\ 1& {18}^{2}& {18}^{4}& {18}^{6}\end{array}\right];\hspace{.5em}a=\left[\begin{array}{c}{a}_{0}\\ {a}_{1}\\ {a}_{2}\\ {a}_{3}\end{array}\right];\hspace{.5em}b=\left[\begin{array}{c}5.69\\ 5.12\\ 3.17\\ 0\end{array}\right]. -
3)
Solution
-
4)
Calculation of the volume V 3 taking into account the calculated coefficients a 0, a 1, a 2, a 3
After calculating and summing the values of V 1, V 2, and V 3, the total volume of the plastic zone V pz was obtained. The values of V pz were calculated for all cases of extruded sections.
Figure 20 shows the dependence of V pz on the cross-sectional shape of the extruded product.
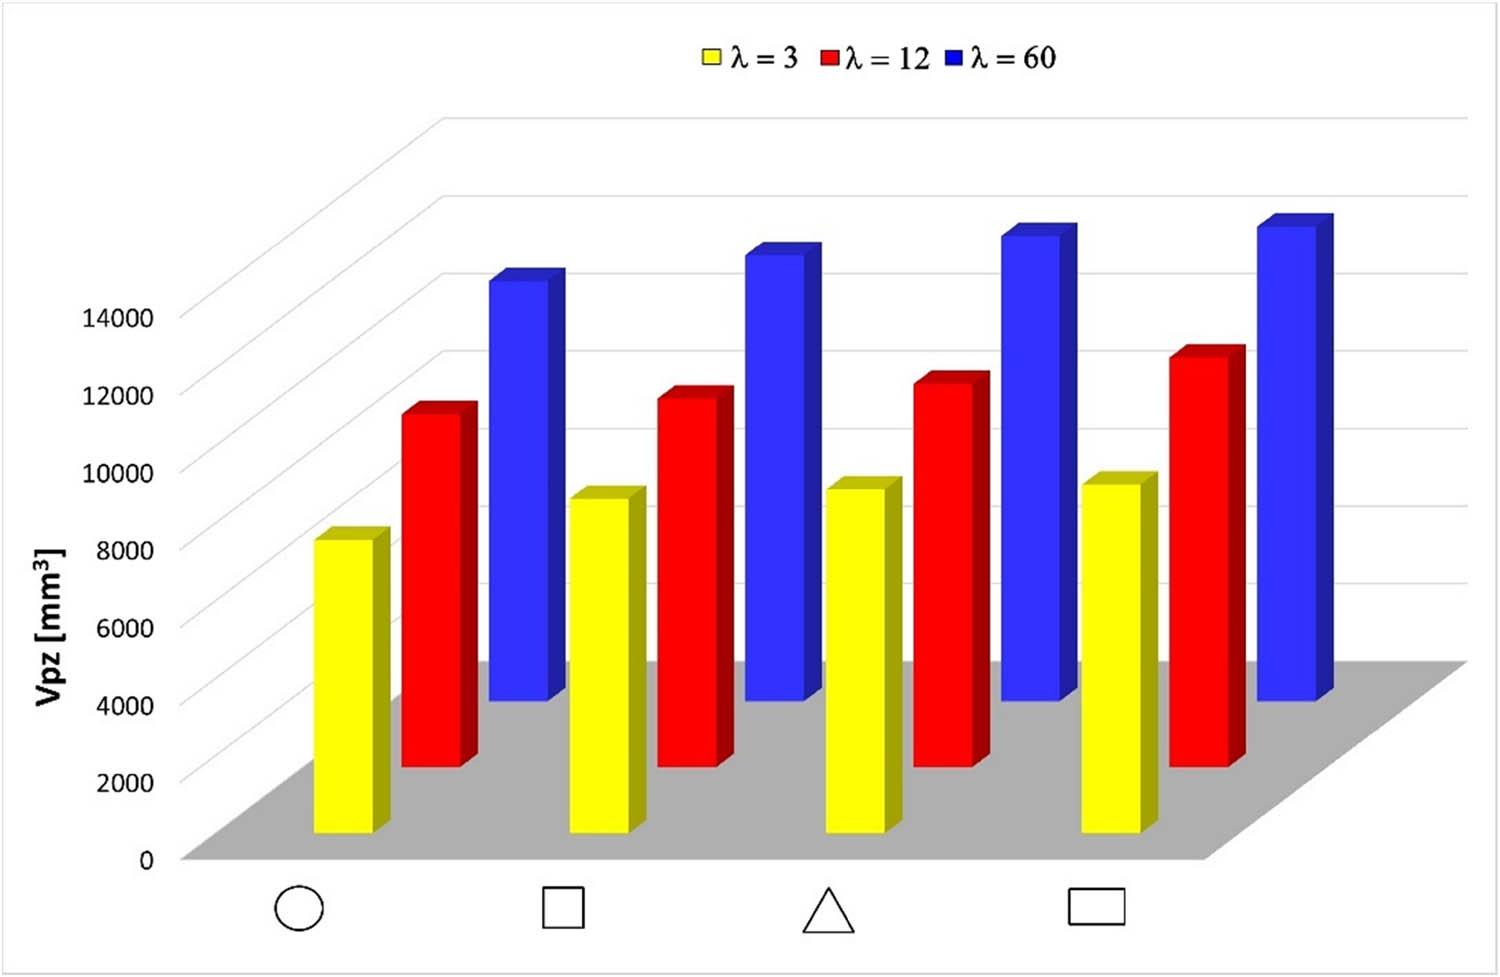
Relationship between volume of plastic zone V pz, shape of an die orifice, and extrusion ratio λ.
The volume of the plastic zone V pz varies depending on the shape of the cross-section of the extruded section and increases as the elongation factor λ increases.
Figure 21 shows the dependence of maximum extrusion force (F max) on plastic zone volume (V pz) for extruded profiles with different cross-sectional shapes.
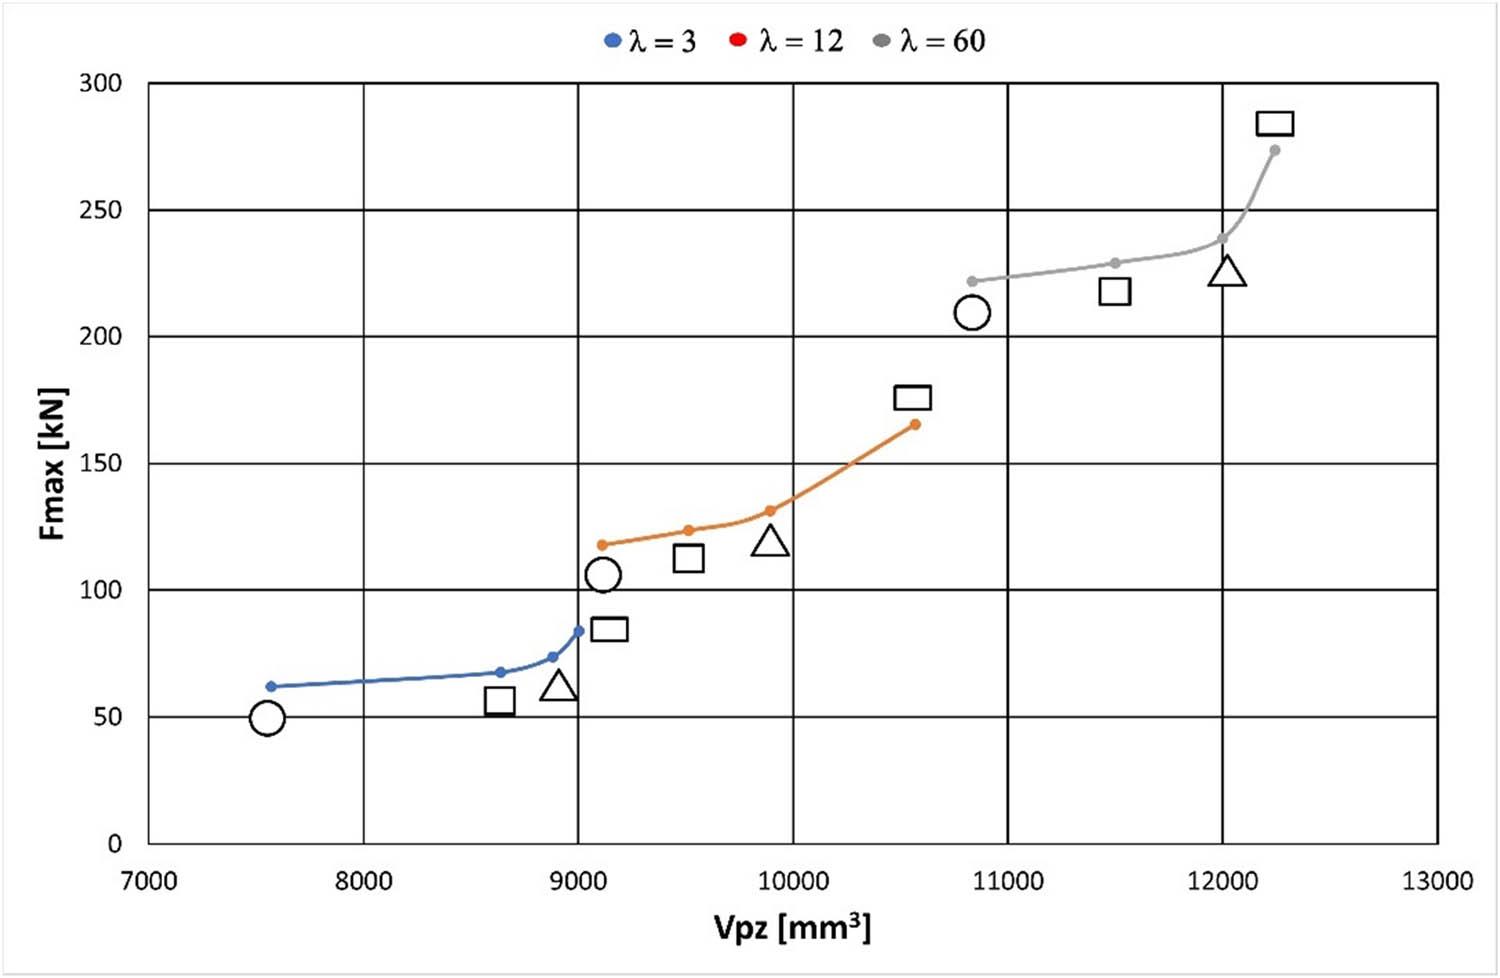
Relationship between extrusion force (F max) obtained from experimental measurements and analytically evaluated deformation zone parameters (L pz, L dz, α dz, V pz) for non-axisymmetric profiles.
The plastic zone volume (V pz) was mathematically calculated for each profile geometry, while extrusion force values were obtained experimentally and compared with the analytically determined parameters. F max increases with increasing V pz, and both V pz and F max rise with extrusion ratio (λ).
The experimental and analytical results presented in this study confirm that extruded profile geometry exerts a dominant influence on metal flow mechanics, deformation zone formation, and extrusion load. While circular section extrusion can be reasonably approximated by classical conical deformation zone models [27], extrusion of non-axisymmetric profiles deviates markedly from these assumptions. Material flow through square, triangular, and rectangular die openings was characterised by deeper and larger plastic zones (L pz, V pz), smaller or distorted dead zones (L dz), and altered dead zone angles (α dz). These changes in zone configuration led directly to a measurable increase in maximum extrusion force (F max), reaching 35–40% higher values at λ = 60 compared with circular sections. This quantitative evidence substantiates the widely held, but previously insufficiently explained, observation that extrusion of non-circular profiles requires disproportionately higher loads [21,22,23,24,25]. The present study addresses this gap by not only documenting the phenomenon but also establishing functional relationships between deformation zone parameters and extrusion force, thereby providing predictive capacity for process design.
The analysis of results obtained from the extrusion of profiles with complex cross-sectional geometry was conducted in terms of
-
–
evaluation of plastic flow behaviour as a function of product cross-sectional shape,
-
–
characterisation of the parameters defining the deformation zones,
-
–
application of the visioplasticity method to identify deformation zones and determine velocity and strain distributions in the plastic zone for a given cross-sectional shape,
-
–
determination of the relationship between deformation zone parameters (shape, size, and volume of the plastic zone) and extrusion force.
Physical modelling is an effective method for analysing complex metal forming processes and serves as a valuable tool for verifying process designs. It provides detailed insight into material flow and die filling.
The results of experimental studies on model materials, combined with theoretical analysis of process mechanics, have made it possible to identify fundamental principles governing material flow during extrusion of profiles with different cross-sectional geometries (from circular ingots to square, triangular, and rectangular sections). This provides a basis for assessing the feasibility of efficiently extruding thin-walled profiles of complex cross-sectional shape.
During extrusion, a non-uniform distribution of plastic deformation occurs in the product, caused by non-uniform velocity distribution inside the ingot. This effect is intensified when extruding non-axisymmetric profiles. A characteristic manifestation of this phenomenon is the formation of plastic and dead zones, which govern the nature of plastic flow. The observed dependence of process parameters on extrusion ratio (λ) and ingot geometry in lead extrusion has made it possible to identify the key factors governing flow mechanics in the extrusion of profiles with complex geometries.
Depending on the extruded profile shape and extrusion ratio (λ), different configurations of deformation zones (plastic and dead zones) are observed. Variations in zone size and shape, which also depend on extrusion force, are particularly evident in non-axisymmetric profiles. This behaviour arises mainly from the complex flow associated with the transition from the circular billet cross-section to the non-circular product cross-section (Figure 22). As a result, different cross-sectional shapes produce distinct extrusion force magnitudes at the same elongation factor.
Plastic flow of material during the transition from a circular billet cross-section to product cross-sections: square, triangular (A-A), triangular (B-B), and rectangular (A-A).
The depth (L pz) and volume (V pz) of the plastic zone emerged as the most critical factors influencing extrusion load. The size and shape of the plastic zone were shown to depend on die parameters, namely, orifice shape and punch velocity. As these parameters increased with cross-sectional complexity and extrusion ratio, the extrusion force rose accordingly. This finding is consistent with upper-bound theoretical analyses, which suggest that energy consumption scales with the size of the effective deformation zone. However, those studies did not provide experimental validation for non-axisymmetric cases. By combining visioplasticity experiments with mathematical formulations, the present study demonstrates not only correlation but also causality: larger plastic zone volumes directly require higher energy input to sustain plastic flow.
The dead zone parameters played a complementary role. A smaller L dz was consistently associated with higher F max, as short dead zones were less able to buffer or redistribute stress, leading to intensified deformation near the die entry. Conversely, the dead zone angle (α dz) acted as a geometrical amplifier of deformation effects: larger angles produced sharper flow redirections, increasing redundant work and frictional losses. These results are consistent with FEM analyses and experimental studies [29,31], which also highlighted the significance of dead zone geometry in extrusion mechanics.
Regarding dead-zone development, the dominant influences are die geometry, the extrudate’s flow type (S, A, B, and C according to Pearson), and friction at the interface between the extruded material and the tooling. Friction at the billet–tool interface adds boundary shear τ that raises extrusion pressure and enlarges/steepens the dead zone near the die entry. Higher friction (e.g., inadequate lubrication, rougher surfaces) shifts force–displacement curves upwards and increases steady-state load; lower friction has the opposite effect.
In the present work, friction was minimised experimentally by applying a Teflon film between the tool and the extruded material, and was omitted in the analytical treatment to isolate the geometric effects. As a result, the pressures and forces reported are lower than the actual values for the tested geometries, but the comparative trends observed for different die shapes and extrusion ratios are still valid because they were measured under consistent, controlled conditions. Future work will extend the model by including Coulomb friction or shear coefficient to determine its effect on the dead zone and pressure.
Previous studies on extrusion have largely focused on axisymmetric profiles or simplified shapes. Previous literature [34,36] emphasised the role of die design and extrusion ratio in determining extrusion force but approached deformation zones mainly as conceptual constructs rather than measurable quantities. The novelty of this study lies in its provision of a quantitative framework directly linking deformation zone parameters to extrusion load. Although several authors [28,32] introduced the concept of “shape complexity” to explain increased extrusion loads, they did not break the phenomenon down into measurable physical entities such as L pz, L dz, α dz, and V pz. The present work therefore complements and extends earlier studies by establishing both a physical and mathematical basis for the shape complexity concept.
From an industrial perspective, the ability to reduce extrusion load by up to 20% through optimisation of deformation zone geometry is of considerable significance. Because energy consumption in extrusion is directly proportional to load, excessive forces reduce tool life, accelerate press wear, and can cause product defects such as surface tearing or dimensional distortion. Practical strategies for minimising extrusion load include: optimising calibration strip length (overly long strips increase V pz and thus F max, while insufficient length may compromise dimensional accuracy); adjusting die entry angles (appropriate selection moderates dead zone formation, balancing stable flow with reduced redundant work); tailoring die orifice proportions (width-to-height ratios in rectangular sections strongly affect dead zone geometry and should be carefully considered in die design); and implementing multi-step extrusion or pre-forming (for highly complex shapes, staged deformation reduces peak loads). These guidelines extend the empirical recommendations of earlier studies [4,5] by grounding them in measurable deformation zone metrics.
The experimental approach, while robust and reproducible, has inherent limitations. Using lead (Pb1) at room temperature provided a practical analogue for hot forming of steels and aluminium alloys but does not fully capture thermal softening, strain rate sensitivity, or metallurgical transformations occurring at elevated temperatures. In addition, friction was minimised with Teflon film, which differs from industrial lubrication conditions. Thus, although the quantitative relationships established are reliable within the model framework, their direct application to industrial hot extrusion should be approached with caution. Nevertheless, the methodological approach – combining visioplasticity with analytical evaluation – remains valid and adaptable to other materials and process conditions.
Building upon this work, several avenues for further research are recommended
-
–
Extension to high-temperature extrusion conditions: experiments using aluminium or magnesium alloys under hot extrusion conditions would provide direct industrial relevance.
-
–
Advanced experimental techniques: Digital image correlation could complement visioplasticity, providing full-field strain maps, while in situ high-speed imaging could capture transient die-filling behaviour.
-
–
Numerical simulations: FEM should be employed as a parallel validation tool, enabling exploration of a wider parameter space and incorporating thermal–mechanical coupling.
-
–
Material diversity: studies on alloys with differing strain hardening, dynamic recrystallisation, and texture evolution behaviours would test the universality of the proposed model.
-
–
Integration with industrial practice: implementation of the derived mathematical models into commercial simulation software would enable die designers and process engineers to optimise extrusion conditions more efficiently.
In conclusion, this study advances understanding of extrusion mechanics for non-axisymmetric profiles by quantitatively linking deformation zone parameters to extrusion force. Unlike earlier research, which addressed shape complexity mainly in qualitative terms, the present work establishes a predictive framework supported by physical modelling and validated through mathematical analysis. The experimental findings underpin the development of guidelines for selecting extrusion process parameters, based on correlations between plastic and dead zone characteristics and the resulting force requirements. Beyond its theoretical significance, the study offers practical guidance for die design and process optimisation, with direct implications for efficiency, sustainability, and product quality.
-
–
Quantitative relationships between deformation zone parameters (plastic zone depth L pz, dead zone height L dz, dead zone angle α dz, and plastic zone volume V pz) and extrusion load were successfully established through a combination of physical modelling and analytical assessment.
-
–
Physical modelling experiments using lead billets demonstrated that non-axisymmetric profiles require extrusion loads up to 35–40% higher than circular ones at extrusion ratio λ = 60.
-
–
Analytical evaluation of deformation zones confirmed that increasing plastic zone depth and volume directly leads to higher extrusion loads, while smaller dead zone height and larger dead zone angle are consistently linked with increased force requirements.
-
–
The proposed analytical framework provides a reliable method for predicting the influence of deformation zone configuration on extrusion force, supported and validated by experimental observations.
-
–
The combined approach demonstrates that optimising deformation zone geometry can reduce extrusion load by up to 20%, which has practical implications for die design, process optimisation, and improvement of product quality.
-
–
Limitations of the present study include the use of lead at room temperature and simplified friction conditions. Nevertheless, the methodology is adaptable to other materials and processing conditions.
-
–
Future work should extend this approach to hot extrusion of aluminium and magnesium alloys, integrate advanced strain-mapping techniques (e.g. Digital image correlation), and incorporate FE simulations to complement and generalise the analytical findings.
-
–
A comprehensive mathematical model of the extrusion process is currently under development, based on the results of the physical modelling experiments presented in this study. This future work aims to establish a predictive framework that will complement the present analytical assessment and enable broader application to industrial extrusion processes.
Authors state no funding involved.
The author developed the concept and assumptions of the study, conducted the research including experiments and measurements, and performed the data analysis and interpretation of results. The author prepared the figures, diagrams, and models used in the work. Additionally, the author was responsible for writing and editing the manuscript, developing the research methods, and preparing the theoretical background along with the literature review.
Authors state no conflict of interest.