Figure 1
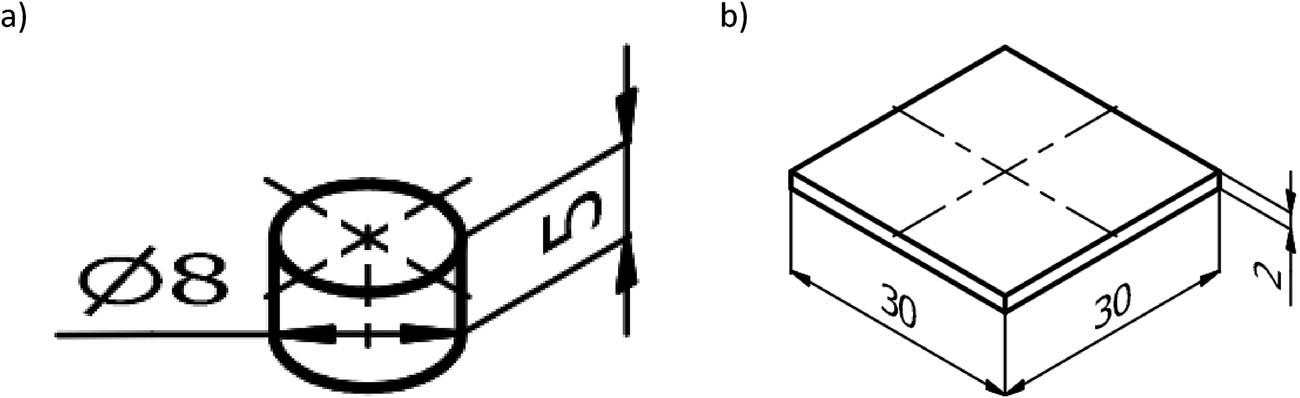
Figure 2
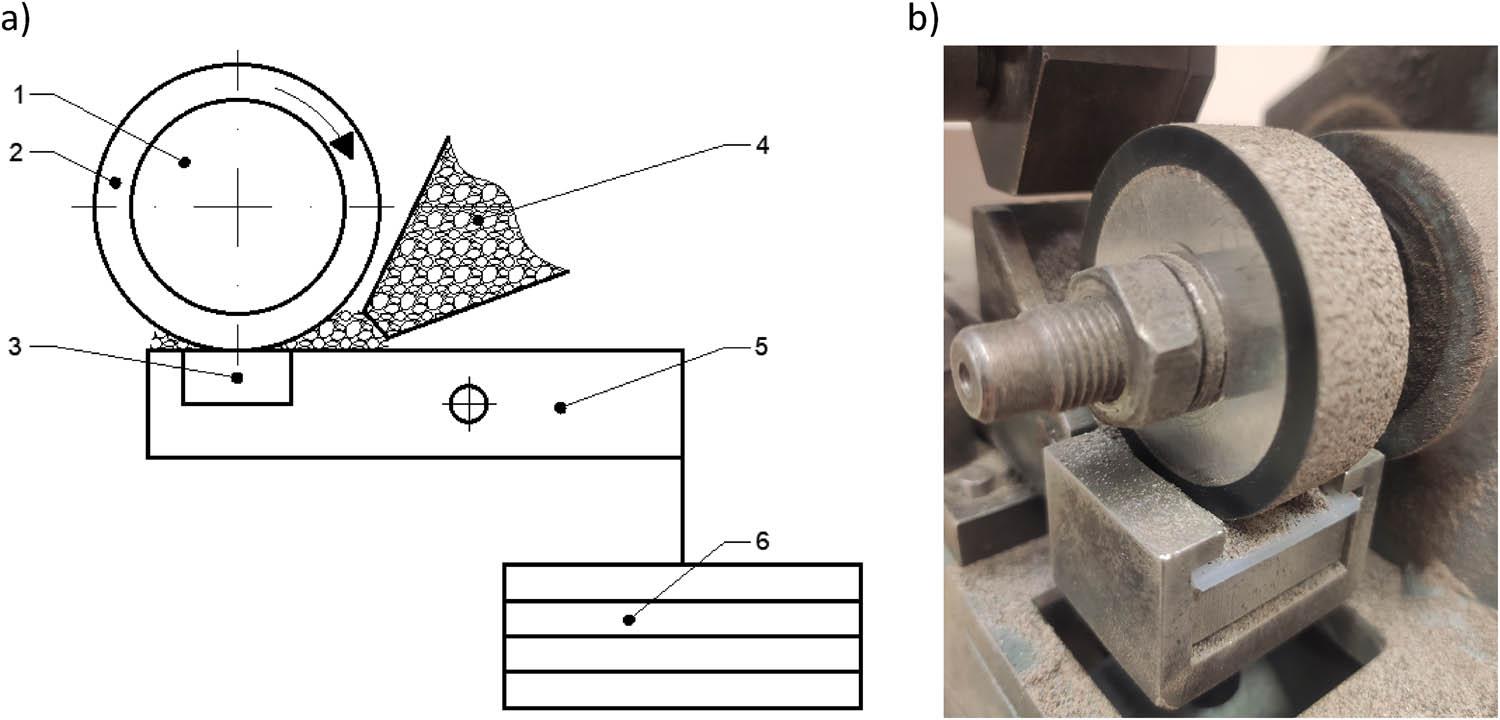
Figure 3
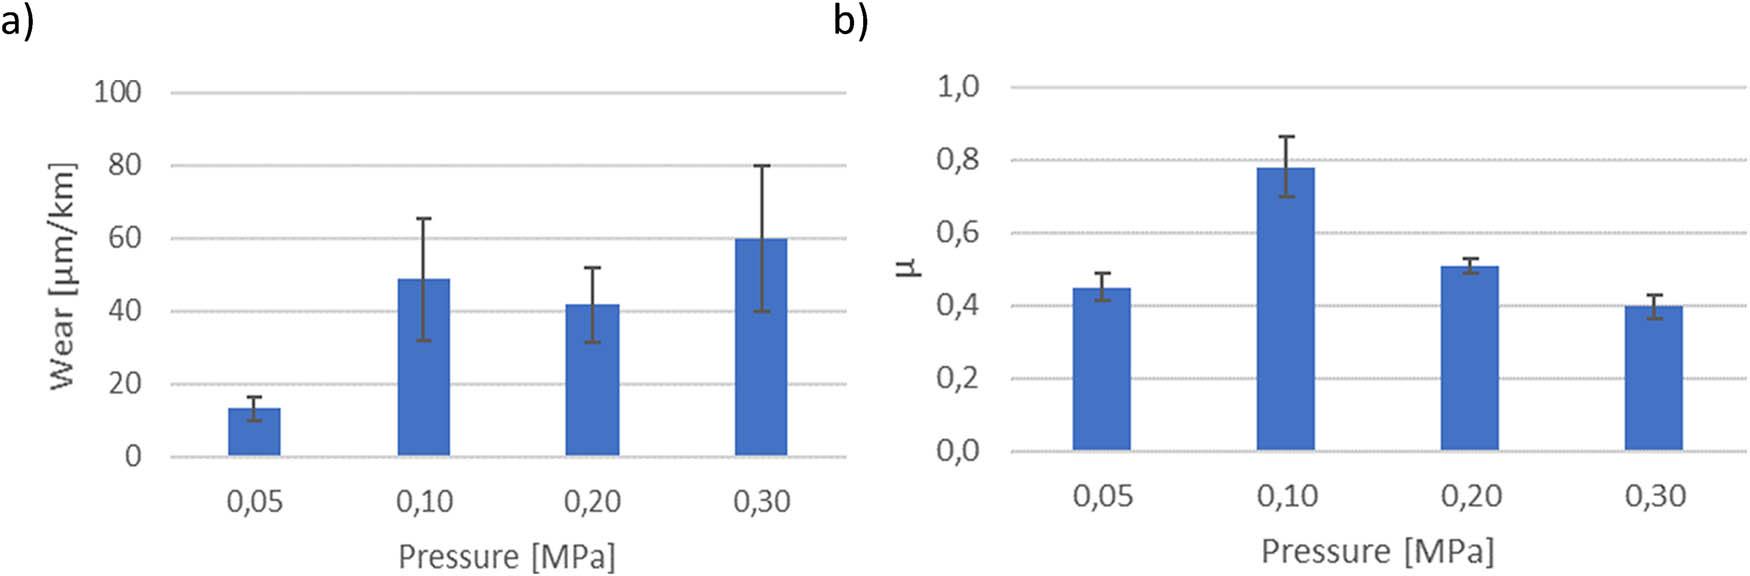
Figure 4
Figure 5
Figure 6
Figure 7
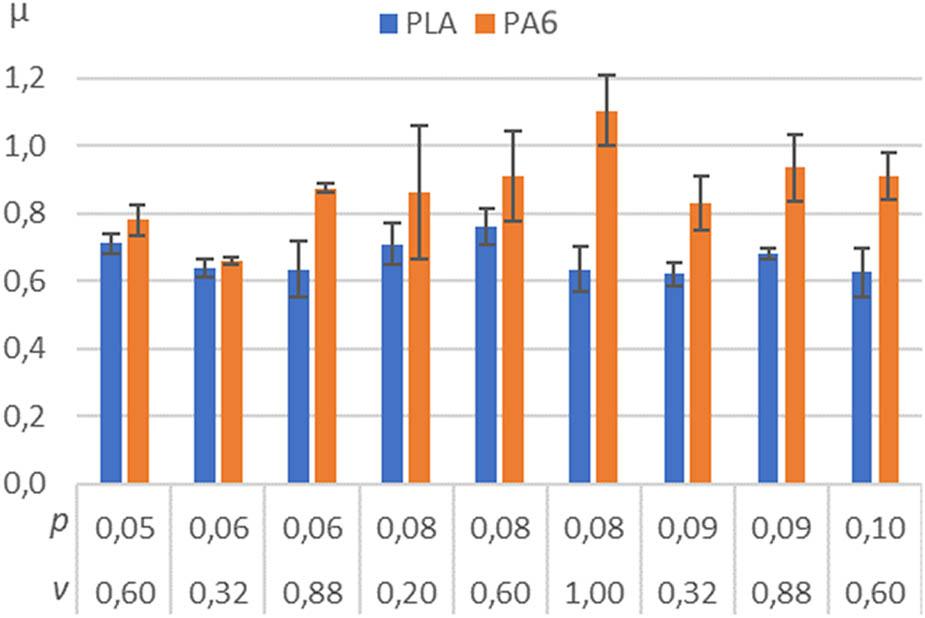
Figure 8
Figure 9
Figure 10
Figure 11
Figure 12
Key parameters of the filaments used to print the samples Source: data sheets from the manufacturer of materials (Flexiwire) [29,30,31,32]_
| PLA | PA6 | |
|---|---|---|
| Tensile yield strength | 60 MPa | 78 MPa |
| Modulus of elasticity | 3.5 GPa | 3.4 GPa |
| Tensile elongation | 6.0% | 4.4% |
| Heat deflection temperature | 55°C | 90°C |
| Coefficient of thermal expansion | 41 × 10−6
| 50 × 10−6
|
Detailed parameters of the test apparatus and abrasion resistance measurement_
| The counter-sample | Rubber lined wheel ø50 × 15 mm (hardness 78 ÷ 85ͦ ShA) |
|---|---|
| Counter-sample rotational speed | 60 rpm |
| Number of counter-sample rotations | 600 |
| Pressure force of the sample against the counter-sample | 44 N |
| Sample dimensions | 30 mm × 30 mm × 2 mm |
| Abrasive | Electrocorundum No. 90 (PN-76/M-59115) |
Results of friction and wear coefficient measurements for PLA and PA6_
| No. | p (MPa) | v (m/s) | µ (PLA) | µ (PA6) | Wear PLA (µm/km) | Wear PA6 (µm/km) |
|---|---|---|---|---|---|---|
| 1 | 0.05 | 0.60 | 0.71 ± 0.03 | 0.78 ± 0.05 | 22 ± 7 | ≤1 |
| 2 | 0.06 | 0.32 | 0.64 ± 0.03 | 0.66 ± 0.01 | 15 ± 5 | ≤1 |
| 3 | 0.06 | 0.88 | 0.63 ± 0.08 | 0.87 ± 0.01 | 10 ± 2 | ≤1 |
| 4 | 0.08 | 0.20 | 0.71 ± 0.06 | 0.86 ± 0.20 | 8 ± 2 | ≤1 |
| 5 | 0.08 | 0.60 | 0.76 ± 0.05 | 0.91 ± 0.13 | 29 ± 6 | ≤1 |
| 6 | 0.08 | 1.00 | 0.64 ± 0.07 | 1.10 ± 0.10 | 12 ± 4 | ≤1 |
| 7 | 0.09 | 0.32 | 0.62 ± 0.04 | 0.83 ± 0.08 | 20 ± 3 | ≤1 |
| 8 | 0.09 | 0.88 | 0.68 ± 0.02 | 0.94 ± 0.10 | 18 ± 3 | ≤1 |
| 9 | 0.10 | 0.60 | 0.63 ± 0.07 | 0.91 ± 0.07 | 30 ± 3 | ≤1 |
List of key parameters set during sample printing_
| PLA | PA | |
|---|---|---|
| Nozzle temperature | 220°C | 260°C |
| Bed temperature | 30°C | 90°C |
| Nozzle diameter | 0.6 mm | |
| Layer height | 0.5 mm | |
| Infill density | 100% (full) | |
| The orientation of the filling path in relation to the edge of the sample | 45° | |
| Mutual orientation of the filling path of adjacent layers | 90° | |
| The number of tracks arranged on the perimeter (contour) | 3 | |
| Contour – filling gap | 0 mm (no gap) | |
Values of p and v parameters obtained using a rotational test plan_
| No. | p (MPa) | v (m/s) |
|---|---|---|
| 1 | 0.05 | 0.60 |
| 2 | 0.06 | 0.32 |
| 3 | 0.06 | 0.88 |
| 4 | 0.08 | 0.20 |
| 5 | 0.08 | 0.60 |
| 6 | 0.08 | 1.00 |
| 7 | 0.09 | 0.32 |
| 8 | 0.09 | 0.88 |
| 9 | 0.10 | 0.60 |
Comparison of wear and friction coefficient of PLA and other plastics used in sliding components Source of data for materials other than PLA: [33]_
| No. | Material | Wear (µm/km) | No. | Material | µ |
|---|---|---|---|---|---|
| 1 | PBT | 2 | 1 | PTFE | 0.10 |
| 2 | Polyethylene terephthalate (PET) | 3 | 2 | PET | 0.20 |
| 3 | Polyether ether ketone (PEEK) | 28 | 3 | PBT | 0.23 |
| 4 | PLA | 195 | 4 | PEEK | 0.40 |
| 5 | PTFE | 1,600 | 5 | PLA | 0.54 |