acrylonitrile butadiene styrene fused deposition modeling fused filament fabrication polyamide 6 polybutylene terephthalate polycaprolactone polyether ether ketone polyethylene terephthalate poly(lactic acid) polyoxymethylene polytetrafluoroethylene ultra-high molecular weight polyethylene
Environmental contamination is one of the biggest problems currently faced by the world. It is estimated that approximately 50% of all lubricants end up in the environment [1]. Plastic sliding components contribute to reducing this problem as they can work with steel without oil or grease. Unfortunately, at the end of the product lifecycle polymer sliding components become a bothersome waste [2]. Plastic sliding components are mostly made of plastics with additives, which makes recycling very difficult. In addition, wear products released into the environment are a source of microplastics. The presence of microplastics in the human body can potentially lead to health issues [3,4]. In addition, microplastics have been reported to enter tissues [5,6,7]. A solution to this problem would be to use biodegradable polymers in sliding components.
Currently, biodegradable plastics such as poly(lactic acid) (PLA), thermoplastic starch, polyhydroxyalkanoates, polyhydroxybutyrate, polyhydroxyoctanoate, polycaprolactone (PCL), poly(butylene succinate), poly(butylene adipate-co-terephthalate) and cellulose acetate are available [8]. Unfortunately, very little information on the tribological properties of these materials was found in the literature and it was not possible to assess whether these materials could be used in sliding components. To obtain the information needed for such an assessment, the tests described in this publication were carried out.
PLA is the material that, among biodegradable polymers, has attracted the most interest from researchers and industry [9]. For this reason, the research into the tribological properties of biodegradable polymers described in this study began with PLA. Polyamide 6 (PA6), which is not a biodegradable material, yet is widely used plastic in sliding components, was also studied in order to compare the tribological properties of PLA to a plastic currently used in sliding components.
The base substance for PLA is lactic acid, which can be obtained through microbial fermentation. This means that the material can be derived from renewable resources such as corn, wheat, or rice. Furthermore, PLA is biodegradable, recyclable, and compostable. Compared to the other biodegradable materials, PLA has exceptional durability, mechanical strength, and transparency. PLA has also characteristics that limit its widespread use compared to conventional synthetic polymers: it is more expensive and more brittle. In addition, it is difficult for PLA to achieve barrier properties comparable with conventional synthetic polymers (while maintaining PLA’s biodegradability) [10]. PLA has also poorer moisture barrier properties [11].
Wear products from the interaction of plastic and steel are released into the environment, so it would be most preferable if they were biodegradable in soil or water. In the case of plastics, manufacturers specify their products as biodegradable, usually referring to EN 14046:2005 or EN 13432:2002. EN 14046 describes the method for assessing biodegradation. It specifies the required loss of material and the time and conditions under which this should occur. EN 13432 takes a broader view and addresses compostability and describes the required composting behaviour of the material. EN 13432 defines, among other things, that the material ought to reduce in weight by a minimum of 90% within 6 months as a result of biodegradation, that it ought to be broken down and that it must not adversely affect the compost in which it is placed. For both standards, the conditions under which biodegradation is assessed include high temperature, appropriate pH, and appropriate proportions of material and maturity of the compost. Material labelled as biodegradable or compostable according to these standards going directly into the environment is unlikely to degrade within the required time [12]. Such a scenario is also likely in the case of PLA labelled as biodegradable by manufacturers, as PLA requires specific conditions for biodegradation [13].
The biodegradation of PLA takes place in two stages. First there is a process called hydrolysis, which is a water-based breakdown of the polymer to smaller molecules. Then, these molecules are decomposed into carbon dioxide and water by microorganisms. Hydrolysis occurs faster at higher temperatures, so temperature is a key factor on which the rate of PLA biodegradation depends. The degradation rate of PLA is significantly higher when the ambient temperature is higher than glass transition temperature (range of 55–62°C). The polymer chains become more flexible and as a result water absorption is increased. This raised water absorption enhances both hydrolysis and microbial attachment. As a result, degradation of PLA is quicker. Moreover, at a moisture content of more than 60%, PLA degradation due to hydrolysis occurs very quickly. Under composting conditions (presence of microorganisms, increased temperature, and humidity), PLA can be degraded within 45–60 days at temperatures ranging from 50 to 60°C [14].
The significant effect of temperature on PLA biodegradation is highlighted by studies of PLA biodegradation in soil and water. Borelbach et al. studied the biodegradation of PLA fibres in soil at 23°C and in compost at 58°C [15]. After 12 weeks in soil, the PLA showed no degradation. After 4 weeks in compost, PLA showed a decrease in strength and molecular weight.
Soil burial tests carried out by Rudnik and Briassoulis showed that the degradation of PLA in soil environment under real conditions is slow [16]. The authors indicate that PLA is not an appropriate material for agricultural applications as it does not biodegrade at a sufficient rate under either real soil conditions or under farm composting conditions (i.e. at low temperature compost).
Few studies have been found for PLA biodegradation in water. In terms of both static and dynamic sea water, no signs of microbial degradation were observed after 10 weeks. The researchers try to explain this by the fact that microorganisms present in seawater can poorly degrade PLA [17,18]. In another study, PLA rods were immersed in seawater for 3 months at 20°C. There was a small decrease in the molecular weight of the PLA. However, when seawater had temperature of 40°C, 48% decrease in molecular weight was observed. Authors connected this degradation with hydrolysis rather than microbial degradation [19].
As increased temperature, humidity, and the presence of suitable microorganisms are required for the rapid and efficient biodegradation of PLA, it is more accurate to call PLA “compostable” rather than “biodegradable.”
In the case of PLA, some work can be found on tribological properties. However, the main focus of those studies was to determine the tribological properties of 3D prints, not the PLA material itself. PLA is very popular for 3D printing by fused deposition modeling/fused filament fabrication (FFF) method. For this reason, researchers testing the tribological properties of 3D prints very often make specimens from PLA.
Most of these papers are entirely focused on the tribological properties of 3D prints. Şirin et al. found that filling the interior of a PLA print has a significant effect on the friction coefficient [20]. Parlar et al. showed the distinctive effect of the layer orientation and layer thickness on friction coefficient and wear rate of 3D printed PLA [21]. Zhang et al. also studied the effect of infill and printing direction on friction and wear of 3D printed PLA specimen but under reciprocating sliding condition [22]. Cojocaru et al. found that the friction coefficient of 3D printed PLA is affected by the printing temperature and even the colour of the filament [23]. Yap et al. indicated that the friction coefficient of PLA is significantly affected by the printing temperature [24].
From some tribological studies of 3D prints, conclusions can also be drawn about the PLA material and not just about 3D prints in general. Ramadan et al. compared the coefficient of friction and wear of printed PCL, Acrylonitrile Butadiene Styrene (ABS), PLA, and co-polyester [25]. They found that ABS and PCL had a higher coefficient of friction than PLA. It is worth mentioning that PCL is also a biodegradable material. In terms of wear, PLA showed the least wear of these four materials. It is promising that PLA has better tribological properties than these materials, but PCL, ABS, and co-polyester are not used in sliding components.
Chisiu et al. compared the friction and wear of 3D printed PLA to ultra-high molecular weight polyethylene (UHMWPE) produced with traditional method [26]. UHMWPE is a material used for sliding components also in endoprostheses. UHMWPE was characterised by a much lower coefficient of friction than PLA. Mathurosemontri et al. studied the friction coefficient and wear of neat PLA and neat polyoxymethylene (POM) and PLA/POM blends [27]. It was found that friction coefficient of neat POM is lower than neat PLA. It appears that PLA has worse tribological properties than POM and UHMWPE, which are the materials currently used in sliding components.
Fekete presented a numerical wear analysis of a PLA-made spur gear [28], which indicated a strong relationship between friction coefficient and wear and highlighted the temperature sensitivity of PLA. The performed simulation indicated that even a 5°C rise in temperature causes 40% wear progression. Therefore, the temperature resistance of PLA during friction is given special attention in this article.
For sliding elements, it is not only friction and wear that are important, but also other properties such as mechanical and thermal properties. Sliding elements are heavily loaded during operation, so the material used in them should have considerable strength. After loading, the sliding elements should be as close as possible to their original dimensions. Therefore, a significant value of elastic modulus (E) is also desirable. Heat is generated during friction, so the material should remain stiff and strong at increased temperatures. In addition, an increase in temperature should not cause too much change in the dimensions of the component, so a small value for the coefficient of thermal expansion is desirable.
The properties of plastics depend on various factors such as the processing method or degree of crystallinity, so when comparing the properties of PLA and PA6, values were obtained from the manufacturer’s data sheets of the materials used in the study [29,30]. The manufacturer did not provide information on the coefficient of thermal expansion, so these data were taken from the literature [31,32]. PLA and PA6 have very similar modulus of elasticity and coefficient of thermal expansion (Table 1). Tensile yield strength for both materials is high, but 18 MPa higher for PA. PA achieves slightly less tensile elongation. The most significant difference can be seen for heat deflection temperature. PLA is significantly less resistant to increased temperature.
Key parameters of the filaments used to print the samples Source: data sheets from the manufacturer of materials (Flexiwire) [29,30,31,32].
| PLA | PA6 | |
|---|---|---|
| Tensile yield strength | 60 MPa | 78 MPa |
| Modulus of elasticity | 3.5 GPa | 3.4 GPa |
| Tensile elongation | 6.0% | 4.4% |
| Heat deflection temperature | 55°C | 90°C |
| Coefficient of thermal expansion | 41 × 10−6
| 50 × 10−6
|
A major advantage is that PLA has similar strength properties to PA6. In addition, it is readily available and manufacturers can even offer PLA-based composites.
The disadvantage of PLA is that it does not biodegrade efficiently in soil and water but needs industrial composting. In addition, a problem limiting its use in sliding components can be its degradation when exposed to moisture. A few publications comparing the tribological properties of PLA to materials used in sliding components indicate that PLA has significantly worse tribological properties. In addition, the sensitivity of PLA to heat generated during friction is also an important phenomenon that must be taken into consideration while using it.
No studies comprehensively characterising PLA friction at different pressures and velocities were found during the literature review. The articles found in the literature examined PLA friction only for selected pressures and speeds. This article examined PLA friction for a wide range of pressures and velocities. This research indicated the maximum velocity and pressure values at which PLA can cooperate with steel. This indicated the main problem with PLA that prevents its use in sliding elements, i.e. the low temperature resistance. This is emphasised by the comparison with PA6, which was able to work with steel at almost seven times higher pressure than PLA (for a speed of 1 m/s). This means that in order to obtain a sliding element made of biodegradable plastic, attempts should be made to improve the properties of PLA by using additives or processes such as annealing.
Two materials were used during the current research: a biodegradable plastic PLA and PA6. PA6 is a plastic made from fossil fuels that is not biodegradable, but is widely used in sliding components. PA6 is relatively inexpensive, machining of PA6 is quite easy (which is usually a problem with plastics), and has good tribological properties when working with steel. Measurements were also made for PA6 to compare biodegradable PLA to a polymer widely used in sliding components.
In general, the material used for a sliding component should have a low coefficient of friction and little wear when working with steel. However, to assess whether PLA has the potential to be used in sliding components, a comprehensive study was carried out to evaluate key tribological properties such as
-
–
static friction coefficient,
-
–
kinetic friction coefficient,
-
–
wear, and
-
–
resistance to abrasive wear.
These results were supplemented with hardness measurements.
PLA and PA6 were purchased as 1.75 mm diameter filaments from the manufacturer Plexiwire. The manufacturer’s specified material parameters are listed in Table 1 in Section 1.
The samples were printed on a Zortrax M300 Dual printer operating in FFF technology. The PLA and PA6 filaments were dried in a filament dryer for 6 h before printing. PLA was dried at 50°C and PA6 at 60°C. The drying was carried out to remove any moisture that the material may have absorbed. When the filament is heated in the printer head, the remaining moisture can evaporate causing unwanted pores in the printed material. Thanks to drying, the appearance of unwanted pores is lowered. The parameters used during printing are presented in Table 2.
List of key parameters set during sample printing.
| PLA | PA | |
|---|---|---|
| Nozzle temperature | 220°C | 260°C |
| Bed temperature | 30°C | 90°C |
| Nozzle diameter | 0.6 mm | |
| Layer height | 0.5 mm | |
| Infill density | 100% (full) | |
| The orientation of the filling path in relation to the edge of the sample | 45° | |
| Mutual orientation of the filling path of adjacent layers | 90° | |
| The number of tracks arranged on the perimeter (contour) | 3 | |
| Contour – filling gap | 0 mm (no gap) | |
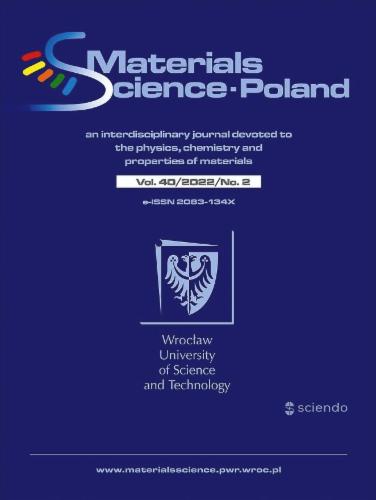
The specimens for friction and wear measurements on the pin-on-disc bench were prepared according to the ASTM G99-17 standard and were cylinders with a diameter of 8 mm and a height of 5 mm (Figure 1a).
Dimensions of test specimens: (a) The pin-on-disc test and (b) the abrasion resistance test.
The specimens for abrasion wear resistance measurements were made according to the GOST 23.208-79 standard and were 30 mm × 30 mm × 3 mm (width × length × thickness) cuboids (Figure 1b).
The static friction coefficient, kinetic friction coefficient and wear were determined on a pin-on-disc test apparatus, where a cylindrical (8 mm diameter) plastic specimen cooperated with a disc. Disc was made of C45 steel (1.0503). The material was hardened and tempered, resulting in a hardness of 44.7 HRC. The surface of the disc was grinded, which resulted in round, concentric machining marks. The linear velocity vector of the disc is tangential to the described marks. The roughness was Ra = 1.0 ÷ 1.1 µm. The friction force was recorded during the cooperation. Wear was determined using a micrometre. The height of the specimen was measured before and after covering the friction distance (1,000 m). The difference in height is the wear.
The pin-on-disc test apparatus was equipped with a DC motor so that torque was available from the lowest rotational speed. This was used to determine the static friction coefficient. During start-up, the motor transferred an increasing torque to the steel disc until a movement against the plastic specimen was achieved. The force at which the movement started was marked and this was the static friction force.
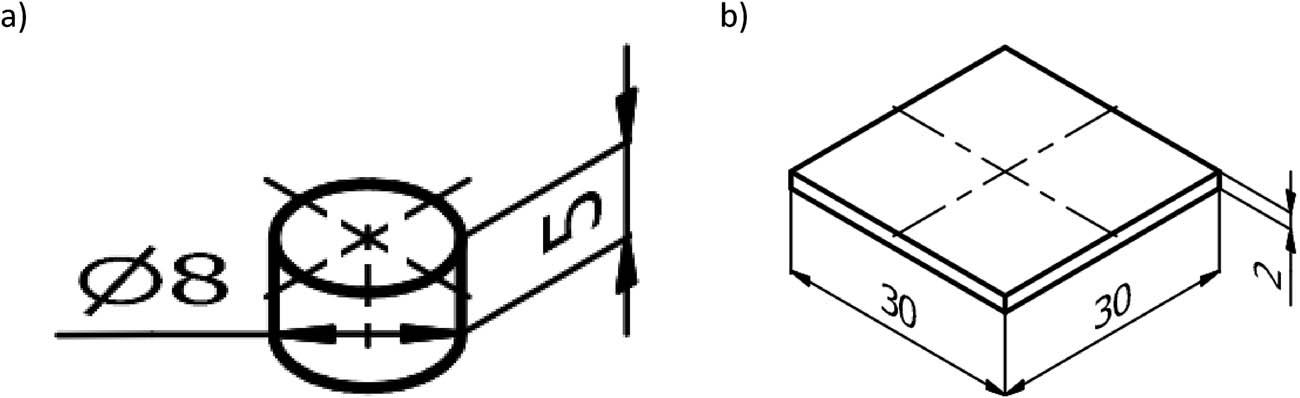
Wear resistance was measured using a T-07 tester manufactured by MCNEMiT in Radom, Poland. This device carries out wear resistance tests according to the guidelines contained in GOST 23.208-79 standard. The described method of testing is very similar to the more widely used ASTM G65-16 standard. An abrasive is continuously introduced between a rotating steel disc with a rubber rim and the sample (Figure 2). An abrasive was an electrocorundum indicated as 90. Electrocorundum is a synthetically produced form of aluminium oxide (Al2O3) with regular and sharp crystals. The indication 90 states that the grain size of the abrasive ranged from 125 to 180 µm (according to PN-76/M-59115 standard).
The abrasive wear resistance test apparatus: (a) Scheme: 1 – steel disc, 2 – rubber rim, 3 – sample, 4 – nozzle with electrocorundum, 5 – lever, and 6 – weights; and (b) photo of rubber rim and sample.
The abrasive interacted with the sample causing it to lose mass. The mass loss was determined by weighing the sample before and after the test. However, the results were presented as volume loss. The volume of material removed was calculated using the change in material mass and density. The material density of the sample was obtained by measuring its mass and dimensions (the volume of the sample was calculated from the dimensions).
Detailed apparatus and measurement parameters are included in Table 3.
Detailed parameters of the test apparatus and abrasion resistance measurement.
| The counter-sample | Rubber lined wheel ø50 × 15 mm (hardness 78 ÷ 85ͦ ShA) |
|---|---|
| Counter-sample rotational speed | 60 rpm |
| Number of counter-sample rotations | 600 |
| Pressure force of the sample against the counter-sample | 44 N |
| Sample dimensions | 30 mm × 30 mm × 2 mm |
| Abrasive | Electrocorundum No. 90 (PN-76/M-59115) |
Shimadzu HMV‐2 hardness tester was used during the research. For the Vickers hardness measurements, the load 1.961 N and the load time 5 s were used.
The temperature was measured with a CEM pyrometer model DT-8855.
In the case of plastics interacting with steel, a dependence of the coefficient of friction and wear on velocity and pressure is observed. Therefore, measurements were carried out for different velocities and pressures. Measurements determining the kinetic coefficient of friction and wear were carried out for different pressure p and velocity v (p from 0.05 MPa to 0.1 MPa and v up to 1 m/s). In order to obtain the dependence of wear and friction coefficient on p and v, and to make an optimal (not too numerous) number of measurements, a rotational plan of the experiment was used. This plan involves performing tests for nine sets for two input variables (p and v) (Table 4). The stellar arm of the plan was α = 1.414. The plan was generated with the help of the Statistica computer programme from StatSoft.
Values of p and v parameters obtained using a rotational test plan.
| No. | p (MPa) | v (m/s) |
|---|---|---|
| 1 | 0.05 | 0.60 |
| 2 | 0.06 | 0.32 |
| 3 | 0.06 | 0.88 |
| 4 | 0.08 | 0.20 |
| 5 | 0.08 | 0.60 |
| 6 | 0.08 | 1.00 |
| 7 | 0.09 | 0.32 |
| 8 | 0.09 | 0.88 |
| 9 | 0.10 | 0.60 |
Four repetitions were performed for each set of parameters from the rotational plan. The obtained dataset was then statistically analysed. A significance level of 0.05 was assumed in the statistical analyses.
First, the results were checked using the Dixon test to detect outliers. With an assumed probability of 0.95 and four measurements, the critical parameter value was 0.77.
In a further procedure, an analysis of homogeneity of variance was carried out using the Levene’s test and the Snedecor’s F test (Fischer) to determine whether the parameters p and v significantly influenced wear and friction coefficient.
For the range of parameters tested, p and v were found to have no significant effect on wear and coefficient of friction. Therefore, a surface equation showing the dependence of friction coefficient and wear on p and v was not determined.
The chapter presents the results of static and kinetic friction coefficient, and wear and hardness tests.
The pin-on-disc test apparatus allowed measurements to be carried out at velocities up to 1 m/s. The research began by determining the capabilities of PLA and PA6 materials. This was to determine at what pressure the material could work at the maximum velocity available on the test apparatus of 1 m/s.
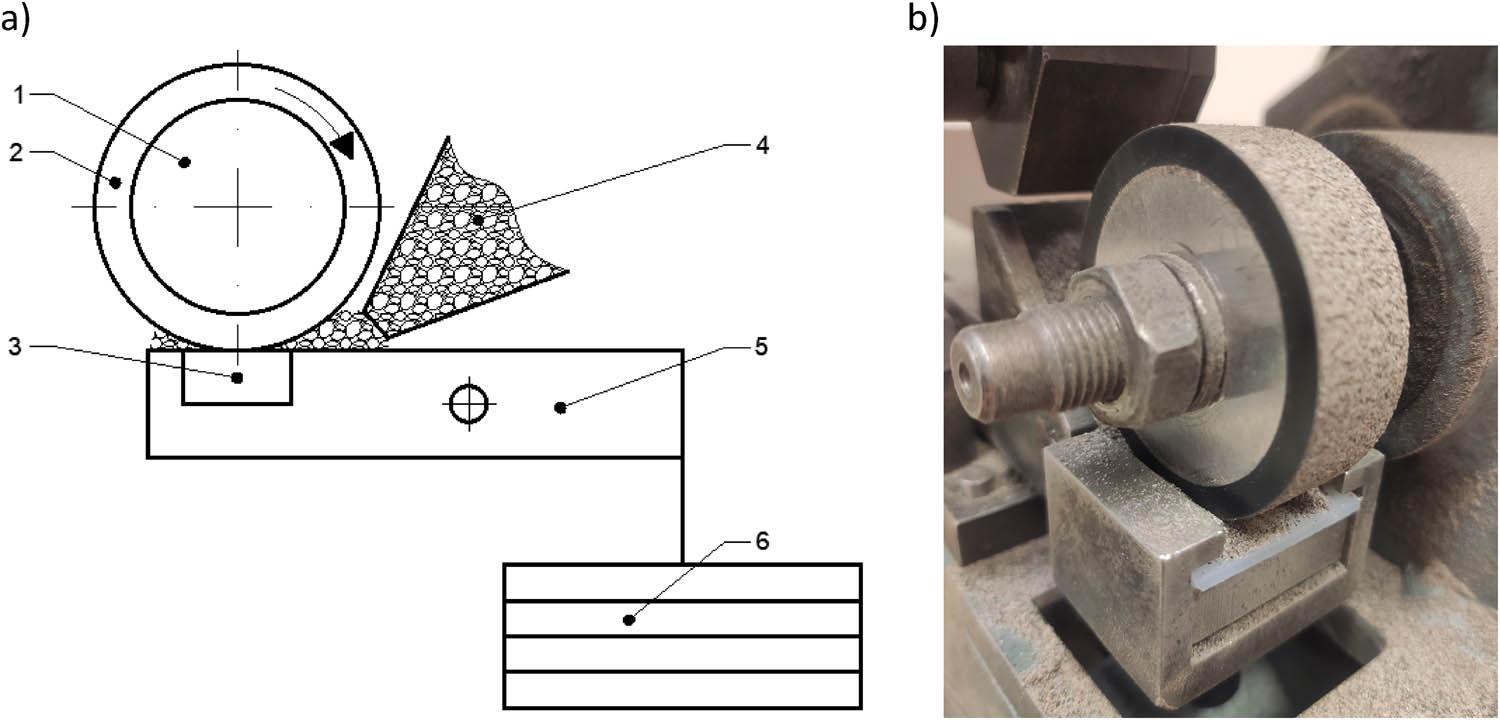
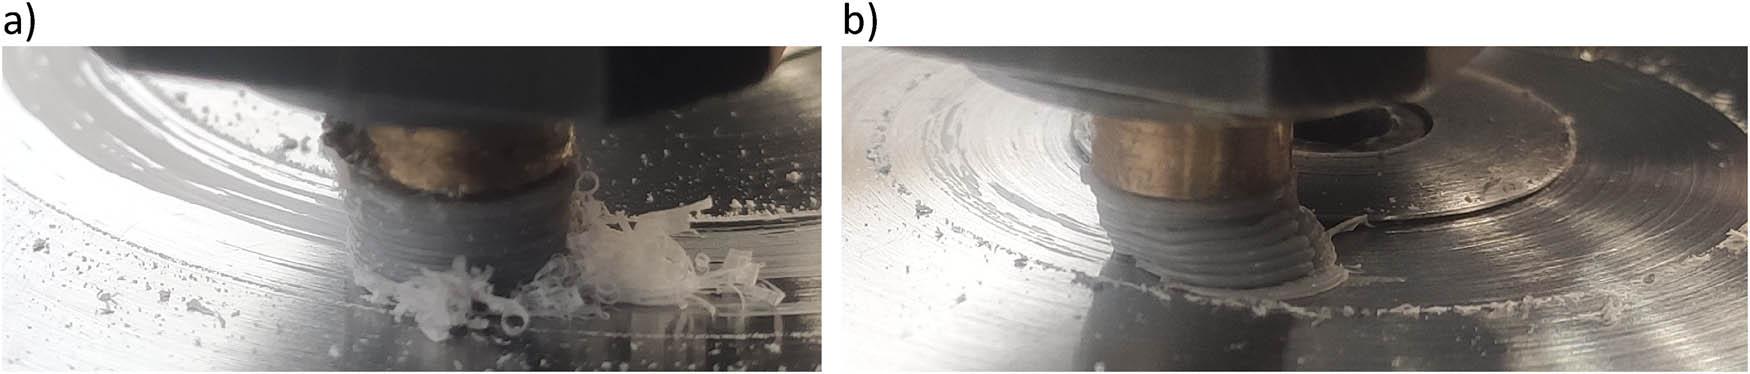
In case of PLA, at a velocity of v = 1 m/s and p = 0.05 MPa, the wear was 13 ± 3 µm/km (Figure 3). After test, freely scattered wear products were observed on the disc (Figure 4a). When the pressure was increased to p = 0.1 MPa, the wear reached a much higher value (49 µm/km). The lateral surface of the specimen reached a temperature of about 43°C. A “braid, plume” was formed behind the specimen (Figure 4b and c). Most likely, the temperature in the contact zone was high enough that the material started to flow plastically. The plasticised material was pushed by the disc behind the specimen, and there it cooled and solidified to form the previously mentioned “braid, plume”-like form. “Smearing” of the plastic was observed on the surface of the steel disc.
The results obtained for a PLA specimen at 1 m/s and varying pressure: (a) wear and (b) coefficient of friction.
PLA specimen after interaction with a steel disc at parameters: (a) v = 1 m/s and p = 0.05 MPa, visible scattered loose wear products; (b) v = 1 m/s and p = 0.1 MPa, visible “braid, plume” behind the specimen, and “shreds” of plastic on the disc; and (c) v = 1 m/s and p = 0.4 MPa, specimen deformed from temperature.
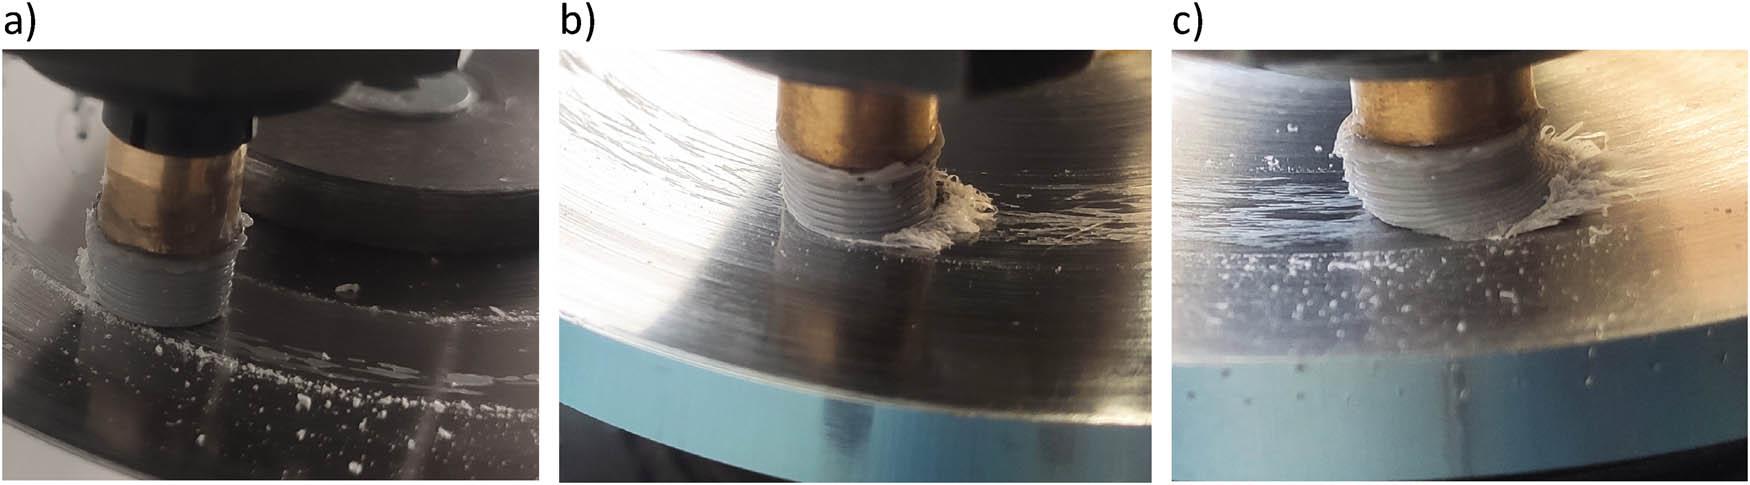
In the case of PA, at a velocity of 1 m/s, a pressure of 2 MPa wear was almost seven times higher than that for PLA (Figure 5a and b). When cooperating with p = 1 MPa, the lateral surface of the specimen reached 90°C, and with p = 2 MPa 115°C. After prolonged cooperation with p = 1 MPa, a small “plume, braid” appeared behind the specimen (Figure 5c). In the case of PA (compared to PLA), it was much smaller and appeared after a significantly longer friction path. At a pressure of less than 1 MPa, no “plume, braid” was observed for PA. At a pressure of 2 MPa, the braid also appeared, but no deformation of the specimen was observed.
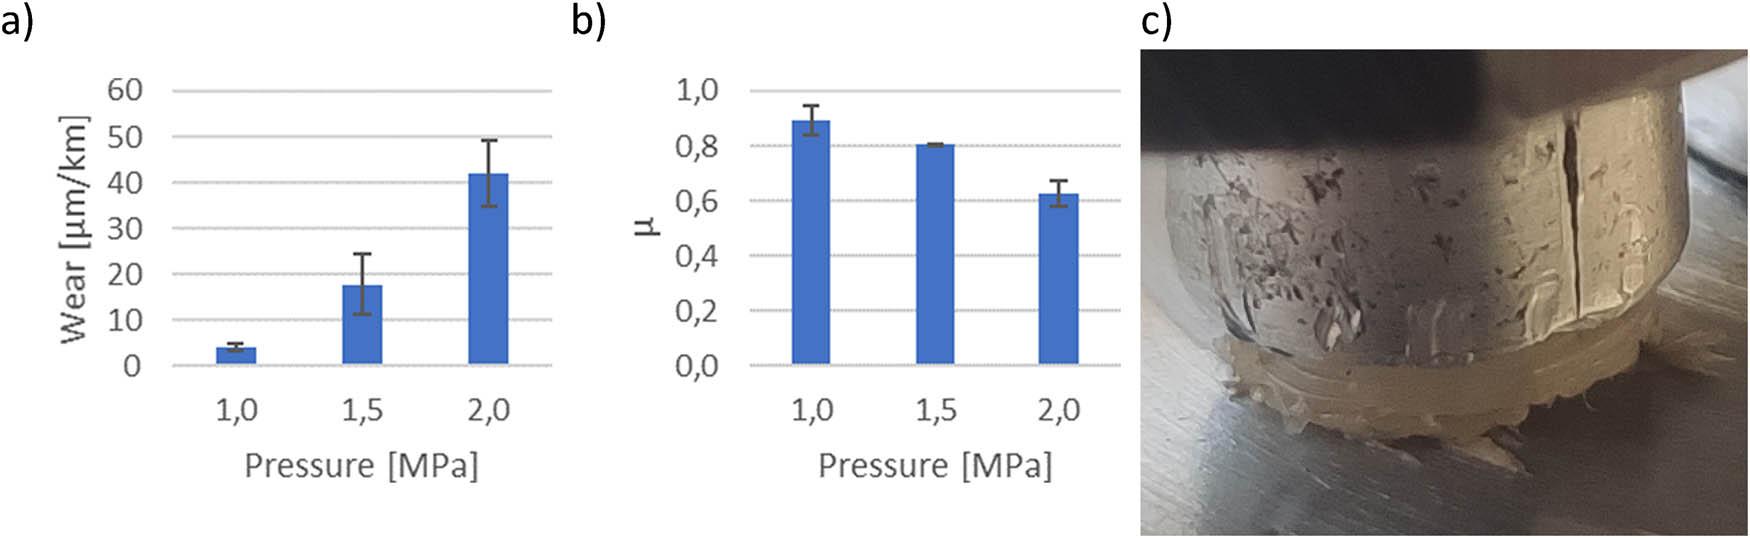
The results and effects of the interaction of PA6 with a steel disc at a velocity of 1 m/s and varying pressure: (a) wear; (b) coefficient of friction; and (c) appearance of the specimen after interaction with pressure p = 1.0 MPa, a small “braid, plume” behind the specimen was visible.
In order to compare PLA to other plastics used for sliding components, dataset from literature was used. Wieleba presented a list of friction and wear coefficients for 14 plastics used for sliding elements [33]. The discussed data were obtained for cooperation at a speed of v = 0.33 m/s and p = 3 MPa. For four materials, the cooperation parameters v = 0.33 m/s and p = 3 MPa were too high, so they were tested for v = 0.5 m/s and p = 0.7 MPa. In order to refer to the results for the other plastics, the interaction of PLA with steel was tested for two sets of parameters v = 0.33 m/s and p = 3 MPa and v = 0.5 m/s and p = 0.7 MPa.
At v = 0.33 m/s and p = 3.0 MPa, the specimen travelled about 300 m and deformed by excessive temperature to such an extent that further measurement was not possible (Figure 6). The parameters v = 0.33 m/s and p = 3.0 MPa were too high for PLA, so the material was tested for a second set of parameters with less pressure (v = 0.5 m/s and p = 0.7 MPa).
The PLA specimen and steel disc after cooperation with parameters: (a) v = 0.5 m/s and p = 0.7 MPa. Visible “braid, plume” of wear products behind the specimen, as well as “smears” of plastic on the disc and scattered, free wear products and (b) v = 0.33 m/s and p = 3.0 MPa, specimen deformed due to excessive temperature.
The interaction of PLA with steel with the parameters v = 0.5 m/s and p = 0.7 MPa was possible. The specimen did not deform as with v = 0.33 m/s and p = 3.0 MPa. Despite this, the wear was 195 µm/km and a “braid, plume” was formed behind the specimen from accumulated wear products (Figure 6a). In addition, many scattered free wear products were observed, as well as a “mearing” of the plastic on the steel disc.
When compared with other plastics, PLA performs poorly, ranking last and penultimate in terms of lowest to highest wear and friction coefficient (Table 5). The other plastics perform much better, especially in terms of wear. For PLA, it is 195 µm/km and for others, only a few or a few tens of µm/km. Only polytetrafluoroethylene (PTFE) has a significantly higher wear rate than PLA. PTFE in its unmodified form has very high wear, but with the addition of a filler, e.g. bronze powder, the wear decreases to only 1 ÷ 2 µm/km. It is possible that adding a suitable filler to PLA will also significantly reduce wear.
Comparison of wear and friction coefficient of PLA and other plastics used in sliding components Source of data for materials other than PLA: [33].
| No. | Material | Wear (µm/km) | No. | Material | µ |
|---|---|---|---|---|---|
| 1 | PBT | 2 | 1 | PTFE | 0.10 |
| 2 | Polyethylene terephthalate (PET) | 3 | 2 | PET | 0.20 |
| 3 | Polyether ether ketone (PEEK) | 28 | 3 | PBT | 0.23 |
| 4 | PLA | 195 | 4 | PEEK | 0.40 |
| 5 | PTFE | 1,600 | 5 | PLA | 0.54 |
The coefficient of friction for PLA was 0.54 ± 0.05 and was the highest among the plastics tested.
After obtaining the results of PLA and PA6 wear (Table 6), an analysis of homogeneity of variance was performed using the Levene’s test, which confirmed the homogeneity of variance. However, Snedecor’s (Fischer’s) F-test showed that in this range of p and v, no significant dependence of PA6 and PLA wear on p and v could be seen. Therefore, the equation for the dependence of wear and coefficient of friction on velocity and pressure was abandoned. Most likely, the pressure range up to 0.1 MPa is too small to observe the effect of pressure on wear. Furthermore, with such a low pressure, it is most likely that the dependence of wear on velocity is low.
Results of friction and wear coefficient measurements for PLA and PA6.
| No. | p (MPa) | v (m/s) | µ (PLA) | µ (PA6) | Wear PLA (µm/km) | Wear PA6 (µm/km) |
|---|---|---|---|---|---|---|
| 1 | 0.05 | 0.60 | 0.71 ± 0.03 | 0.78 ± 0.05 | 22 ± 7 | ≤1 |
| 2 | 0.06 | 0.32 | 0.64 ± 0.03 | 0.66 ± 0.01 | 15 ± 5 | ≤1 |
| 3 | 0.06 | 0.88 | 0.63 ± 0.08 | 0.87 ± 0.01 | 10 ± 2 | ≤1 |
| 4 | 0.08 | 0.20 | 0.71 ± 0.06 | 0.86 ± 0.20 | 8 ± 2 | ≤1 |
| 5 | 0.08 | 0.60 | 0.76 ± 0.05 | 0.91 ± 0.13 | 29 ± 6 | ≤1 |
| 6 | 0.08 | 1.00 | 0.64 ± 0.07 | 1.10 ± 0.10 | 12 ± 4 | ≤1 |
| 7 | 0.09 | 0.32 | 0.62 ± 0.04 | 0.83 ± 0.08 | 20 ± 3 | ≤1 |
| 8 | 0.09 | 0.88 | 0.68 ± 0.02 | 0.94 ± 0.10 | 18 ± 3 | ≤1 |
| 9 | 0.10 | 0.60 | 0.63 ± 0.07 | 0.91 ± 0.07 | 30 ± 3 | ≤1 |
Once the friction coefficient results were obtained (Table 6), a homogeneity of variance analysis was carried out using the Levene’s test, which confirmed the homogeneity of variance. However, Snedecor’s (Fischer’s) F-test showed that in this range of p and v, no significant dependence of the friction coefficient on p and likewise on v were observed. Therefore, the equation for the dependence of wear and friction coefficient on velocity and pressure was abandoned. Most likely, the pressure range up to 0.1 MPa is too small to observe the effect of pressure on the friction coefficient. In addition, at such a low pressure, it is most likely that the dependence of the friction coefficient on speed is low.
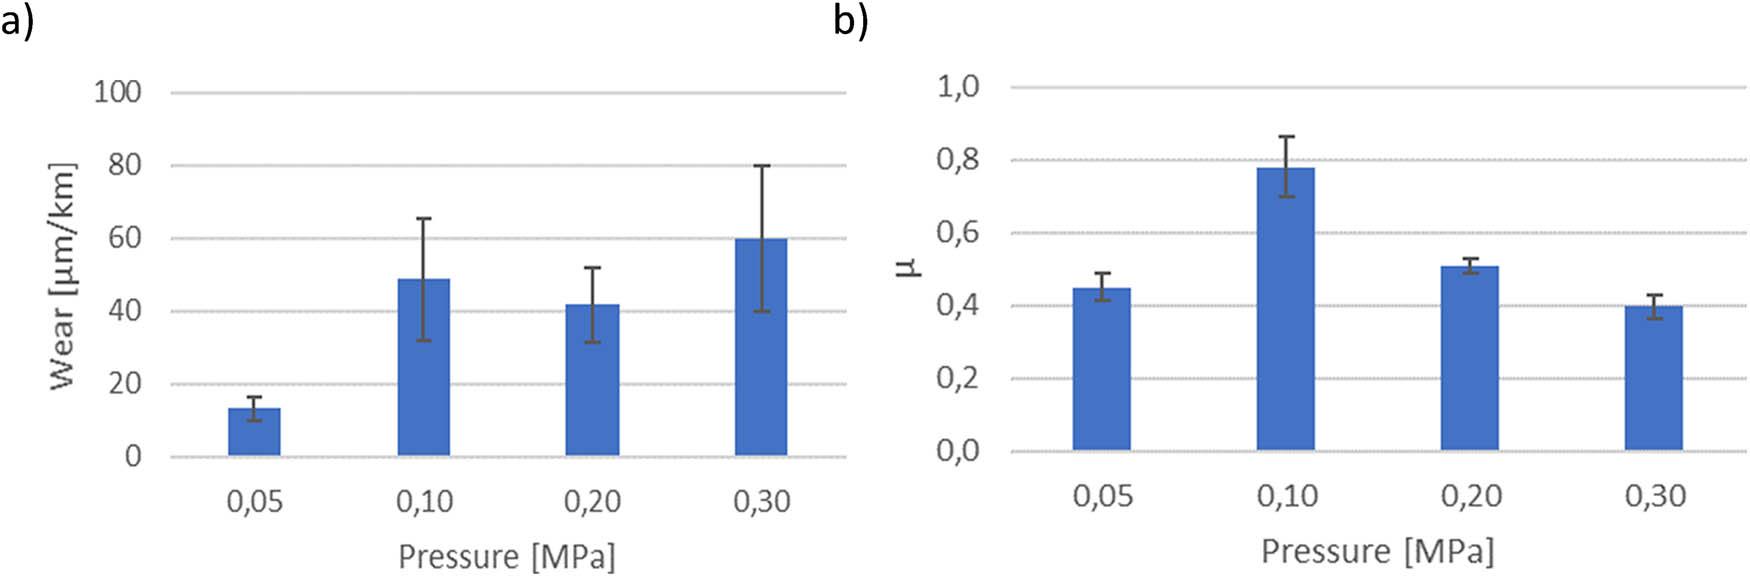
When analysing the wear and coefficient of friction, PLA performs significantly worse than PA6. The pressure was very low, up to a maximum of 0.1 MPa, and for PLA, the wear ranged from 8 ± 2 to 30 ± 3 µm/km, while for PA, it did not exceed 1 µm/km.
For PLA, the coefficient of friction ranged from 0.62 ± 0.04 to 0.76 ± 0.05 (Figure 7). For PA6, the coefficient of friction ranged from 0.66 ± 0.01 to 1.10 ± 0.10.
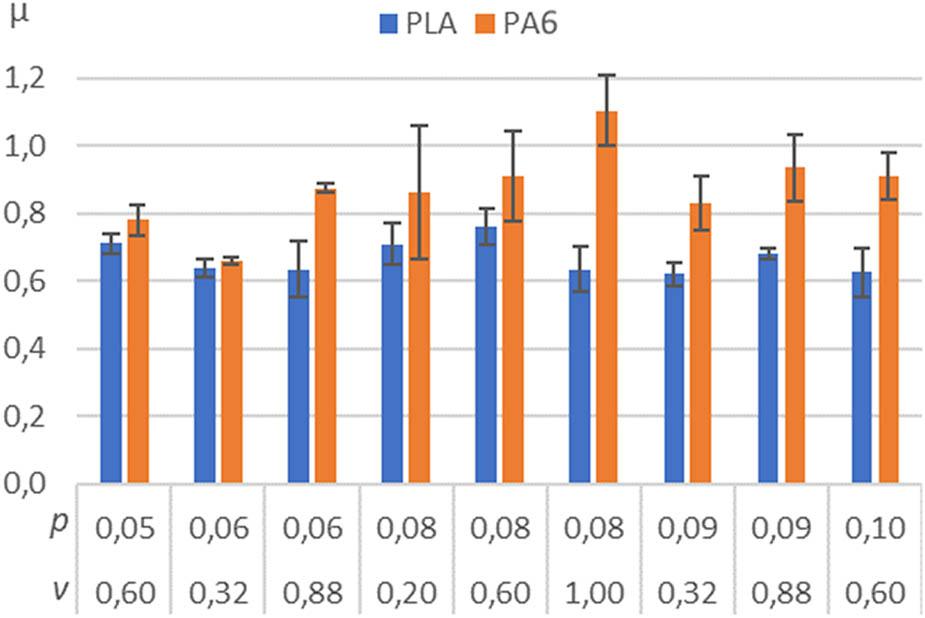
The results of friction coefficient measurements for PLA and PA6.
For PLA, the range in which the coefficient of friction was contained was narrower (its width was 0.14: from 0.62 to 0.76) and for PA6, the range was significantly wider (width 0.44: from 0.66 to 1.1). In case of PA, for most of the cases examined, the coefficient of friction reaches significantly higher values. The coefficient of friction of PA was 20 ÷ 74% higher than for PLA. Only for p = 0.05 MPa and v = 0.6 m/s and p = 0.06 MPa and v = 0.32 m/s, the friction coefficients of PLA and PA6 were similar.
For PA6, the coefficient of static friction (µ 0) ranges from 0.85 to 0.97 (Figure 8), while for PLA, it is lower, ranging from 0.47 to 0.62 (Figure 9). The values of the static friction coefficients are similar or even lower than the values of the kinetic friction coefficients, but at such low pressures, such phenomenon may occur. For both plastics, there was no significant dependence of the static friction coefficient values on the pressure.
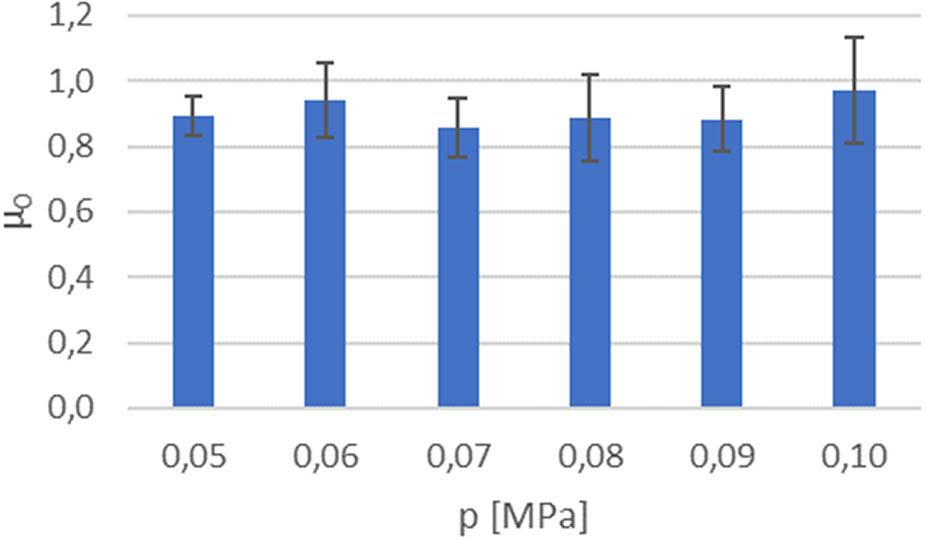
Static friction coefficient values for PA6.
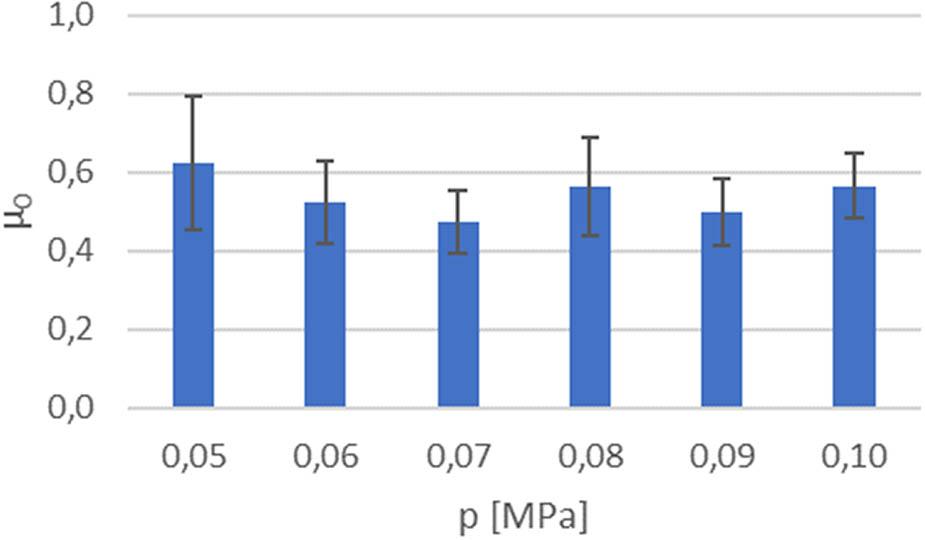
Static friction coefficient for PLA.
Hardness measurements showed a significant difference between the hardness of PA6 and PLA (Figure 10). Measurements taken before friction showed that the hardness of PLA is more than twice that of PA6. The hardness of the PLA specimen after friction is more than three times that of PA6.
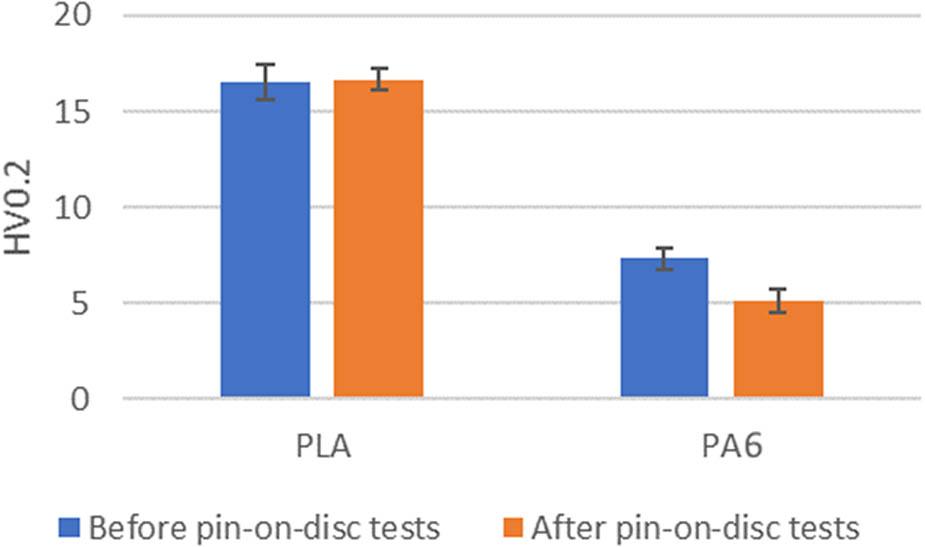
Hardness of PLA and PA6 before and after pin-on-disc test.
For the abrasive wear resistance, a significant difference in the volume of material removed was observed (Figure 11). Approximately 4.3 times more material volume was removed from the PLA specimen than from the PA6 specimen. In addition, the specimen printed from PLA had approximately 18% higher density (1.038 ± 0.016 g/mm3) than the specimen printed from PA6 (0.877 ± 0.031 g/mm3).
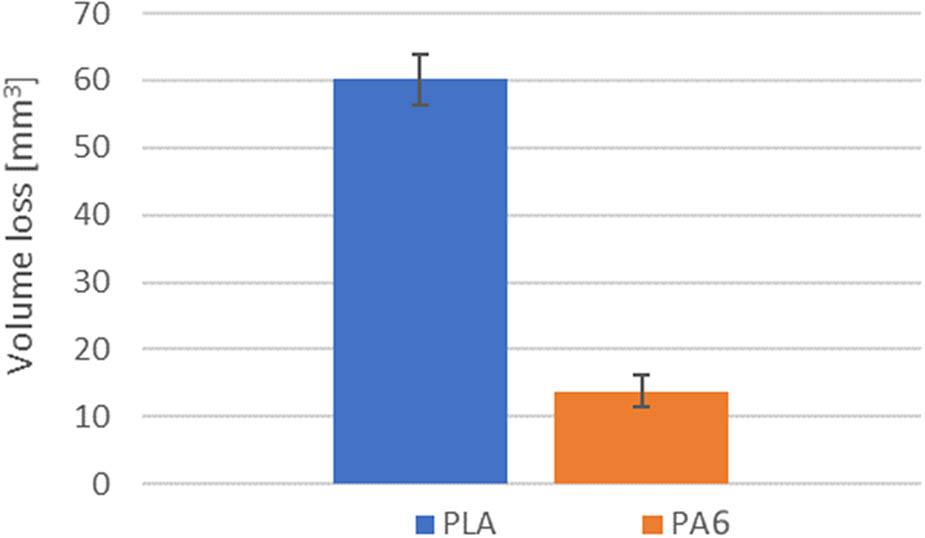
Volume loss obtained during the abrasion resistance testing.
The surface of the samples was examined under a microscope following abrasive wear testing. More electrocorundum grains were observed pressed into the PLA material (Figure 12a). These grains were also more fragmented than those observed in PA6. Scratches were also observed on the PLA surface (Figure 12b). These scratches were oriented parallel to the linear velocity vector of the rubber roller surface.
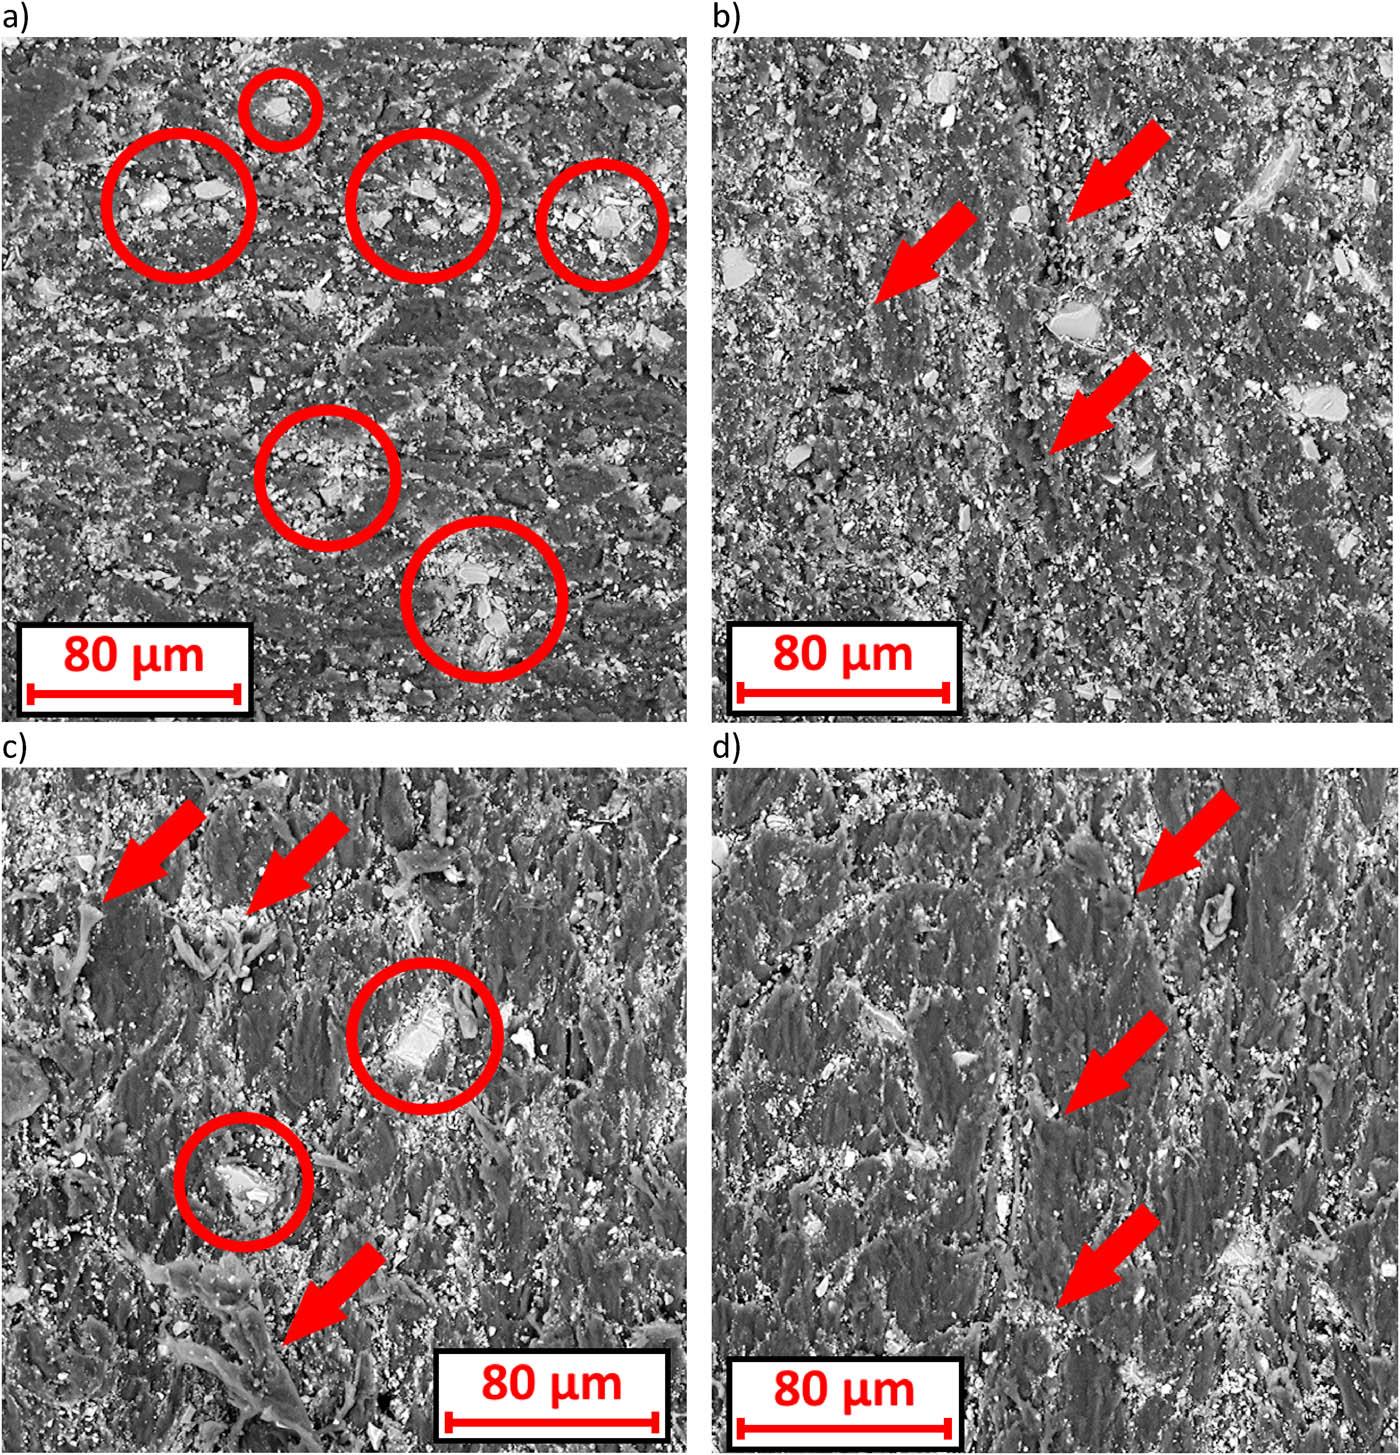
Wear scar at 1,000× magnification: (a) electrocorundum grains pressed into the PLA surface (selected clusters of grains are marked with circles); (b) scratches on the PLA surface (marked with arrows); (c) electrocorundum grains pressed into the PA6 surface (marked with circles) and “shreds” (marked with arrows); and (d) “creases, indentations, waves” on the PA6 surface (marked with arrows).
In the case of PA6, the electrocorundum grains were larger and appeared to be more pressed into the surface of the material. Additionally, something like “shreds” were observed on the surface of PA6 (Figure 12c). Furthermore, “creases, indentations and waves” were observed on the surface of the wear scar (Figure 12d).
In the case of PLA and PA6, wear proceeded in different ways. These materials differed significantly in hardness, as the hardness of PLA was approximately three times higher than that of PA6 (Section 3.6). Hardness is one of the key properties of a material that influences abrasive wear [34]. Probably, it was more difficult to penetrate the surface of the harder PLA. The grains were rolled over the surface of PLA. It appears that, due to the greater hardness of PLA, they dug into the surface after a longer time than in the case of PA6, and thus underwent greater fragmentation. Moreover, it is possible that, in addition to rolling, they were also moved across the surface, creating scratches.
For PA6 with lower hardness, the electrocorundum grains probably penetrated material more easily, which meant that they were less rolled around and less fragmented. Faster penetration meant that the electrocorundum did not scratch the surface of the material.
The lower hardness of PA6 was also manifested in the fact that this material was deformed by the roller, creating “creases, indentations, and waves.” This might cause PA6 to wear less, as the material was largely deformed rather than detached by the roller and electrocorundum. The harder PLA was not as flexible as PA6 to flow under the roller and abrasive, and fragments of the material became detached, causing greater wear than for PA6.
PLA has a lot of advantages. It is similar to PA6 in terms of strength properties, and its hardness is more than twice that of PA6. Renewable materials are used in the production of PLA. PLA is a popular and easily accessible material. Nevertheless, PLA is not an ideal material for an environmentally friendly sliding component. Its effective biodegradation requires high temperatures, thus it would be more accurate to call it compostable material rather than a biodegradable one. Hydrolytic degradation of PLA induced by moisture exposure also appears to be a problem.
Moreover, the tribological properties of PLA are not impressive. Wear and friction coefficient for PLA are high and PLA has poor temperature resistance. The poor temperature resistance is emphasised by comparing the tribological capabilities of PLA to other materials. Wieleba presented a review of friction and wear coefficient for unmodified plastics, in which he included 14 materials [33]. He tested 10 of them at a pressure of p = 3 MPa and a velocity of v = 0.33 m/s. PLA was exposed to cooperation with steel at such parameters, and specimen became deformed by excessive temperature (making further measurement impossible) only after about 10 min of cooperation and covering about 200 m of friction distance. Wieleba tested the other four plastics with lower resistance at p = 0.7 MPa and v = 0.5 m/s. PLA exposed to such parameters achieves significantly higher wear at 195 µm/km (the other plastics have wear up to a few tens of µm/km at most), but no longer shows signs of excessive temperature.
It appears that low temperature resistance would exclude PLA from use in sliding components. However, this is not necessarily the case. First, it should be noted that plastic sliding components usually operate at low velocities and pressures. Significant velocities and pressures are mainly applied under laboratory conditions to test the materials. Second, there is a chance that suitable additives will improve the performance and capabilities of PLA enough to enable its use in sliding components. For example, unmodified PTFE has a wear of 1,600 µm/km, and with the addition of graphite or bronze, wear is reduced to 1 ÷ 2 µm/km [33].
There has already been ongoing work to introduce additives into PLA to improve the tribological properties, since the introduction of additives significantly reduces friction and wear in various materials [35,36,37]. The addition of 10% graphite reduces wear by 65%, but does not change the friction coefficient value [38]. The addition of graphite also allows slightly higher velocities and pressures to be given during work [39]. The addition of 0.025% molybdenum disulphide (MoS2) increased the coefficient of friction by 19% and wear by 184% [40]. Increasing the MoS2 content to 0.5% increased wear by 457%. Adding 0.5% graphene reduced the coefficient of friction by 76% and reduced wear by 52% [41]. Graphite, graphene, and MoS2 are additives that can be categorised as “soft.” When looking for a way to increase the ability of PLA to work at higher velocities and pressures, it is worth investigating PLA blends with other biodegradable polymers. The addition of 40% POM (a non-biodegradable polymer) to PLA significantly affected the tribological properties reducing wear but increasing the coefficient of friction [27]. Perhaps PLA blends will also have a different temperature resistance. Hard (and environmentally safe) fillers such as natural fibres [42] or carbonates [43] can also be introduced into PLA. Hard fillers can also increase PLA’s resistance to abrasive wear.
An opportunity to increase the temperature resistance of PLA can be seen in the annealing process. PLA annealed in 80°C for 30 min increased the heat deflection temperature from 60 to 125°C [44]. However, the glass transition temperature changed little after annealing. Therefore, the authors emphasise that annealing helps in keeping the shape at a higher temperature, yet, this does not change the fact that the material softens significantly already at 60°C. Despite this, it is worth testing whether PLA will be able to work with steel at higher velocities and pressures after annealing. Especially as PLA with additives can also be annealed. It is worth noting that new 3D printing methods are constantly being developed. For example, friction stir additive manufacturing, mainly associated with metals [45,46,47], can also be used to create composites [48,49]. Since annealing improves the properties of PLA, it is possible that friction stir additive manufacturing (in which a lot of heat is applied to the material) could enable the production of a composite and improve the properties of the material in a single process. During further research, it is worth checking which innovative 3D printing methods can be adapted to PLA processing and whether there is a chance that they will improve the properties of this material.
Microscopic observations of the surface of samples after friction indicate differences in the wear processes of PLA and PA6. It appears that the key factor causing the differences in the wear processes is the significantly different hardness of the materials tested.
-
Wear and friction coefficient for PLA are high (wear was 195 µm/km and coefficient of friction was 0.54 when velocity was 0.5 m/s and pressure was 0.7 MPa), and also PLA wore about four times more than PA6 during the abrasive wear test.
-
As a result of its poor temperature resistance, PLA can work with steel at low pressures and velocities. At a velocity of 1.0 m/s, PLA could cooperate with steel at a maximum pressure of 0.3 MPa, while PA6 could do it even at 2.0 MPa (at a pressure almost seven times higher).
-
The biggest challenge for PLA is the low temperature resistance. It is also required to reduce wear and the coefficient of friction. Solving these issues is necessary to use PLA in sliding components.
Author states no funding involved.
The research and article are my own work, so I (Maciej Kujawa) carried out all stages of the research and writing of the article myself.
The author declares that he has no known competing financial interests or personal relationships that could have appeared to influence the work reported in this article.
All data are available within the article.