Figure 1
Figure 2
Figure 3
Figure 4
Figure 5
Figure 6
Figure 7
Figure 8
Figure 9
Figure 10
Figure 11
Figure 12
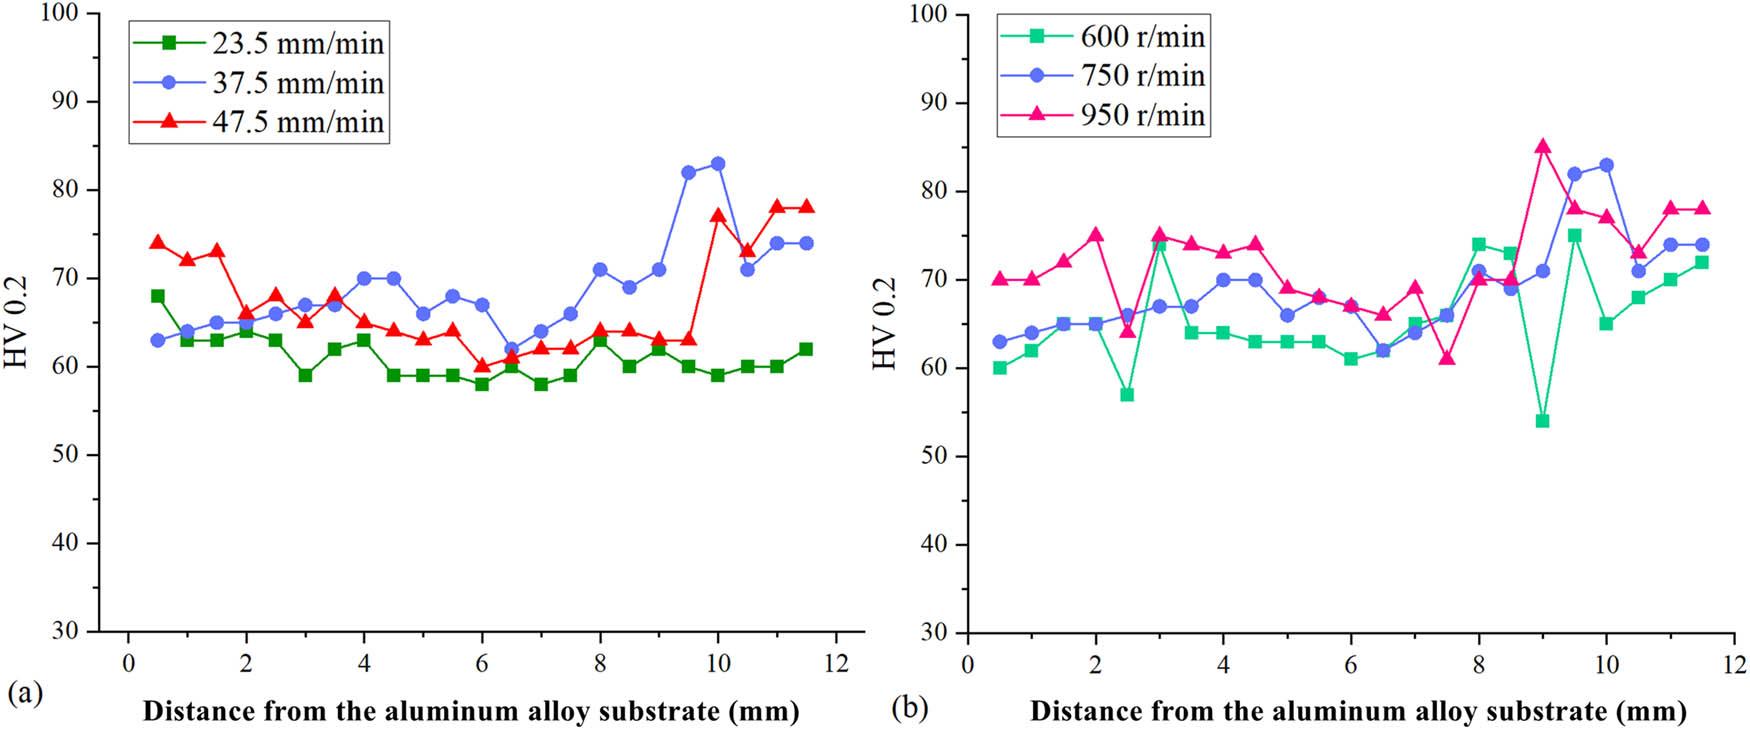
Figure 13
Figure 14
Chemical composition measured by EDS of the 6156 aluminum alloy sheet [23]_
| Chemical element | Si | Fe | Cu | Mn | Mg | Cr | Zn | Al |
|---|---|---|---|---|---|---|---|---|
| wt [%] | 0.7 | 0.084 | 1.04 | 0.43 | 0.82 | <0.05 | 0.15 | Bal |
Standard deviation and average value of hardness at different rotational and traverse speeds_
| Traverse speed (mm/min) | Average value | Standard deviation | Rotational speed (rpm) | Average value | Standard deviation |
|---|---|---|---|---|---|
| 23.5 | 61.00 | 2.35 | 600 | 65.43 | 5.37 |
| 37.5 | 68.91 | 5.26 | 750 | 68.91 | 5.26 |
| 47.5 | 67.26 | 5.58 | 950 | 72.00 | 5.22 |
Process parameters of FSSAM_
| No. | Traverse speed (mm/min) | Rotational speed (rpm) |
|---|---|---|
| 1 | 23.5 | 750 |
| 2 | 37.5 | 750 |
| 3 | 47.5 | 750 |
| 4 | 37.5 | 600 |
| 5 | 37.5 | 750 |
| 6 | 37.5 | 950 |
Plunge depth test of FSSAM_
| No. | Plunge depth (mm) |
|---|---|
| 1 | 2.40 |
| 2 | 2.60 |
| 3 | 2.80 |