Friction stir additive manufacturing (FSAM) is a solid-state metal additive manufacturing (MAM) [1] technology derived from friction stir welding (FSW) [2]. It offers a promising alternative to conventional MAM methods [3]. Traditional MAM techniques face distinct challenges: laser-based approaches such as selective laser melting often introduce metallurgical defects like porosity or unmelted powder due to rapid solidification and high thermal gradients [4]. Electron beam MAM, though performed in vacuum, struggles with material compatibility and high equipment costs [5]. Electric arc MAM produces anisotropic mechanical properties and lower transverse strength from columnar grain growth during solidification [6]. In contrast, FSAM operates via solid-state plastic deformation, avoiding liquid-phase defects. This solid-state nature suppresses anisotropy and enhances transverse strength, making it particularly suitable for light alloys where fine, dense microstructures are critical [7]. These advantages have driven significant research interest in FSAM [8].
Existing FSAM methods based on FSW principles include powder-fed FSAM, depletion-deposited FSAM, and sheet-fed longitudinal FSAM. Powder-fed FSAM, as developed by Calvert [9], injects solid or powder feedstock into a rotating tool shaft, using frictional heat and extrusion to solidify material onto a substrate. While this achieves precise molding and high material utilization, complex tool designs and particle contamination limit its use in high-purity applications. Depletion-deposited FSAM, studied by Dilip and Ram [10], involves frictional plasticization and deposition of material onto substrates or rods. Their work shows strong interfacial bonding and longitudinal tensile properties, but the process is constrained by the tool diameter when fabricating complex geometries [11], restricting scalability [12]. Among these, the longitudinal sheet FSAM technology, similar to friction stir lap welding, has seen the widest application. Researchers have achieved high-quality samples through parameter optimization, but postprocessing steps such as machining remain necessary. This results in substantial machining allowances and low material utilization [13].
To overcome these limitations, friction stir sideways additive manufacturing (FSSAM) emerged as a semi-solid additive technology [14]. Similar to FSW [15], FSSAM integrates extrusion heating, viscoplastic deformation, and forging processes [16]. Notably, this technique converts the axial forging force of conventional FSW into a lateral force [17]. During rotation, lateral compression reduces reliance on rigid fixtures, thereby alleviating clamping challenges [18]. Furthermore, FSSAM enables full-contact machining with large-diameter tools by depositing material onto the substrate’s side surfaces. This design significantly enhances material utilization while promoting the formation of fine-grained forged microstructures. These properties are particularly crucial for additive manufacturing of lightweight alloys like aluminum [19]. Despite these advantages, systematic research on how FSSAM process parameters influence product quality remains insufficient. Zhu et al. [20] found that by modifying process parameters, it is possible to enhance the tensile strength of FSSAM specimens to a level that exceeds that of the original base material. While preliminary multilayer FSSAM experiments validated the process’s feasibility, the effects of key process parameters on surface topography, internal defects [21], and mechanical properties [22] have yet to be fully elucidated.
This study builds upon previous multilayer FSSAM experiments to investigate how process parameters influence surface morphology and internal microstructure. By correlating parameter variations with microstructural evolution, it aims to establish foundational knowledge for optimizing multilayer FSSAM and provide corresponding thermal input models, thereby enhancing its industrial applicability.
In this article, the 6156-t6 aluminum alloy sheet of 200 mm × 100 mm × 3 mm (Harbin East Light Alloy Co., Ltd.) is selected as the substrate, and the 6156-t6 aluminum alloy sheet of 200 mm × 12 mm × 2 mm (Harbin East Light Alloy Co., Ltd.) is selected as the additive sheet, the material with chemical composition shown in Table 1. Before the test, the additive sheet and the substrate surface shall be polished to remove the surface oxide film, and the surface impurities shall be removed with anhydrous ethanol and dried with a blower. To evaluate the chemical composition present in the FSSAM material, an energy-dispersive spectroscopy (EDS) semi-quantitative analysis was used.
Chemical composition measured by EDS of the 6156 aluminum alloy sheet [23].
| Chemical element | Si | Fe | Cu | Mn | Mg | Cr | Zn | Al |
|---|---|---|---|---|---|---|---|---|
| wt [%] | 0.7 | 0.084 | 1.04 | 0.43 | 0.82 | <0.05 | 0.15 | Bal |
The process tests were carried out on a modified FSSAM machine based on the BYJ-X53K general vertical milling machine, as shown in Figure 1. The additive manufacturing tool is made of W18Cr4V steel and hardened to 48 HRC. In general, there are three main process parameters affecting the FSSAM, which are the plunge depth of the additive manufacturing tool, the traverse speed, and the rotational speed, as shown in Figure 2. In the plunge depth influence experiment, the additive manufacturing tool’s traverse speed was 37.5 mm/min, and its rotational speed was 750 rpm. In the process parameter influence experiment, a plunge depth of 2.60 mm was used.
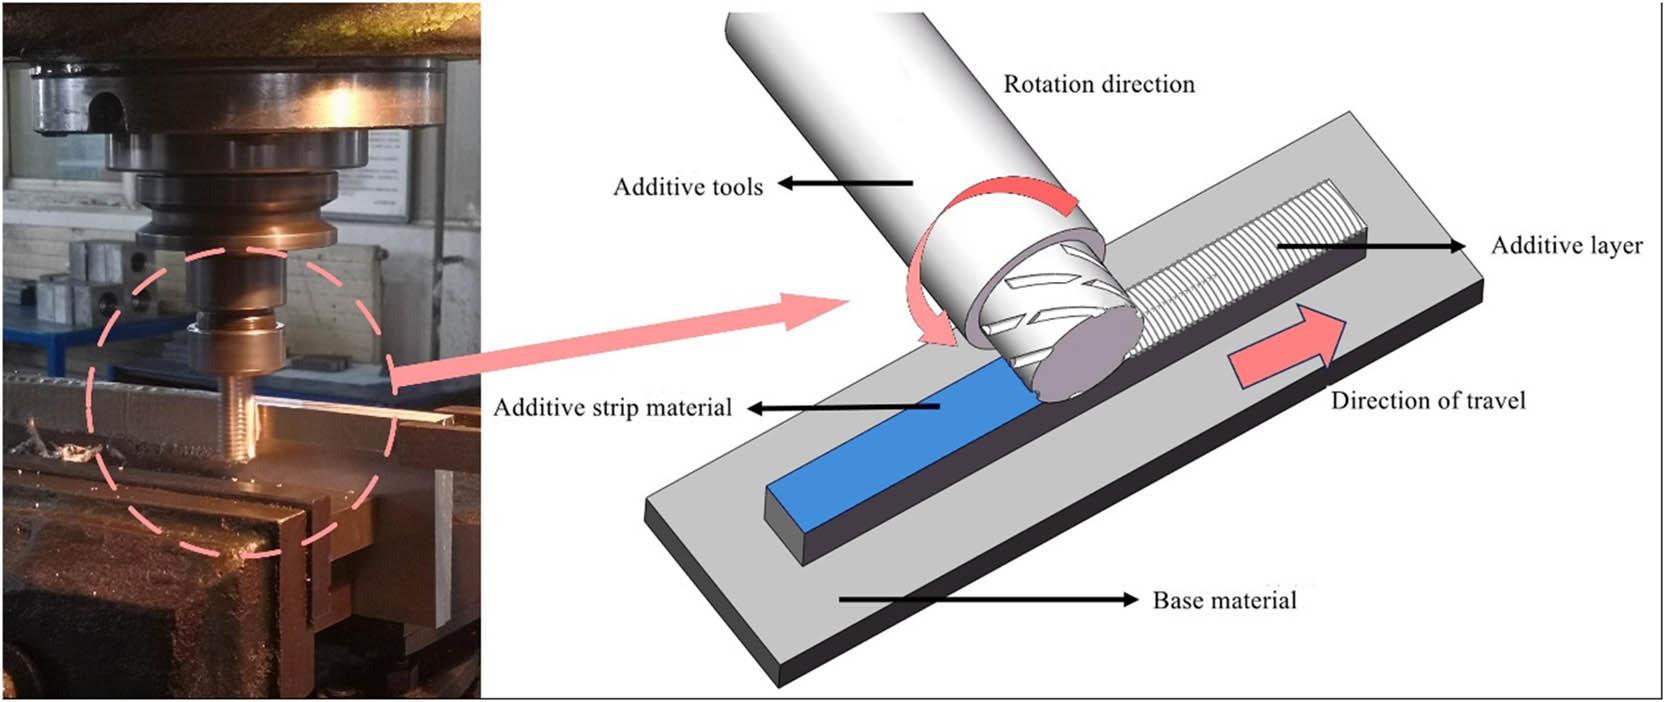
Schematic diagram of FSSAM process.
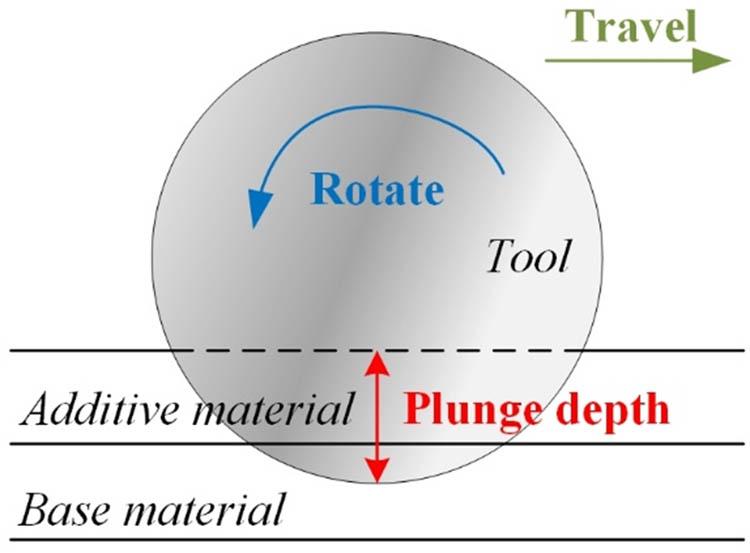
Process parameters for FSSAM additive tools.
First, the effect of plunge depth on additive manufacturing was tested, and the test parameters are presented in Table 2. After determining the FSSAM tool’s plunge depth, the experimental design was carried out using the orthogonal test method, and the process parameters used are shown in Table 3. During the additive manufacturing process, the additive manufacturing tool was rotated counterclockwise. To achieve an additive height exceeding 15 mm for FSSAM specimens, the additive manufacturing strips were stacked in 10 layers. Before the additive manufacturing test, the surfaces of the substrate and additive manufacturing strips were polished with sandpaper to remove the oxide film and then cleaned with anhydrous ethanol and blown dry. After additive manufacturing, the metallographic samples were cut perpendicular to the 300 mm × 15 mm plane of the FSSAM additive zone, metallographically etched using Keller’s reagent, and photographed using a Nikon D70 camera for surface and internal morphology. The fracture morphology was observed under a Tescan-VEGA3 scanning electron microscope (SEM) to determine the nature of the fracture in different zones of the FSSAM. The microhardness of the internal surface of the metallographic samples in the additive manufacturing zone was measured at the centerline using a HVS-1000Z digital microhardness tester. The hardness test load was 2 N, and the holding time was 20 s. The hardness test specimens are cut perpendicular to the aluminum alloy substrate. The test point is a single line along the height of the sample. The tensile properties of FSSAM samples were tested using the CMT-5105 microcomputer-controlled electronic universal testing machine. The specimen extraction location for tensile testing is shown in Figure 3. The entire stir friction additive manufacturing process was monitored and recorded for temperature measurements using a Fluke Ti480 PRO Infrared Camera.
Plunge depth test of FSSAM.
| No. | Plunge depth (mm) |
|---|---|
| 1 | 2.40 |
| 2 | 2.60 |
| 3 | 2.80 |
Process parameters of FSSAM.
| No. | Traverse speed (mm/min) | Rotational speed (rpm) |
|---|---|---|
| 1 | 23.5 | 750 |
| 2 | 37.5 | 750 |
| 3 | 47.5 | 750 |
| 4 | 37.5 | 600 |
| 5 | 37.5 | 750 |
| 6 | 37.5 | 950 |
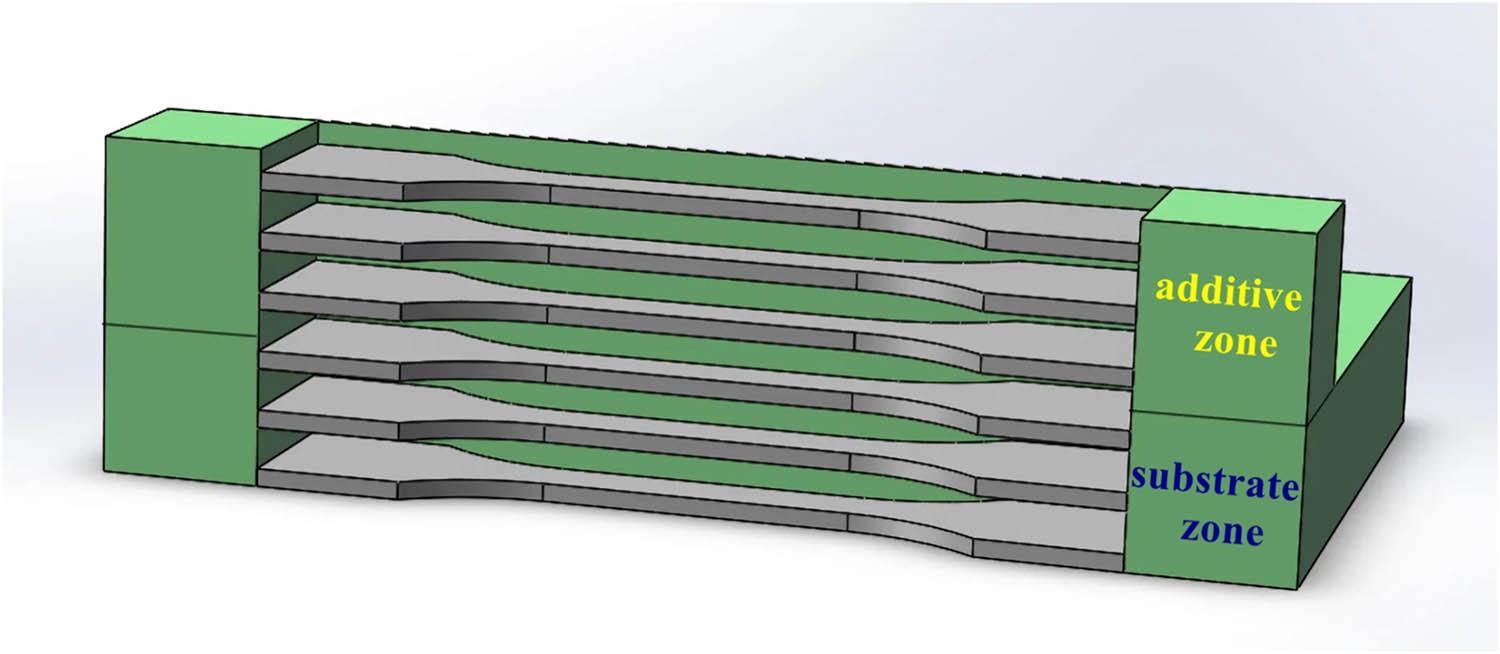
Extraction location for tensile testing specimens.
Figure 4 shows a sample metal inlay of FSSAM, which shows the internal microstructure of the material before and after the addition process. Figure 4(a) shows the microstructure of the original substrate, which presents coarse flaky grains along the rolling direction and diffusely distributed second-phase particles, some precipitated along grain boundaries and some appearing inside the grain. Figure 4(b) shows the microstructure of the substrate zone after the additive process, and the substrate zone is affected by the heat input in the additive process, compared with the original substrate grains that have a certain degree of growth, but the grain morphology and orientation remain unchanged. Figure 4(c) shows the microstructure of the original additive strip, and the grains show a mixture of lath and equiaxial crystals. Figure 4(d) shows the microstructure of the additive zone, the strong mixing, and intense extrusion and friction, and this region of the material tissue undergoes dynamic recrystallization, forming a fine grain structure. Figure 4(e) shows the microstructure near the bonding zone due to the combined effects of the thermal cycle of the additive and the mechanical stirring of the additive tool. The size of the grains in the bonding zone is significantly reduced compared to the size of the substrate zone. Similarly, the grain size in the additive zone is smaller than that in the bonding zone, as shown in Figure 4(f). The stirring effect of the additive zone is relatively weaker than that of the bonding zone, and the size of the grains in the bonding zone is greater than that of the additive zone. The grain size in the additive zone and the bonding zone is significantly smaller than that in the additive strip and the original substrate, so the FSSAM has an obvious effect on the grain size.
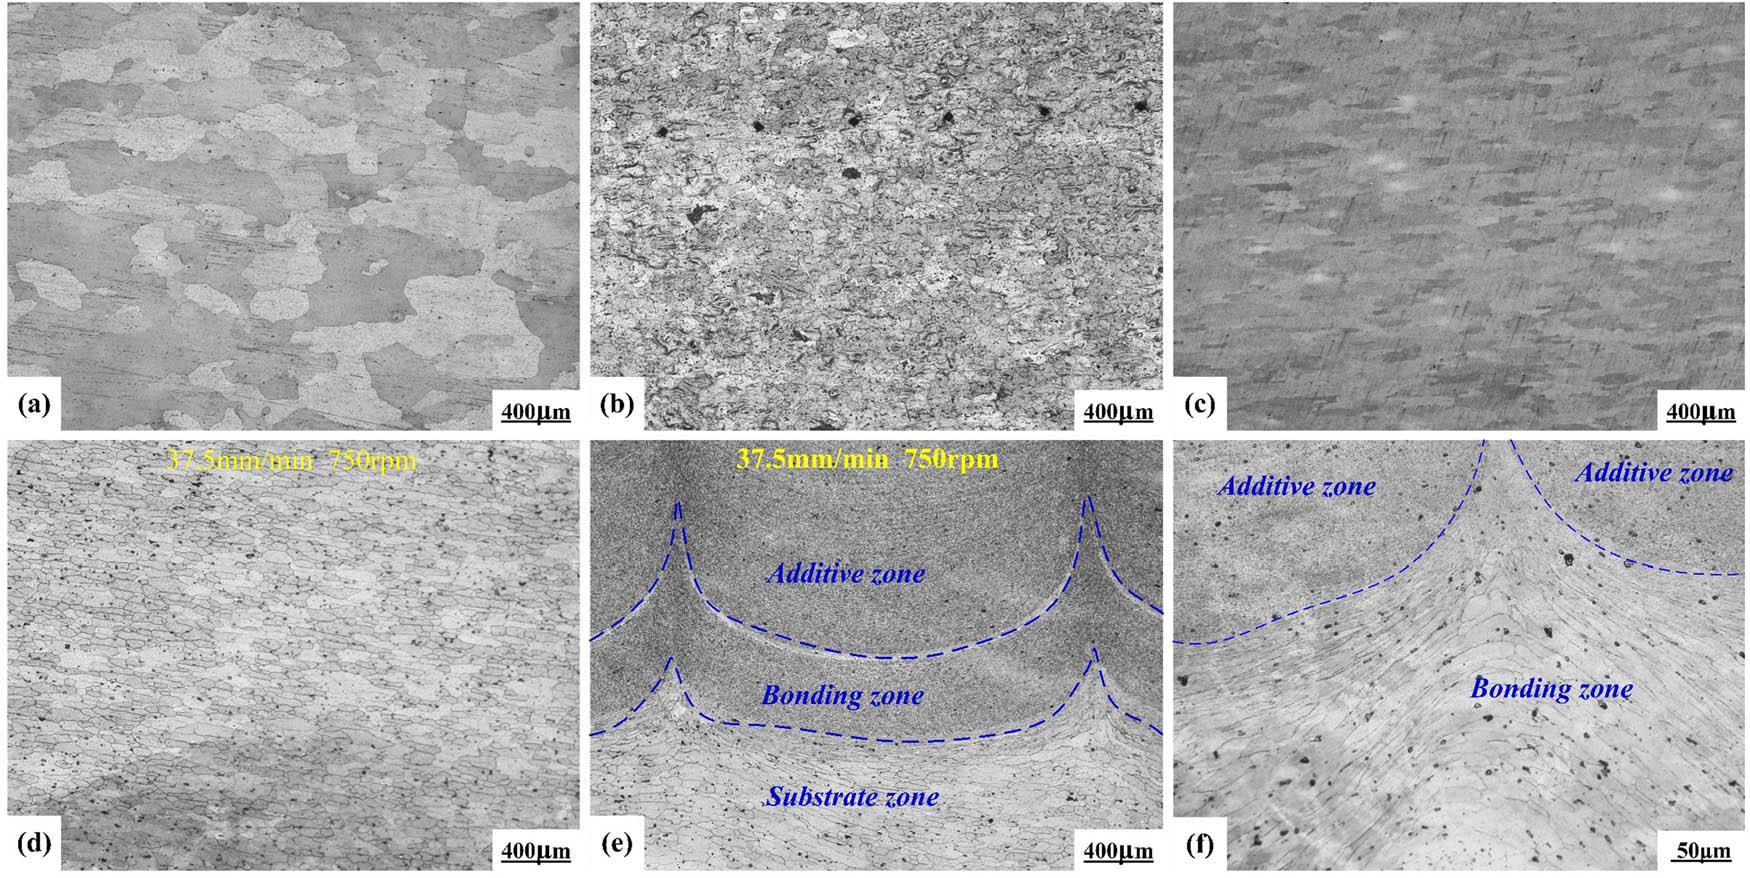
Photomicrographs of FSSAM samples before and after additive manufacturing. (a) Original substrate plate, (b) substrate zone, (c) original additive material sheet, (d) additive zone at 37.5 mm/min and 750 rpm, (e) bonding zone at 37.5 mm/min and 750 rpm, and (f) differences in grain size across different zones.
Figure 5 shows that there are hooks in the additive manufacturing region under different parameters, which is closely related to the plastic flow in the vertical direction of the material. The additive region reaches a plastic state under the influence of heat input, and plastic flow is carried out under the stirring and squeezing effect of the additive manufacturing tool. It can be divided into horizontal and vertical plastic flow according to the different flow directions. The horizontal plastic flow is the flow of the material in the direction parallel to the traveling additive velocity, which can ensure the dense bonding of the substrate and additive strips. The vertical plastic flow is the plastic flow of the material in the direction perpendicular to the additive velocity. Vertical plastic flow is the flow of material in the direction perpendicular to the additive velocity, which can make the arches well bonded together and further reduce the gap between the arches.
Microstructure of the cross section of the additive zone under different tool plunge depths: (a) 2.40 mm, (b) 2.60 mm, and (c) 2.80 mm.
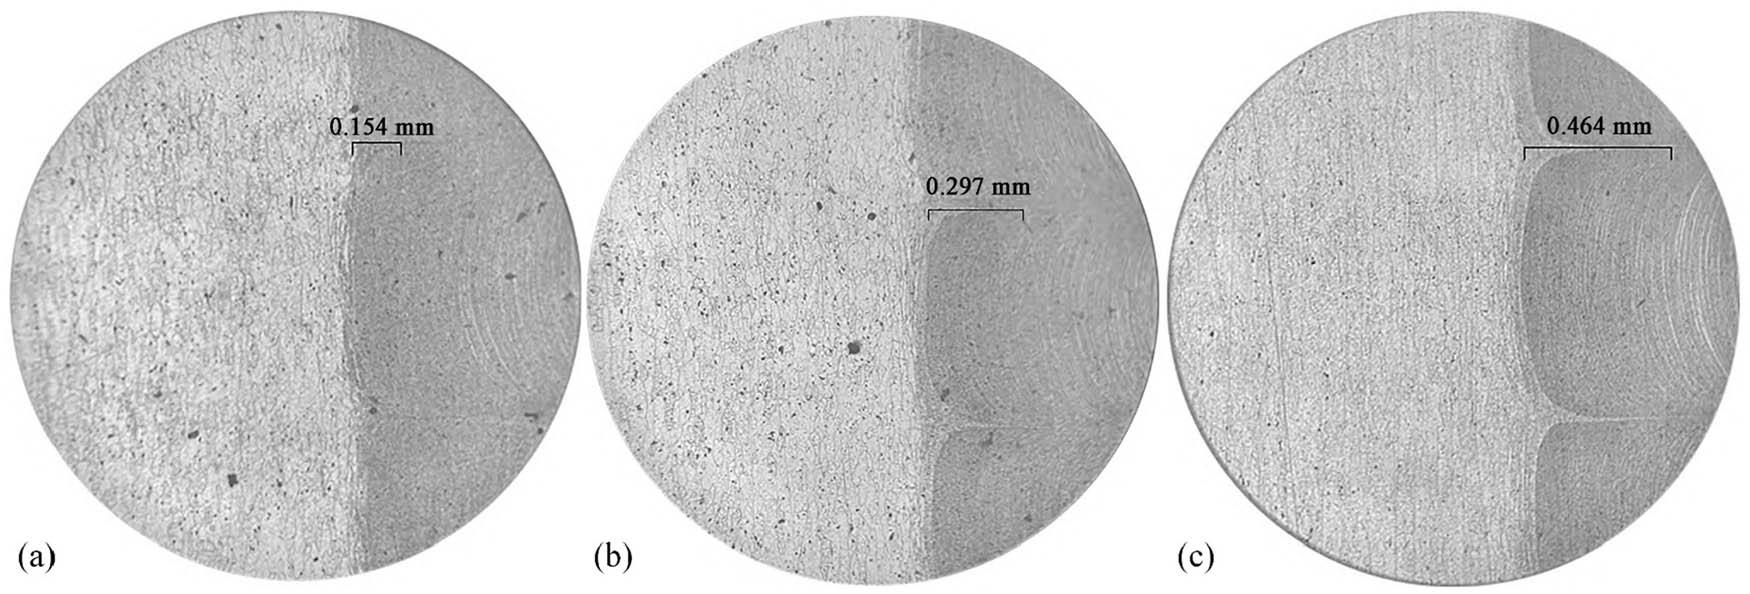
Figure 6 shows macroscopic images of the cross section of the additive samples at different additive tool plunge depths. When the plunge depth of the additive tool is 2.40 mm, large unconnected zones appear in the additive zone, as shown in Figure 6(a). As the plunge depth of the additive tool increases, the unconnected zone of the additive region disappears, as shown in Figure 6(b) and (c). Among them, the difference between the cross-sectional macroscopic morphology of the samples with a plunge depth of 2.60 mm and that of the 2.80 mm additive samples lies in the distribution of the bonding zone. The characteristic morphology of the bonding zone of the additive sample with a plunge depth of 2.60 mm is less obvious in the majority of the additive zone. The characteristic morphology of the bonding zone of the additive sample with a plunge depth of 2.80 mm is more obvious in the additive zone. The two distinct bonding zones shown in Figure 5b are not seen in Figure 5c, and the bonding zones outside these two lines in Figure 5b are not as pronounced as those in Figure 5c. This occurs because when the additive manufacturing tool is inserted into a plunge depth of 2.80 mm, the increased heat input softens the aluminum alloy and reduces vibration during the additive process. When the plunge depth of the additive manufacturing tool is 2.60 mm, although the bonding zones between additive zones become less pronounced, more distinct bonding zones may appear due to vibration effects.
Interface morphology of the additive zone with different tool plunge depths: (a) 2.40 mm, (b) 2.60 mm, and (c) 2.80 mm.
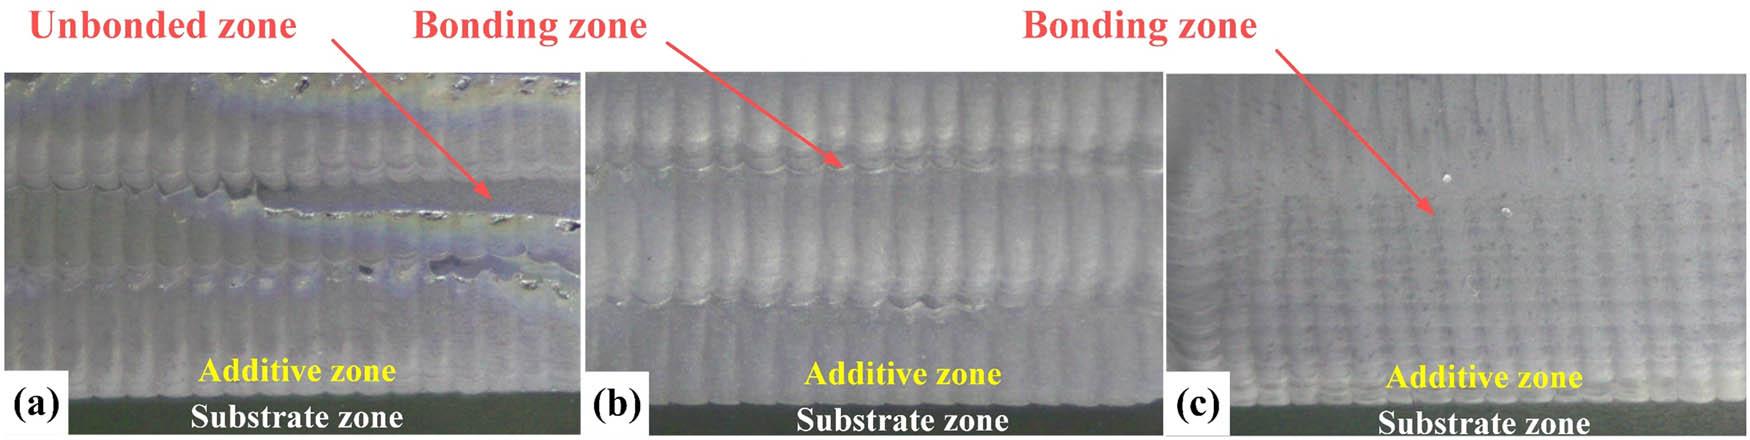
Figure 7 shows the surface morphology of the additive manufacturing tool at 750 rpm, plunge depth of 2.60 mm, and traverse speeds of 23.5, 37.5, and 47.5 mm/min, respectively. It can be seen that when the additive manufacturing speed is faster, a serious fin phenomenon occurs. When the speed is slower, serious ripple phenomenon occurs. The appearance of a fin and ripple will affect the surface flatness of the additive manufacturing. For the fin phenomenon, it can be seen that it becomes more serious with the increase of the additive manufacturing speed, which is due to the increase of the additive manufacturing speed makes the stirring tool and the additive zone contact time is shorter and the heat production is reduced, the heat input is insufficient resulting in the lower degree of softening of the material, and the surface of the additive surface fin under the stirring and squeezing effect of the additive tool. Ripples mainly appear on the surface of the additive manufacturing at a slower speed, which is manifested as a discontinuity in the flatness of the additive surface. The material in the additive zone reaches a state of plastic softening under the extrusion and friction of the additive tool, and in the additive tool mixing plastic flow, by the additive tool rear blade surface and the teeth on the waveform edge of the grinding combined with the surface of the substrate to complete the additive. Due to the slow traverse speed, the additive tool stays in the same place for too long, so that has been crushed to the surface of the substrate to complete the additive material is the second time for the material to be additive, thus forming a corrugated surface. Therefore, the ripple phenomenon can be reduced by increasing the additive manufacturing speed, and the fin phenomenon can be reduced by increasing the heat input.
Surface morphology of the additive zone with different traverse speeds: (a) 23.5 mm/min, (b) 37.5 mm/min, and (c) 47.5 mm/min.
Because both the rotational speed and traverse speed of the additive tool have a similar effect on the surface of the additive manufacturing zone by affecting the heat input, the surface of the additive zone will not be investigated in subsequent studies.
Figure 8 shows that the tensile properties of the FSSAM additive zone at different rotating and traverse speeds of the FSSAM tool. The tensile strength of the FSSAM samples becomes larger with the increase of the rotational speed. When the rotational speed reaches 750 rpm. The effect of continuing to increase the rotational speed on the tensile strength and elongation is smaller and basically stabilized at about 274 MPa. Increasing the traverse speed of the FSSAM tool results in an initial increase and subsequent decrease in the tensile properties of the specimen, reaching a maximum value of 273.62 MPa at 37.5 mm/min. It is noteworthy that at a traverse speed of 23.5 mm/min, the tensile strength of the samples decreases, but the elongation is abnormally high, reaching 12.7%.
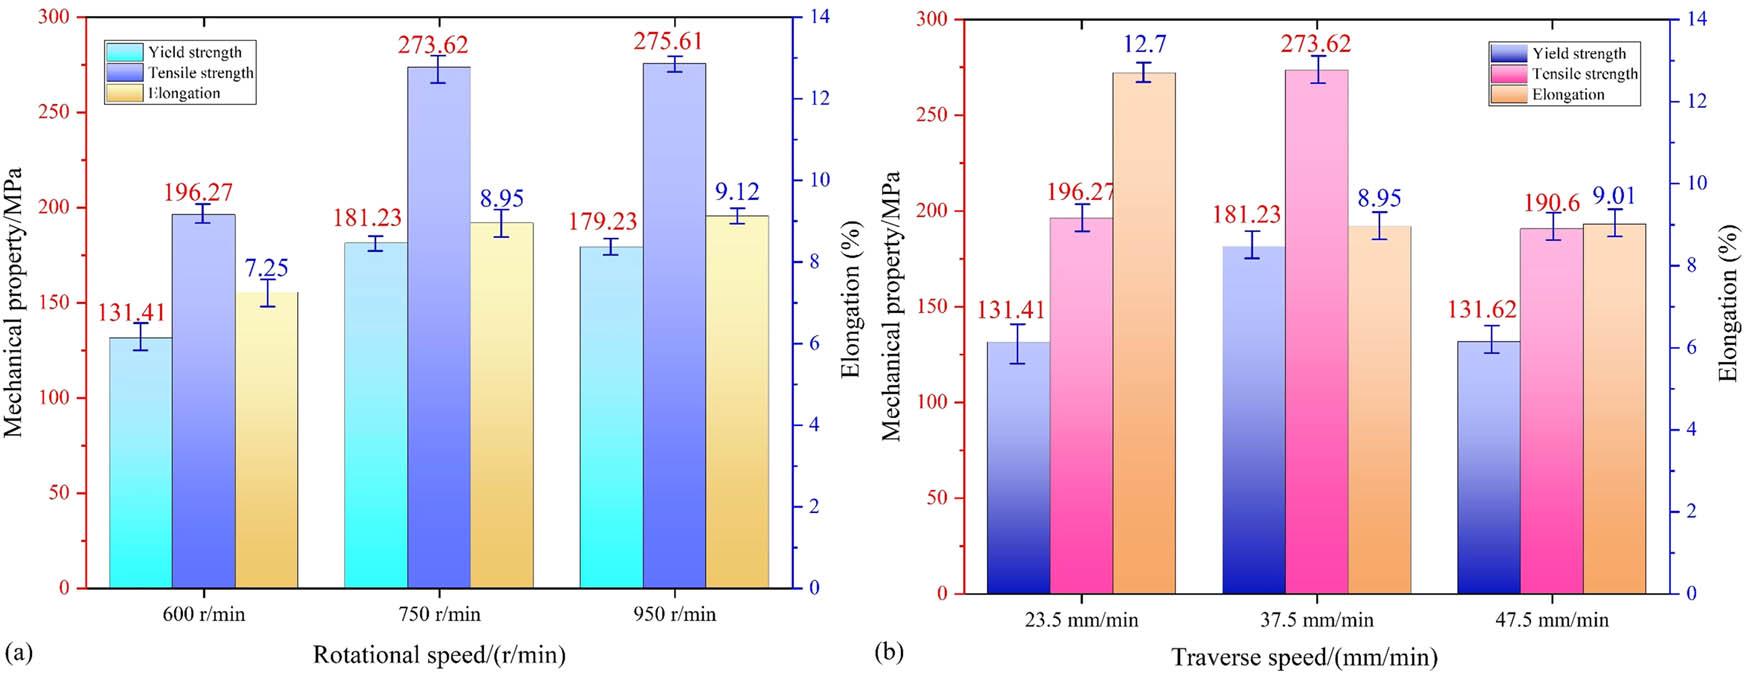
Tensile properties of FSSAM at different rotational speeds. (a) Rotational speeds and (b) traverse speeds.
Figure 9 demonstrates the influence of process parameters on the cross section of additive samples by varying the tool rotational speed and traverse speed. The tool plunge depth is 2.80 mm, and Figure 1(a) shows the additive manufacturing specimen produced at a tool traverse speed of 47.5 mm/min. Due to the tool’s high traverse speed, significant vibration occurs between the tool and workpiece during the additive manufacturing process. This resulted in the presence of unwelded zones within the FSSAM specimen. Figure 1(b) demonstrates the additive manufacturing specimen produced at a traverse speed of 23.5 mm/min. Lower traverse speed results in higher heat input, causing excessive softening of the aluminum alloy. The softened alloy accumulates beneath the additive tool due to surface texture, leading to a reduction in additive height. The additive manufacturing specimen was produced at a tool rotational speed of 600 rpm, as shown in Figure 1(c). Figure 1(d) illustrates the additive manufacturing specimen produced at a rotational speed of 1,000 rpm. The thermal input generated by the rotational speed selected for the experiments was sufficient to bring the aluminum alloy to its plastic flow temperature. Therefore, variations in rotational speed had little effect on the macroscopic forming of the specimens.
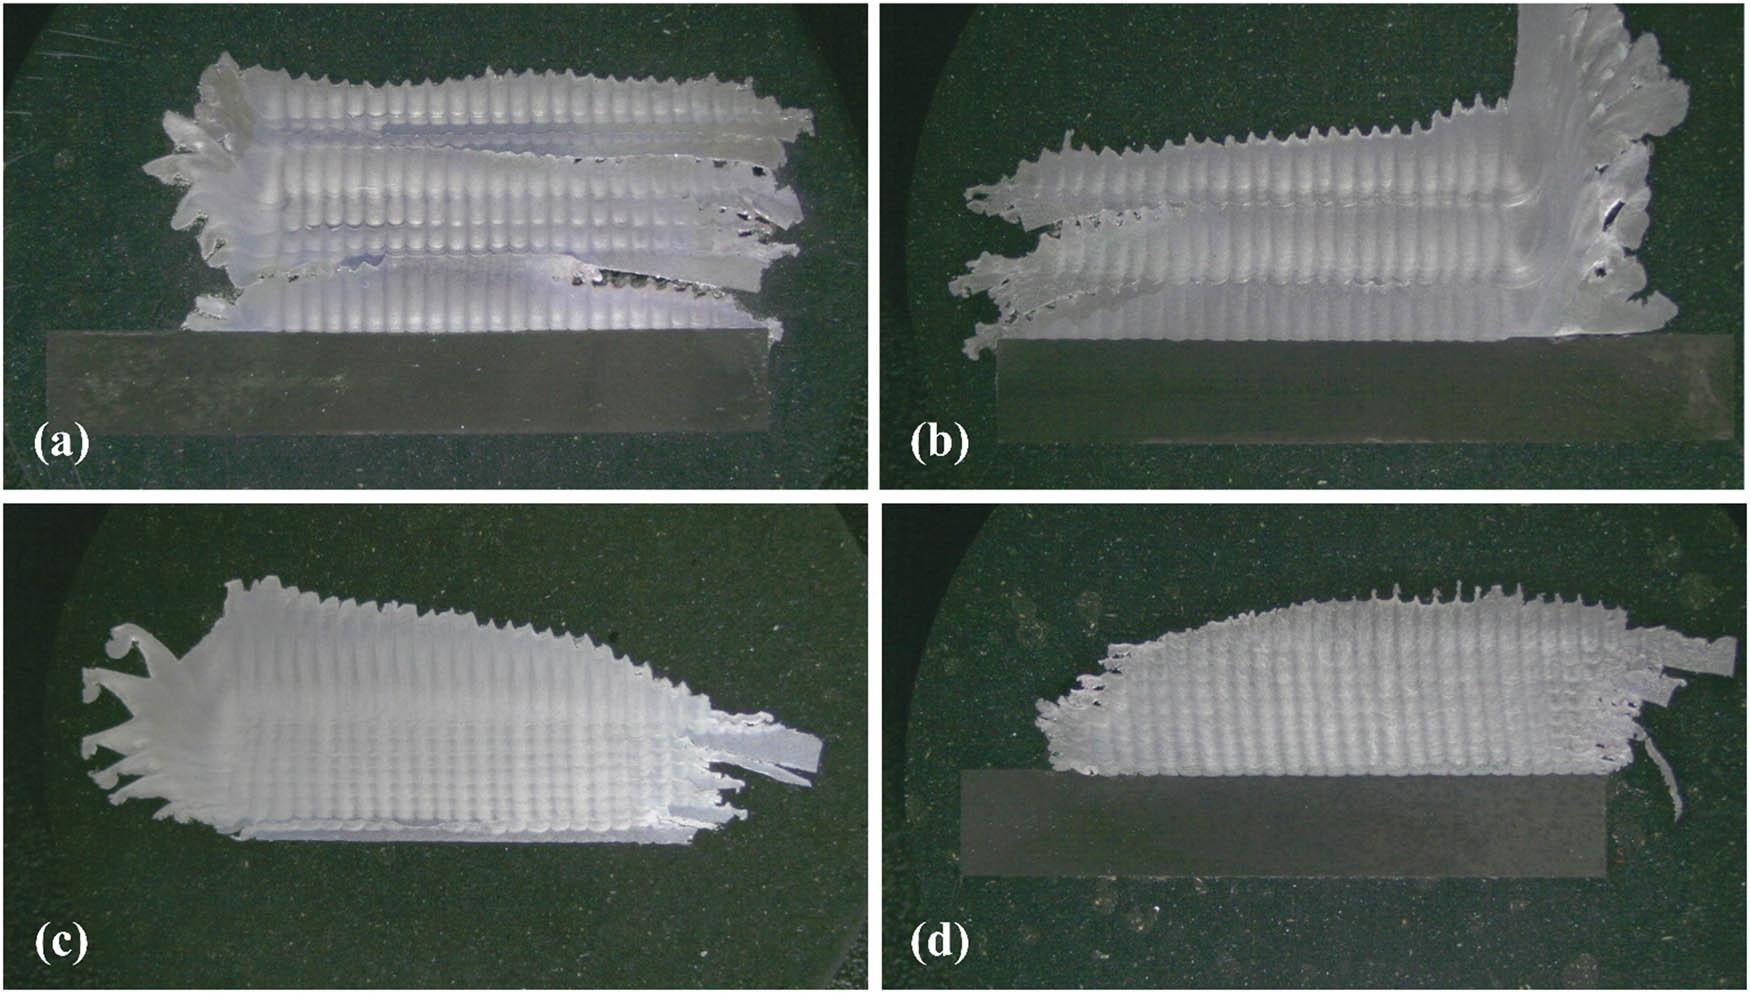
Surface morphology of the additive zone with different traverse speeds. (a) 47.5 mm/min, (b) 23.5 mm/min and rotational speeds, (c) 600 rpm, and (d) 1,000 rpm.
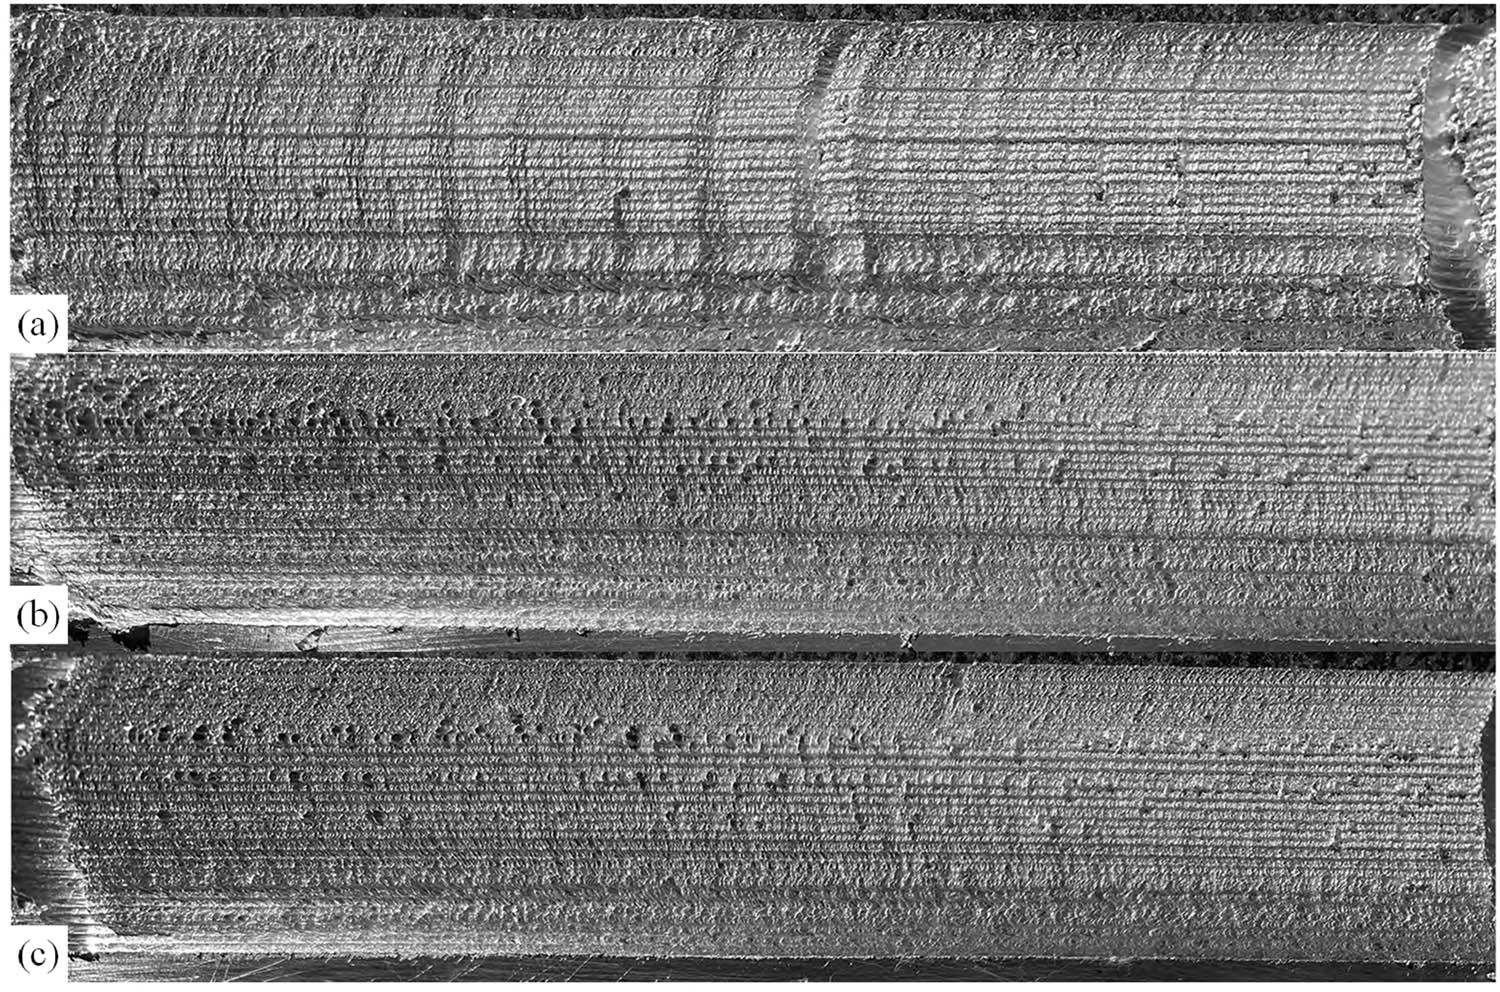
Figure 10 shows the microstructural images taken by SEM at the fracture of the tensile parts in the additive zone of the FSSAM additive manufacturing prototype under different process parameters.
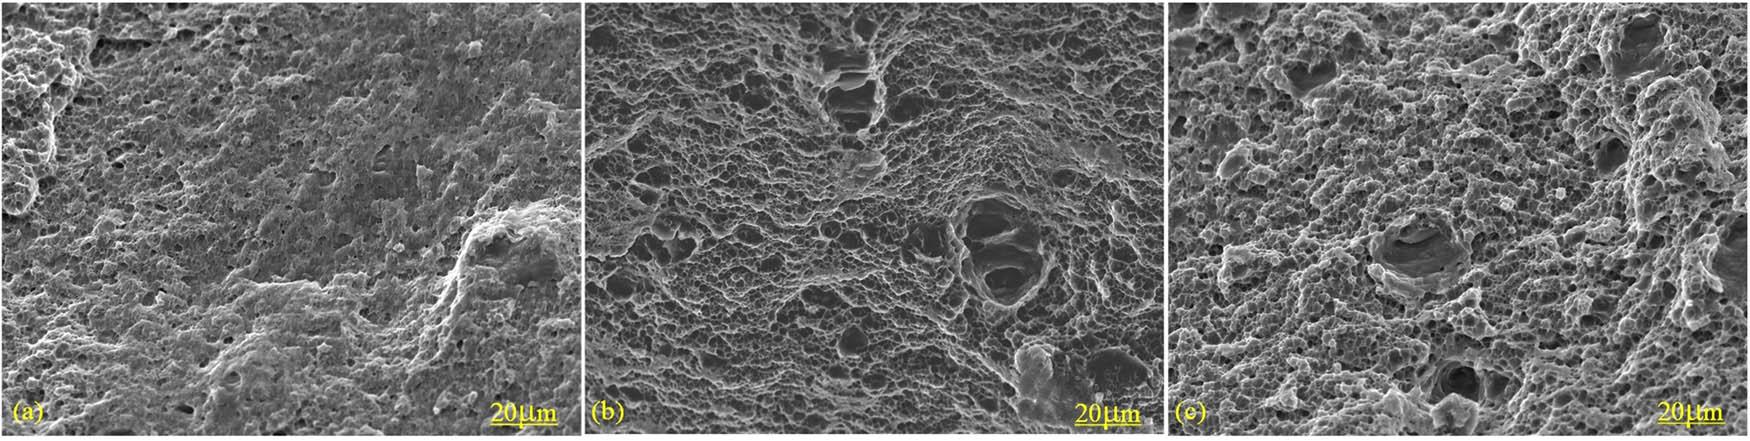
Microstructure of the additive zone with different traverse speeds. (a) 47.5 mm/min, (b) 37.5 mm/min, and (c) 23.5 mm/min.
As shown in Figure 10, different additive manufacturing tool movement speeds affect the bonding of aluminum alloys in the additive zone. By observing the microscopic morphology of the FSSAM tensile fracture, it can be found that at higher rapid prototyping tool traverse speeds, the tensile fracture at the fracture interface fails to form a microvoid accumulation fracture due to insufficient heat input, and the tensile fracture surface is not smooth enough. When the moving speed is reduced to 37.5 mm/min, as shown in Figure 10(b) and (c), the microvoid accumulation fracture structure covering the entire tensile fracture interface will appear, which indicates that the tensile properties of these two groups of samples are better.
SEM of the effect of different additive manufacturing tool rotational speeds on the fracture interface is shown in Figure 11. As shown in Figure 11(a), when the rotational speed of the additive manufacturing tool is low, it is difficult to find the microvoid accumulation fracture structure at the fracture interface, and the fracture surface is not flat due to the severe lack of heat input. When the rotational speed of the additive manufacturing tool was increased to 750 rpm, the whole interface showed a standard microvoid accumulation fracture structure, and the microvoid became further enlarged and deepened when 950 rpm was reached, as shown in Figure 11(b) and (c).
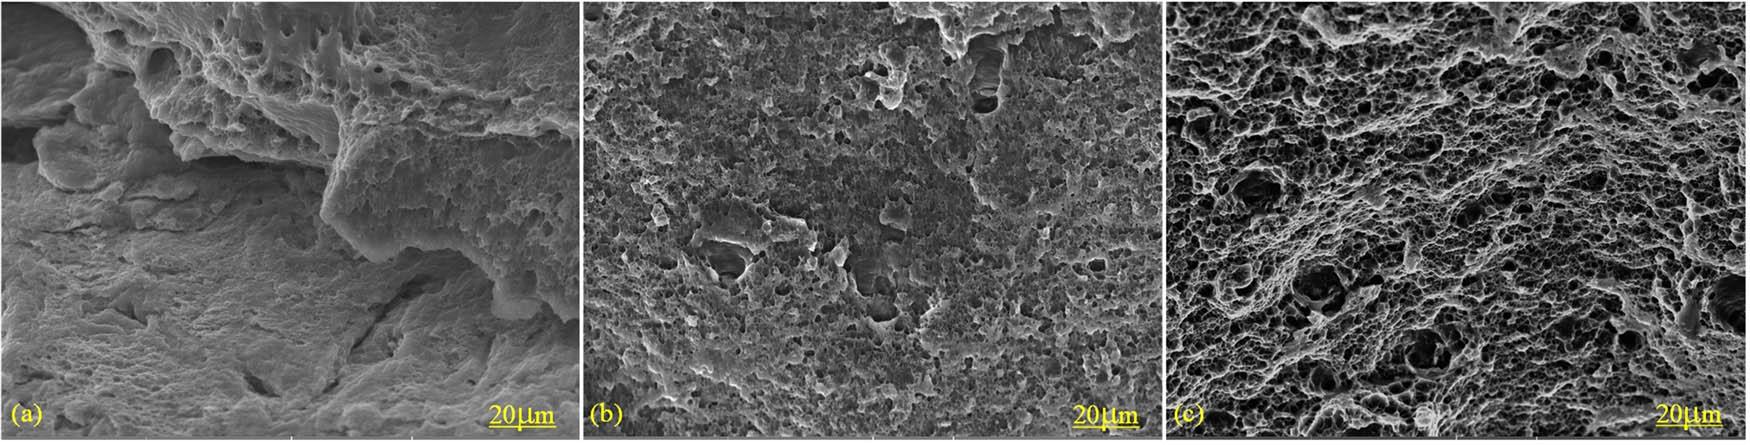
Microstructure of the additive zone with different rotational speeds: (a) 600 rpm, (b) 750 rpm, and (c) 950 rpm.
Figure 12 shows the hardness (HV 0.2) of the FSSAM additive zone at different rotating and traverse speeds of the additive tool, where the horizontal coordinates of Figure 11 are the numbers of the hardness marking points at different locations on the sample. The number indicates the distance from the metal substrate. Standard deviation and average value of hardness at different rotational and traverse speeds are presented in Table 4. The effect of the traverse speed of the additive manufacturing tool on the hardness of the sample is shown in Figure 12(a). In the case of the curve for a traverse speed of 23.5 mm/min, its profile is more stable with smaller deviations from the mean than in the case of 37.5 and 47.5 mm/min. The effect of the traverse speed of the additive manufacturing tool on the hardness of the sample is shown in Figure 12(b). In the case of the curve for a rotational speed of 950 rpm, its profile is more stable with smaller standard deviations from the average than in the case of 750 and 600 rpm. The standard deviation of the test specimens is found to be significantly smaller than the average hardness value, indicating that the data are reliable.
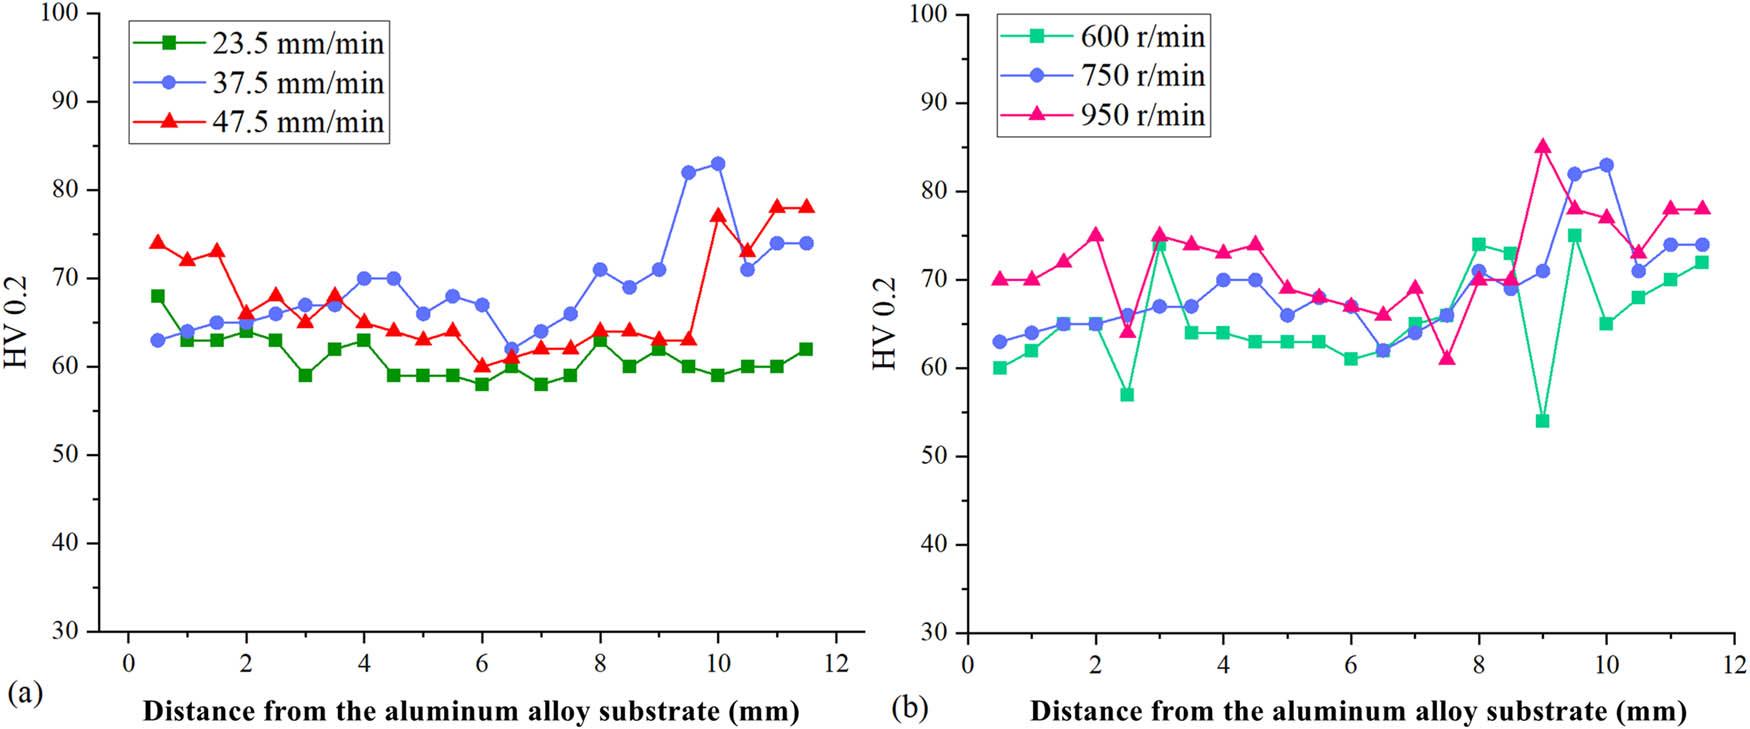
Hardness (HV 0.2) of FSSAM at different rotational and traverse speeds. (a) Different tool’s traverse speed and (b) different tool’s rotational speed.
Standard deviation and average value of hardness at different rotational and traverse speeds.
| Traverse speed (mm/min) | Average value | Standard deviation | Rotational speed (rpm) | Average value | Standard deviation |
|---|---|---|---|---|---|
| 23.5 | 61.00 | 2.35 | 600 | 65.43 | 5.37 |
| 37.5 | 68.91 | 5.26 | 750 | 68.91 | 5.26 |
| 47.5 | 67.26 | 5.58 | 950 | 72.00 | 5.22 |
Based on the combined results of tensile and hardness tests, the specimen exhibited optimal mechanical properties when the FSSAM tool is operated at a rotational speed of 950 rpm and a traverse speed of 37.5 mm/min.
Equation (1) represents the heat input equation for shoulderless FSW [24,25]:
Based on this equation, the heat input equation for this experiment can be derived. In the absence of a shoulder, the FSW is only subjected to the action of the stirring needle, so it is subjected to the heat input as shown in equation (2):
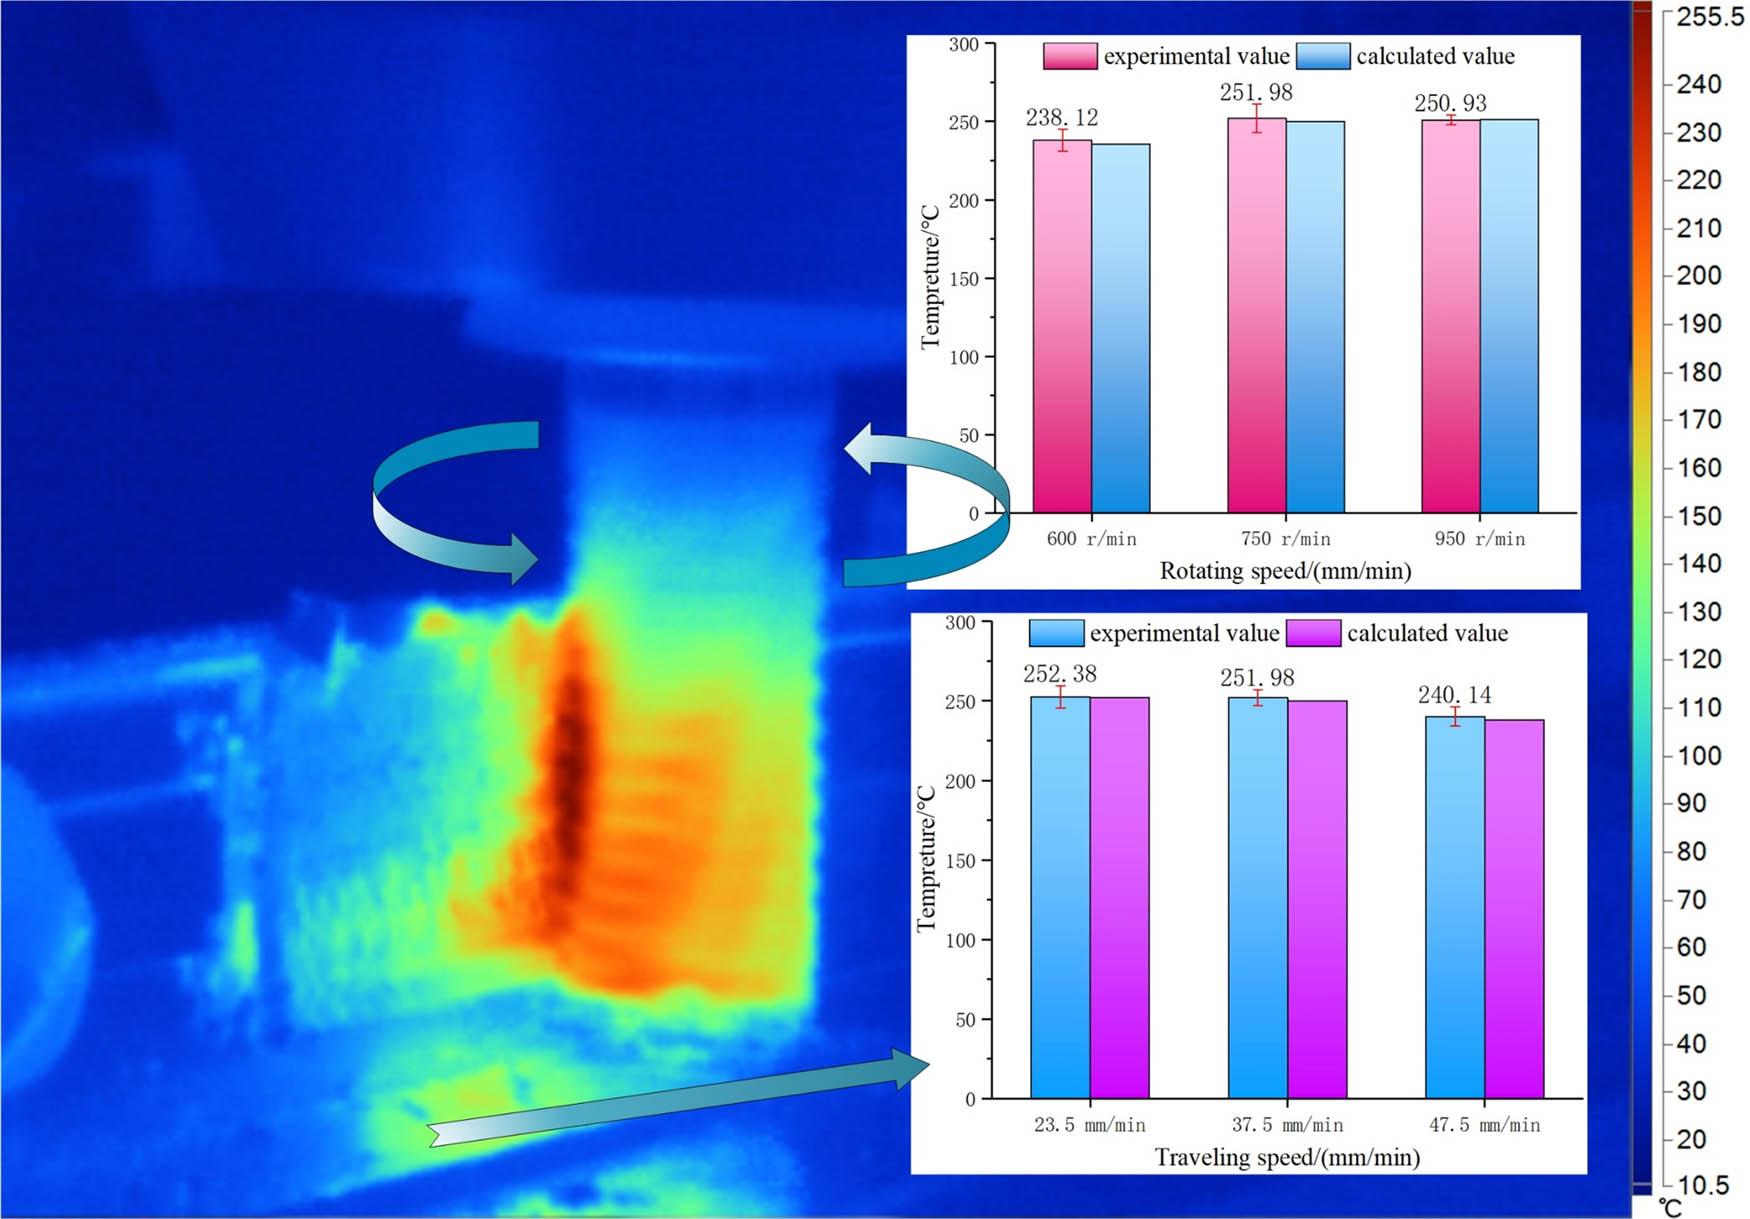
Analogous to the shaftless shoulder FSW, the contact zone between the additive tool (FSW stirring needle) and the metal in the heat input of FSSAM additive manufacturing is not 360°, but it is at a certain contact angle θ (as shown in Figure 11). Therefore, the heat input of FSSAM is deduced as shown in equation (3):
Carried over to the tests in this study, the calculated results and trends are in better agreement with the measured data, as shown in Figure 13, indicating that equation (3), a heat input formula, is more reasonable.
Schematic temperature diagram of the FSSAM additive manufacturing zone at different additive manufacturing stages.
Through the analysis of the single-point temperature measurement test data in the additive zone during the additive manufacturing process, it can be found that from a macroscopic point of view, the heat input process of FSSAM is divided into the following five phases. The characteristic points and temperature trends of each stage are shown in Figure 14.
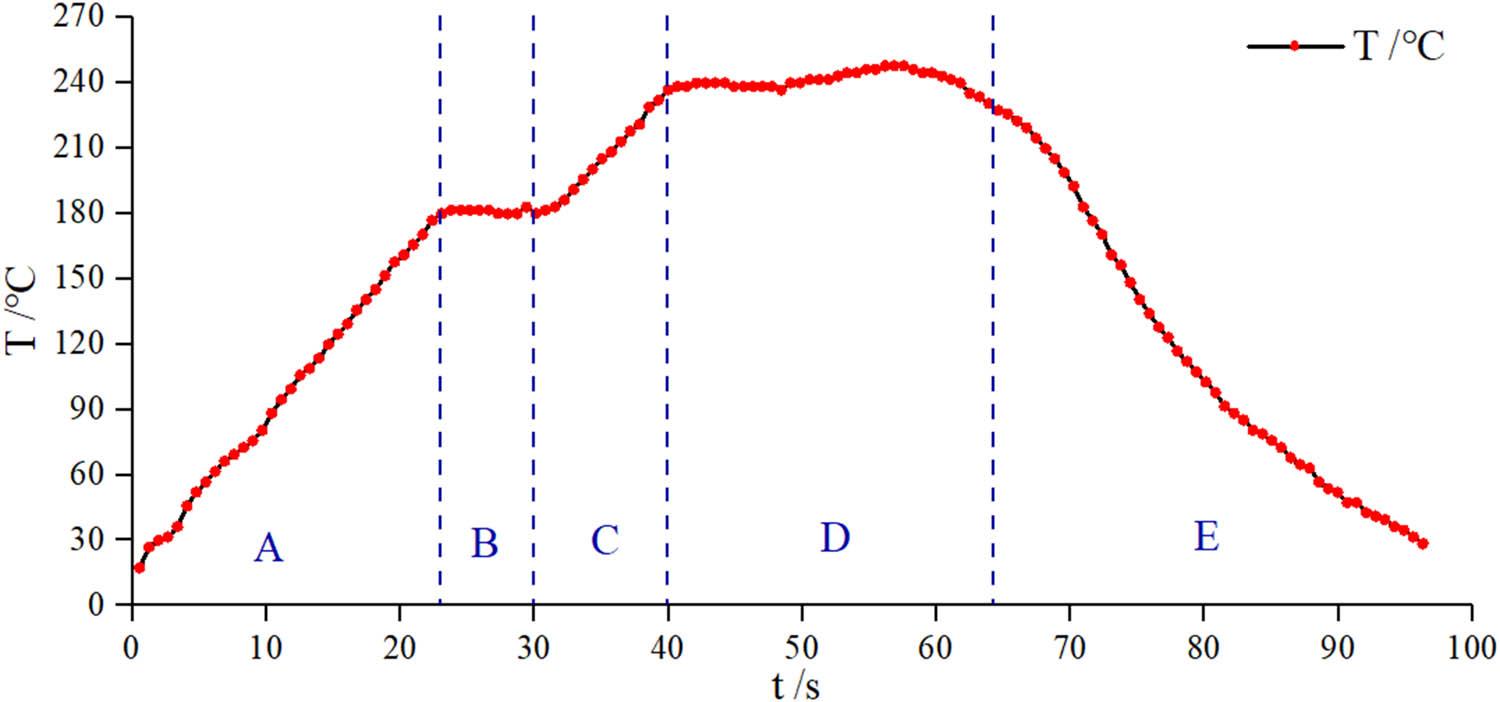
Schematic temperature diagram for each stage of FSSAM. (A) Physical friction phase of the downward pressure of the additive manufacturing tool. (B) Temperature accumulation and retention phase. (C) Plastic flow phase at the beginning of the additive plastic molding. (D) Stabilization of the molding phase of the additive materials. (E) Exit phase of the additive manufacturing tool.
First, the temperature rises significantly during the entry phase of the additive manufacturing tool (section A in Figure 14), mainly due to two factors: as the additive tool gradually cuts in, the total zone of friction between the additive tool and the additive manufacturing strip continues to increase, i.e., the contact angle θ between the additive tool and the metal continues to increase, leading to an increase in the overall heat production. The temperature gradually enters the center of the temperature measurement zone of the infrared camera, leading to an increase in the measured display value. Second, in the forming phase of stable additive manufacturing (section D in Figure 14), the frictional heat of the additive tool and the additive strip provides a stable plastic flow of the metal, and the temperature phase profile is smooth, with a horizontal or slow upward trend and a small increase in temperature. Third, in the additive tool exit stage (section E in Figure 14), the additive manufacturing process has ended and the temperature in the additive zone gradually decreases. During the travelling process of the additive tool, part of the extrusion side and additive manufacturing side on both sides of the additive tool will have a certain length of plasticized metal zone, which has different thermal conductivity with the cured metal on both sides, as shown in the temperature profile in Figure 14.
Between the additive tool entry and the stable additive manufacturing phase, there is generally a phenomenon similar to “temperature constancy” (section in Figure 14), in which the temperature profile is essentially horizontal during this time. This phenomenon is due to the fact that during the FSSAM process, the additive manufacturing tool stops and rotates for a certain period of time after reaching the plunge depth. The metal in the additive manufacturing zone around the additive tool has softened significantly during the previous additive tool cut-in stage, which leads to a lower coefficient of friction between the additive tool and the additive zone. The softened metal does not generate a lot of frictional heat by continuing strong frictional interaction with the additive tool, so the temperature in the additive zone rises slowly, and even a downward trend is observed along with an increase in the stopping time. This is due to less frictional heat generation, but the heat transfer between the inside of the additive manufacturing zone and the fixture and between the additive manufacturing mechanism and the environment does not stop, accompanied by the transfer of heat between the FSSAM mechanism, which will result in a decrease in the temperature of the temperature measurement zone.
Subsequently, the additive tool starts to continue feeding, at which point the temperature rises again (section C in Figure 14) gradually reaching the steady-state temperature of FSSAM additive manufacturing. The reason for the rise in temperature at this stage is due to the friction between the additive tool and the unsoftened additive strips in the additive zone as it feeds, at which point the coefficient of friction increases, so the temperature rises again.
In this study, MAM was carried out by the FSSAM technique using BYJ-X53K general vertical milling machine and 6156 aluminum alloy sheet. SEM, Vickers hardness, optical microscopy, tensile, and thermomechanical tests were carried out for the microstructure, and mechanical properties of the FSSAM were characterized. The main conclusions are summarized as follows:
-
(1)
The additive tool traverse speed, rotational speed, and plunge manufacturing depth will significantly affect the size of the hook tip in the additive zone, when the plunge depth is constant, the hook tip size can be reduced by increasing the rotational speed and reducing the traverse speed. When the inhibition of vertical plastic flow by down pressure is greater than the promotion of heat input, the hook tip size increases, and on the contrary, the hook tip size decreases.
-
(2)
The traverse speed of the FSSAM tool significantly affects tensile properties, reaching a maximum value of 273.62 MPa at 37.5 mm/min. When the traverse speed was 23.5 mm/min, the tensile strength of the sample decreased, while elongation abnormally increased to 12.7%.
-
(3)
FSSAM at a rotational speed of 950 rpm, a moving speed of 37.5 mm/min, and the plunge depth of 2.60 mm obtained a better additive manufacturing surface and a smaller inner hook size. At this time, the FSSAM additive manufacturing sample has the best overall mechanical properties.
-
(4)
The heat input formula of FSSAM is summarized, and the calculated value is close to the experimental value, which lays a certain theoretical foundation for the subsequent related research.
Authors state no funding involved.
Conceptualization: Chaowei Sun; methodology: Chaowei Sun, Hai Zhu; formal analysis and investigation: Chaowei Sun, Hai Zhu; writing-original draft preparation: Chaowei Sun; writing-review and editing: Chaowei Sun, Danfeng Du; funding acquisition: Hai Zhu; resources: Chaowei Sun; supervision: Danfeng Du.
There is no conflict of interest among the authors.
Data sharing is not applicable for this study.