
Figure 1
Figure 2
Figure 3
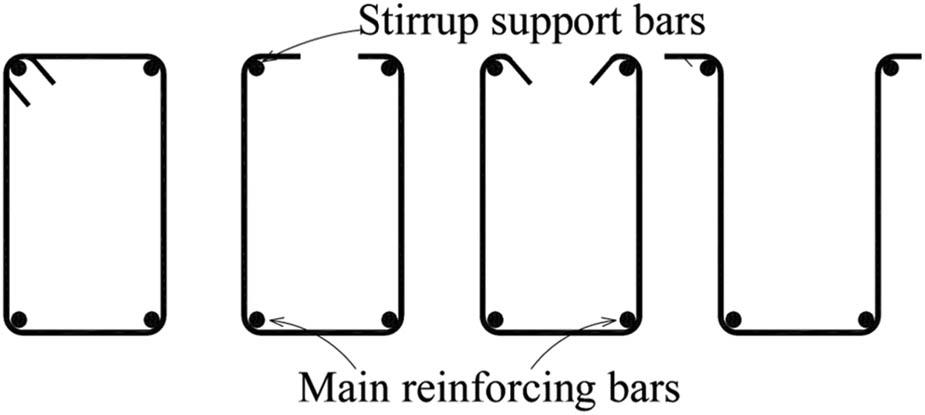
Figure 4
Figure 5
Figure 6
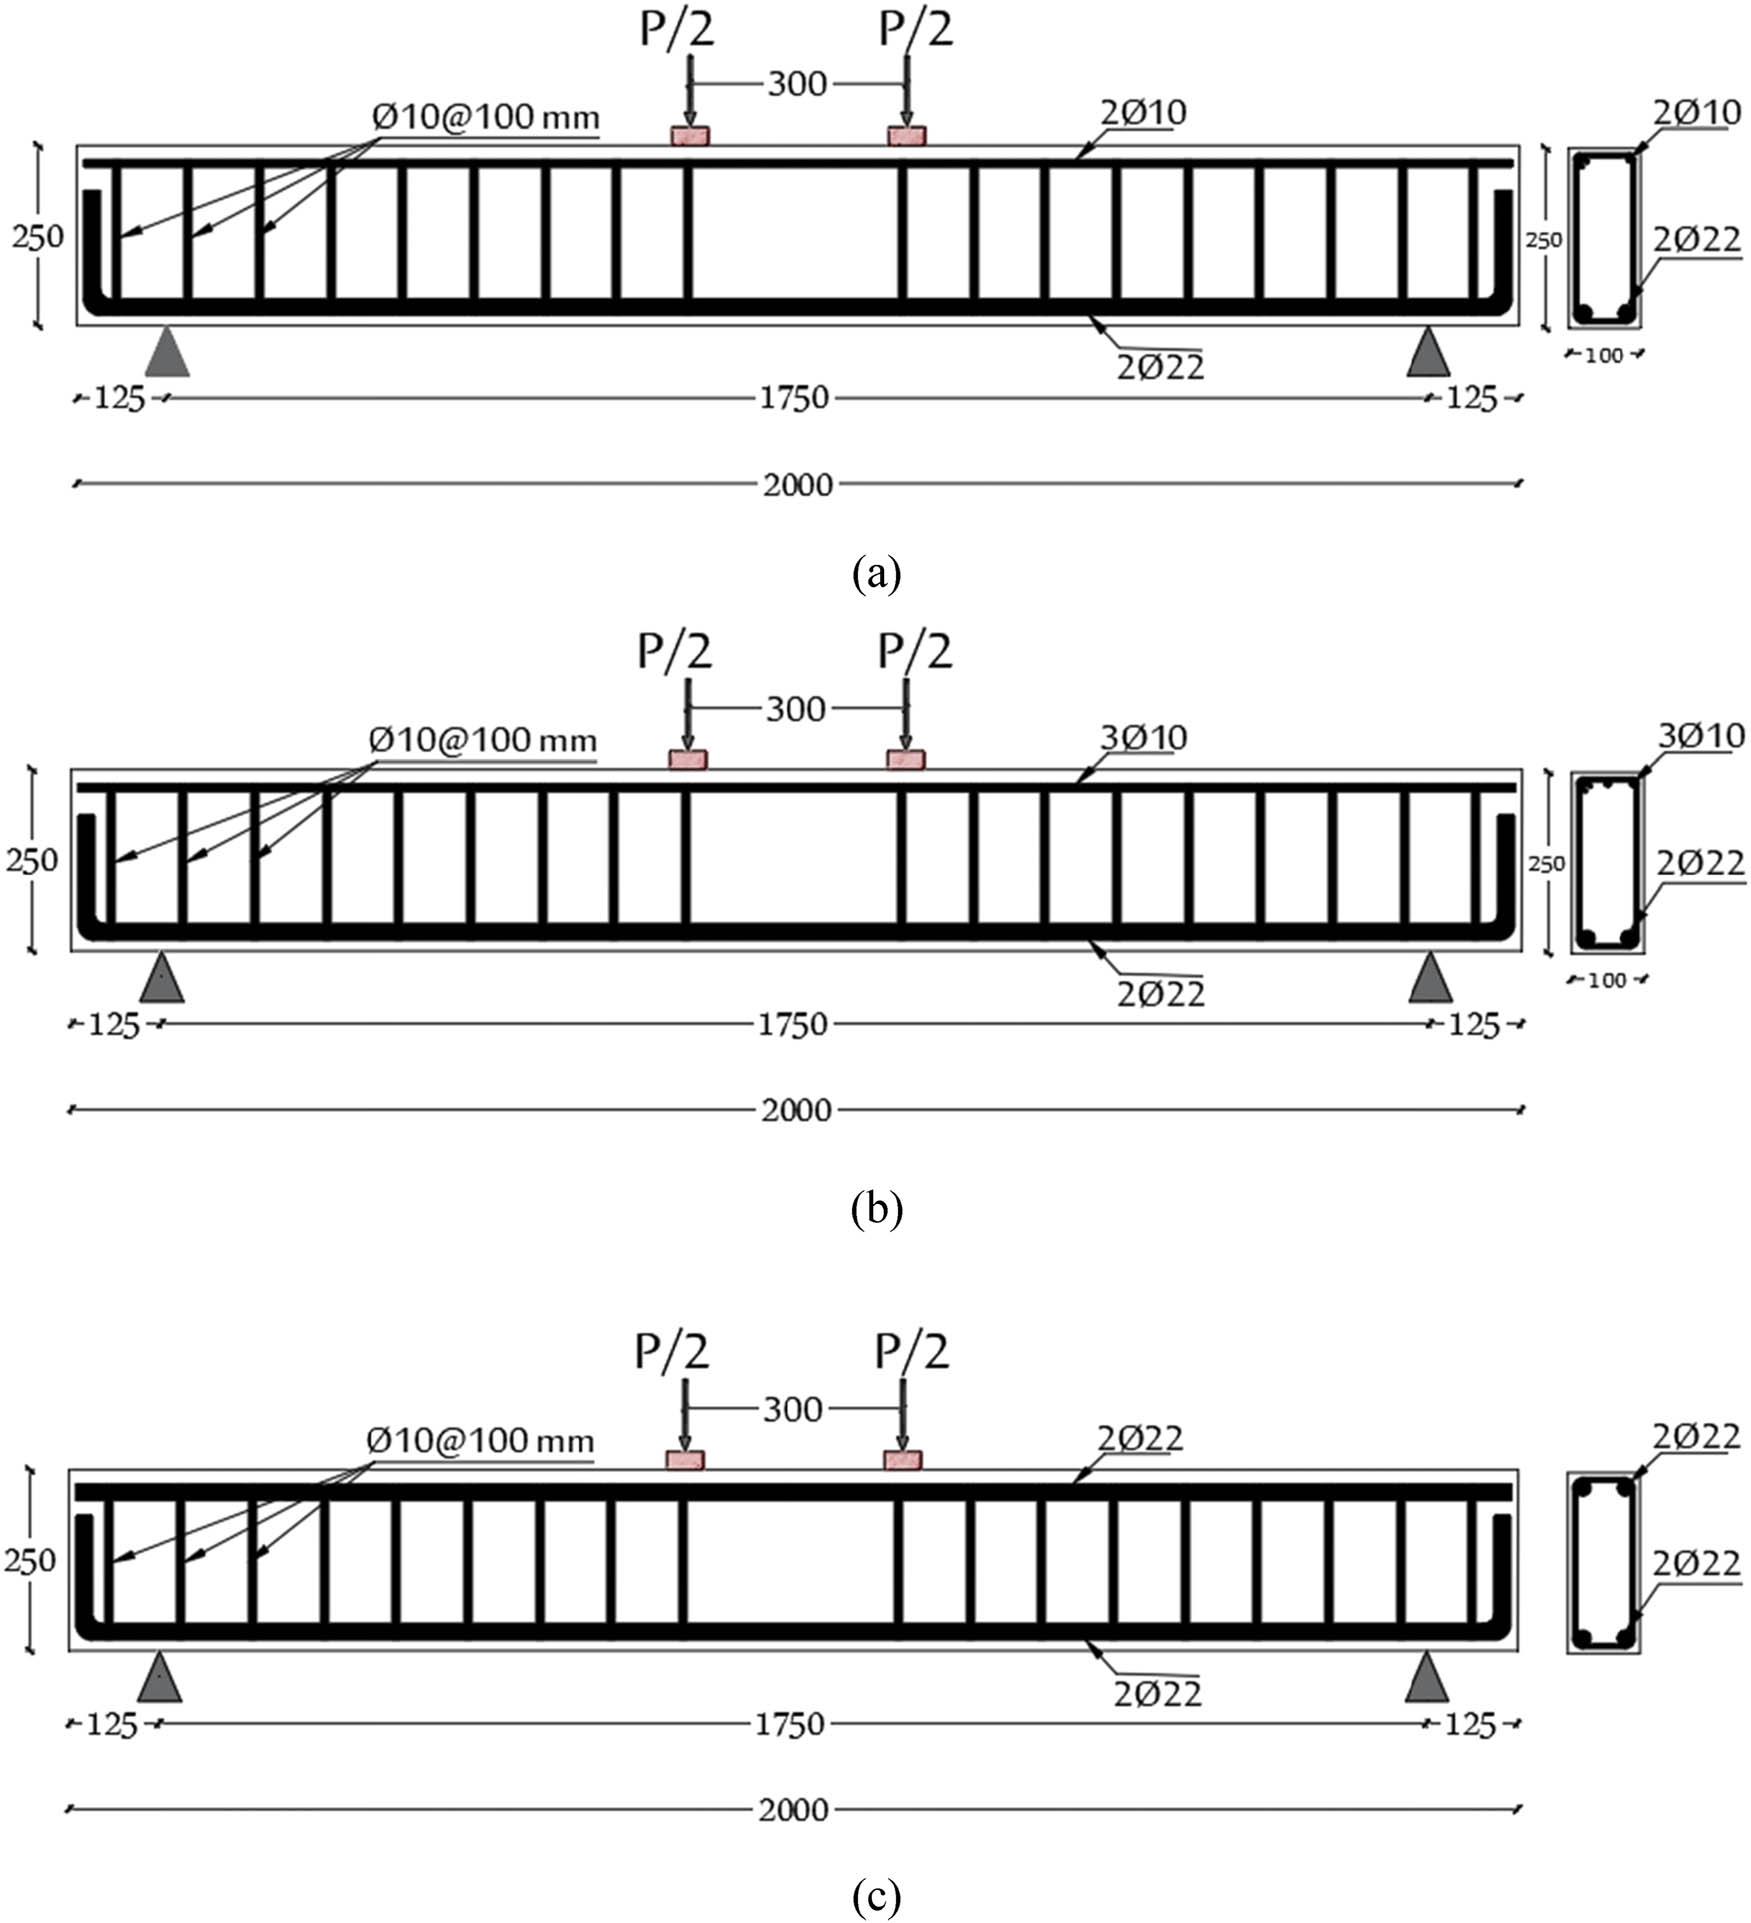
Figure 7
Figure 8
Figure 9
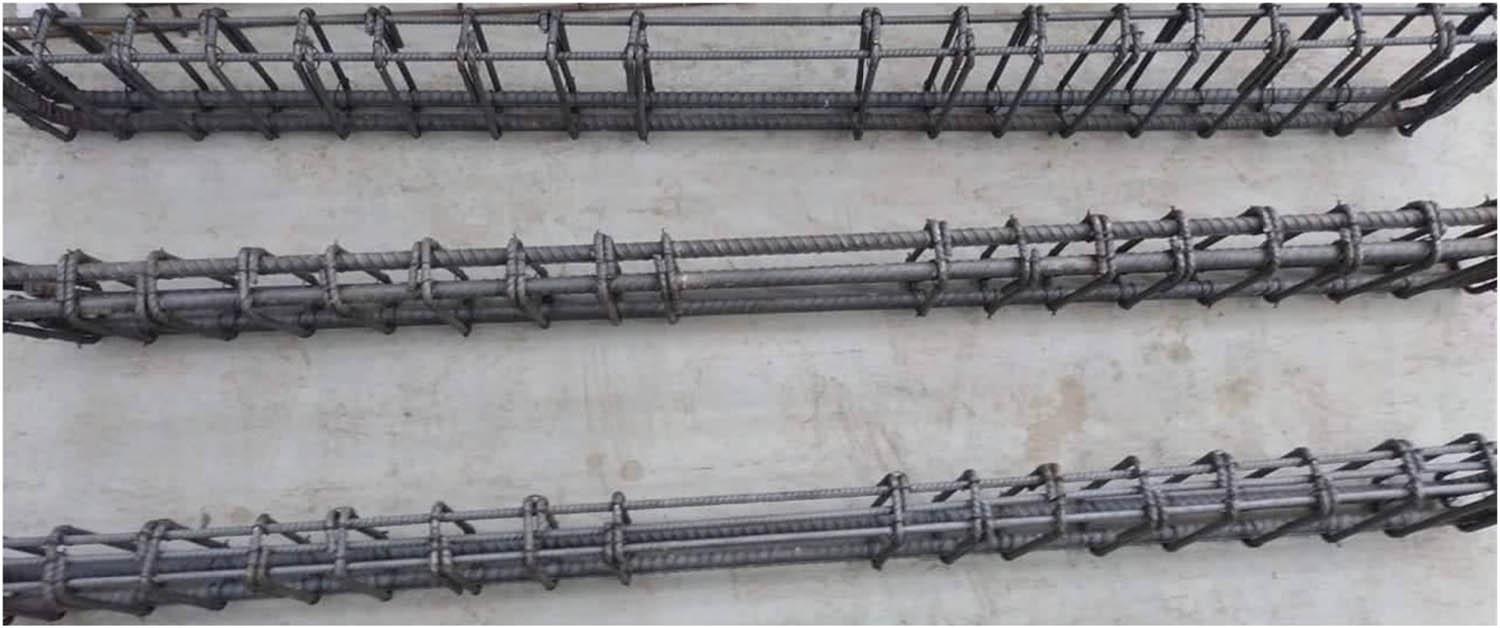
Figure 10
Figure 11
Figure 12
Figure 13
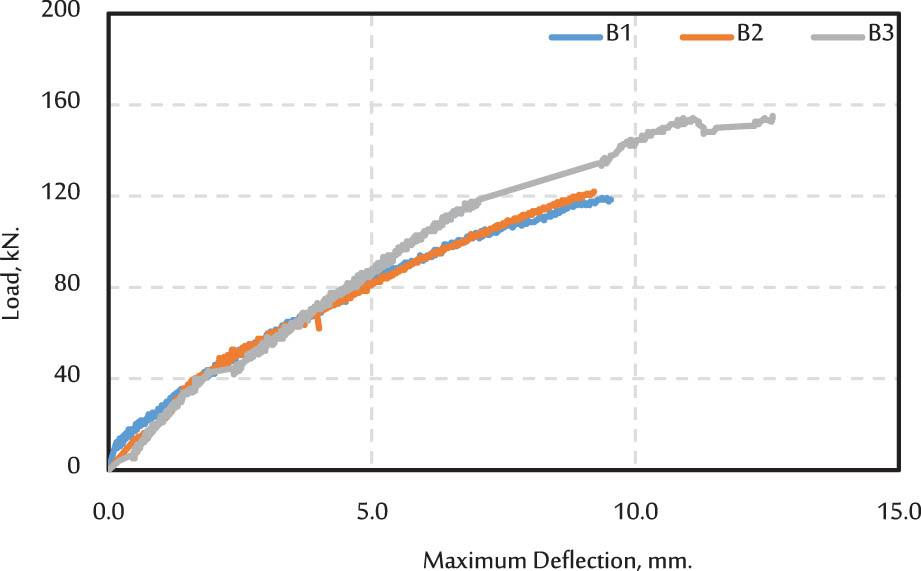
Figure 14
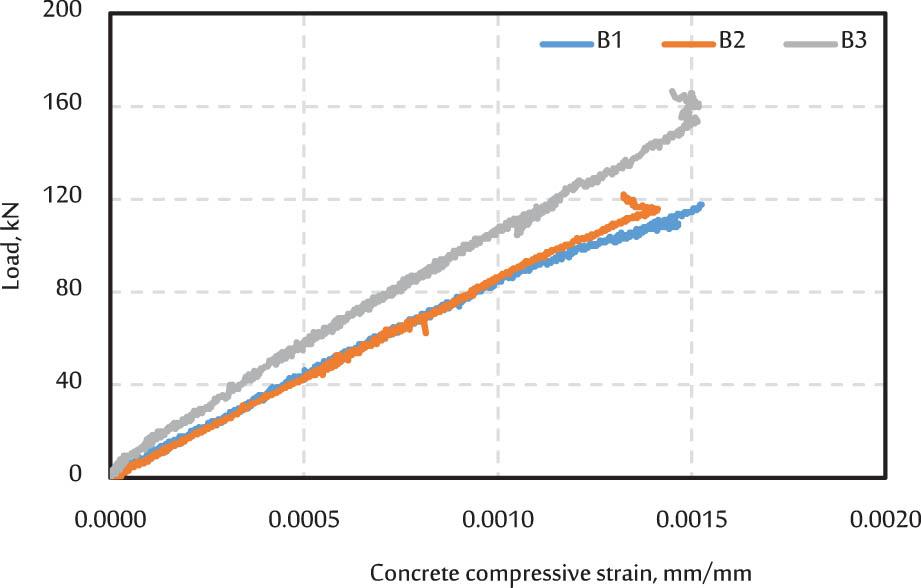
Figure 15
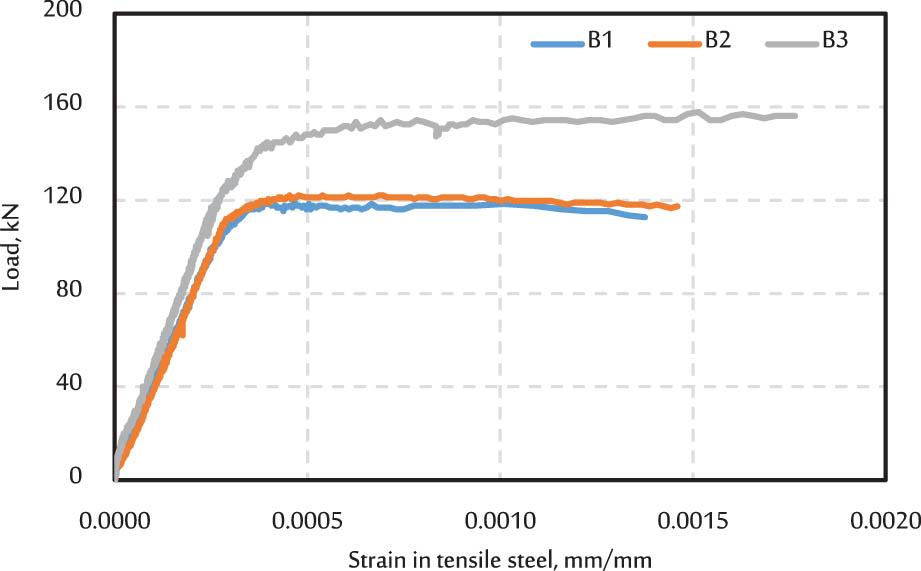
Figure 16
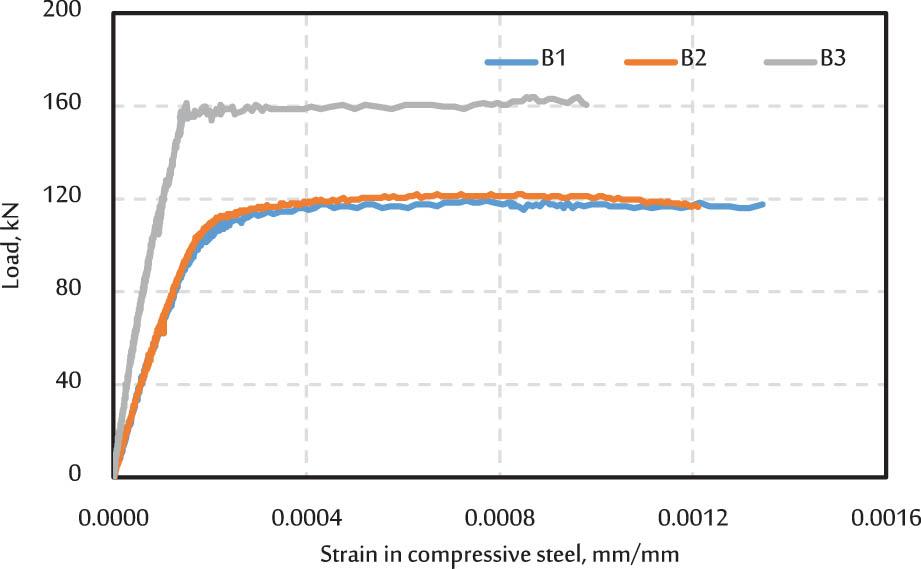
Figure 17
Figure 18
Figure 19
Figure 20
Compression steel in the tested beams_
| Beam ID |
|
|
| Details |
|---|---|---|---|---|
| B1 | 2Ø22 | 2Ø10 | 0.2 | Figure 6(a) |
| B2 | 2Ø22 | 3Ø10 | 0.3 | Figure 6(b) |
| B3 | 2Ø22 | 2Ø22 | 1.0 | Figure 6(c) |
Concrete mix proportion (m3)_
| Cement | Dolomite | Sand | Water | Admixture |
|---|---|---|---|---|
| 350 kg | 1,292 kg | 646 kg | 175 L | 5.4 kg |
Comparison of experimental and proposed method results_
| Point of comparison | B1 beam | B2 beam | B3 beam | ||||||
|---|---|---|---|---|---|---|---|---|---|
| Experimental | Analytical | % | Experimental | Analytical | % | Experimental | Analytical | % | |
| Failure load (kN) | 118.4 | 105.9 | +11.8% | 122.0 | 111.1 | +9.8% | 166.0 | 150.2 | +10.5% |
| Nominal moment strength* (kN m) | 42.92 | 38.39 | +11.8% | 44.23 | 40.27 | +9.8% | 60.18 | 54.45 | +10.5% |
| Concrete compressive strain at failure | 0.001526 | 0.001507 | +1.3% | 0.001413 | 0.001507 | −6.2% | 0.001518 | 0.001507 | +0.7% |
| Strain in tension steel at failure | 0.001376 | 0.001365 | +0.8% | 0.001460 | 0.001446 | +1.0% | 0.001765 | 0.001729 | +2.1% |
| Strain in compressive steel at failure | 0.001344 | 0.001330 | +1.1% | 0.001211 | 0.001194 | +1.4% | 0.000979 | 0.001054 | −7.1% |