Figure 1
Figure 2
Figure 3
Figure 4
Figure 5
Figure 6
Figure 7
Figure 8
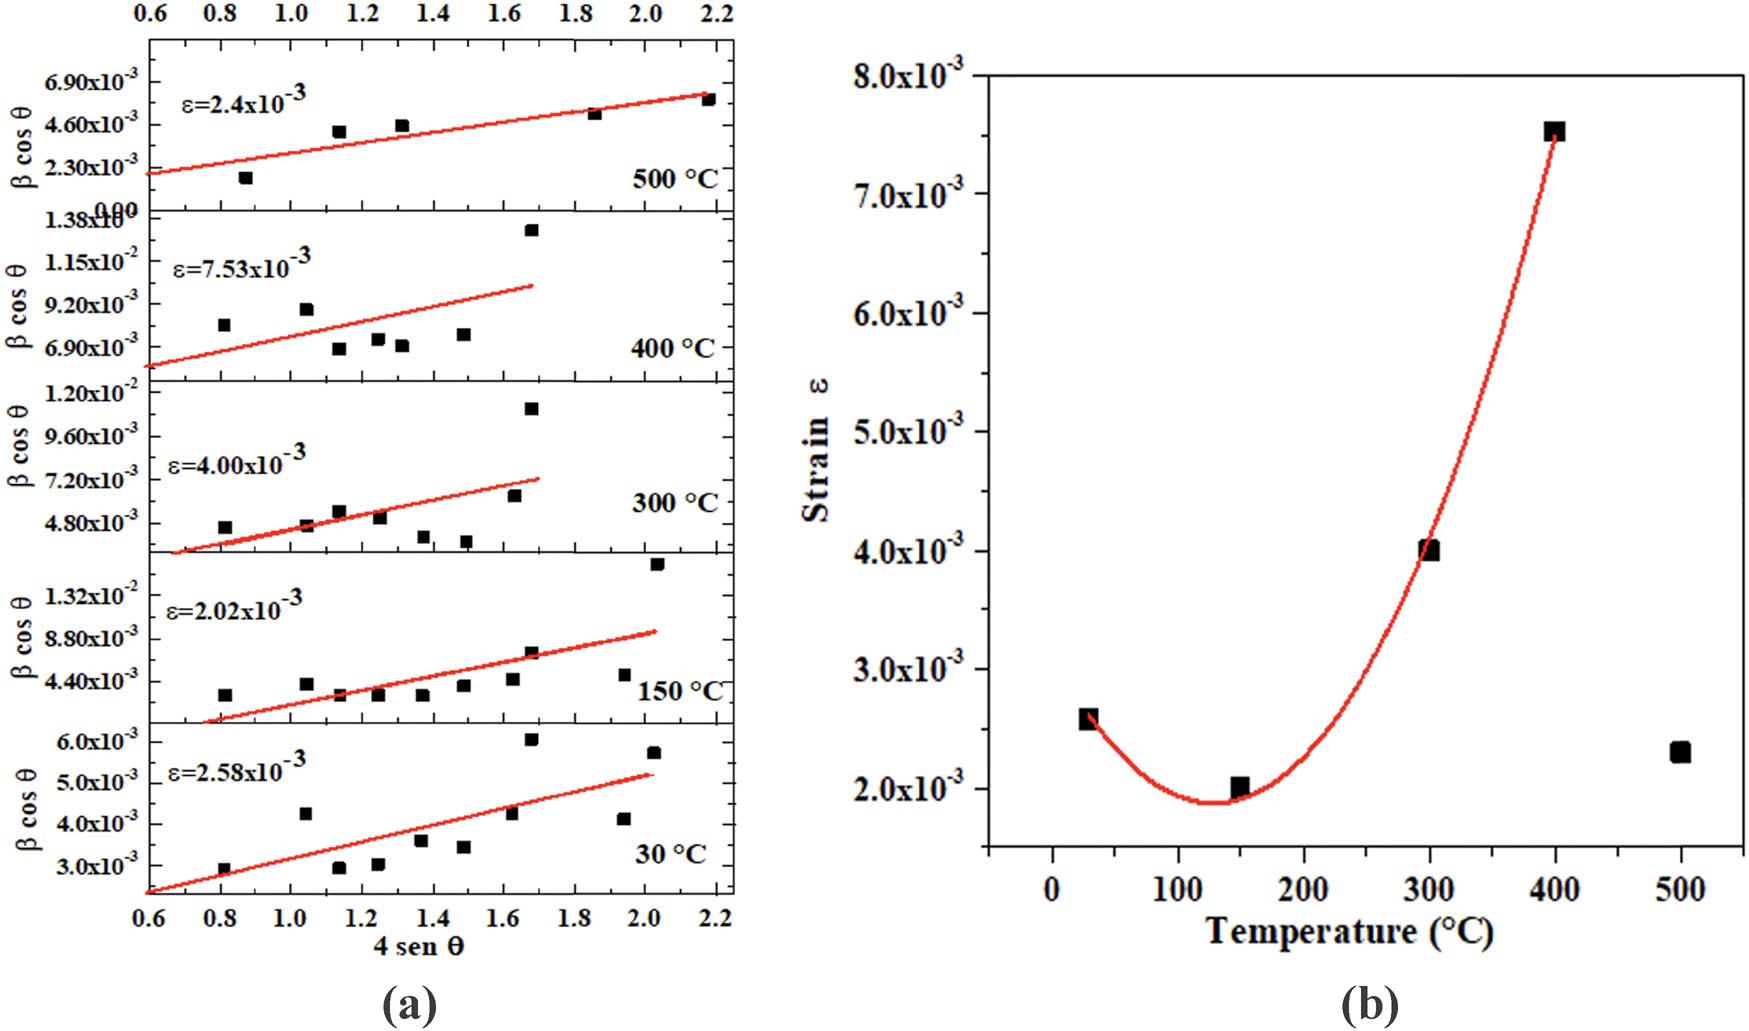
Figure 9
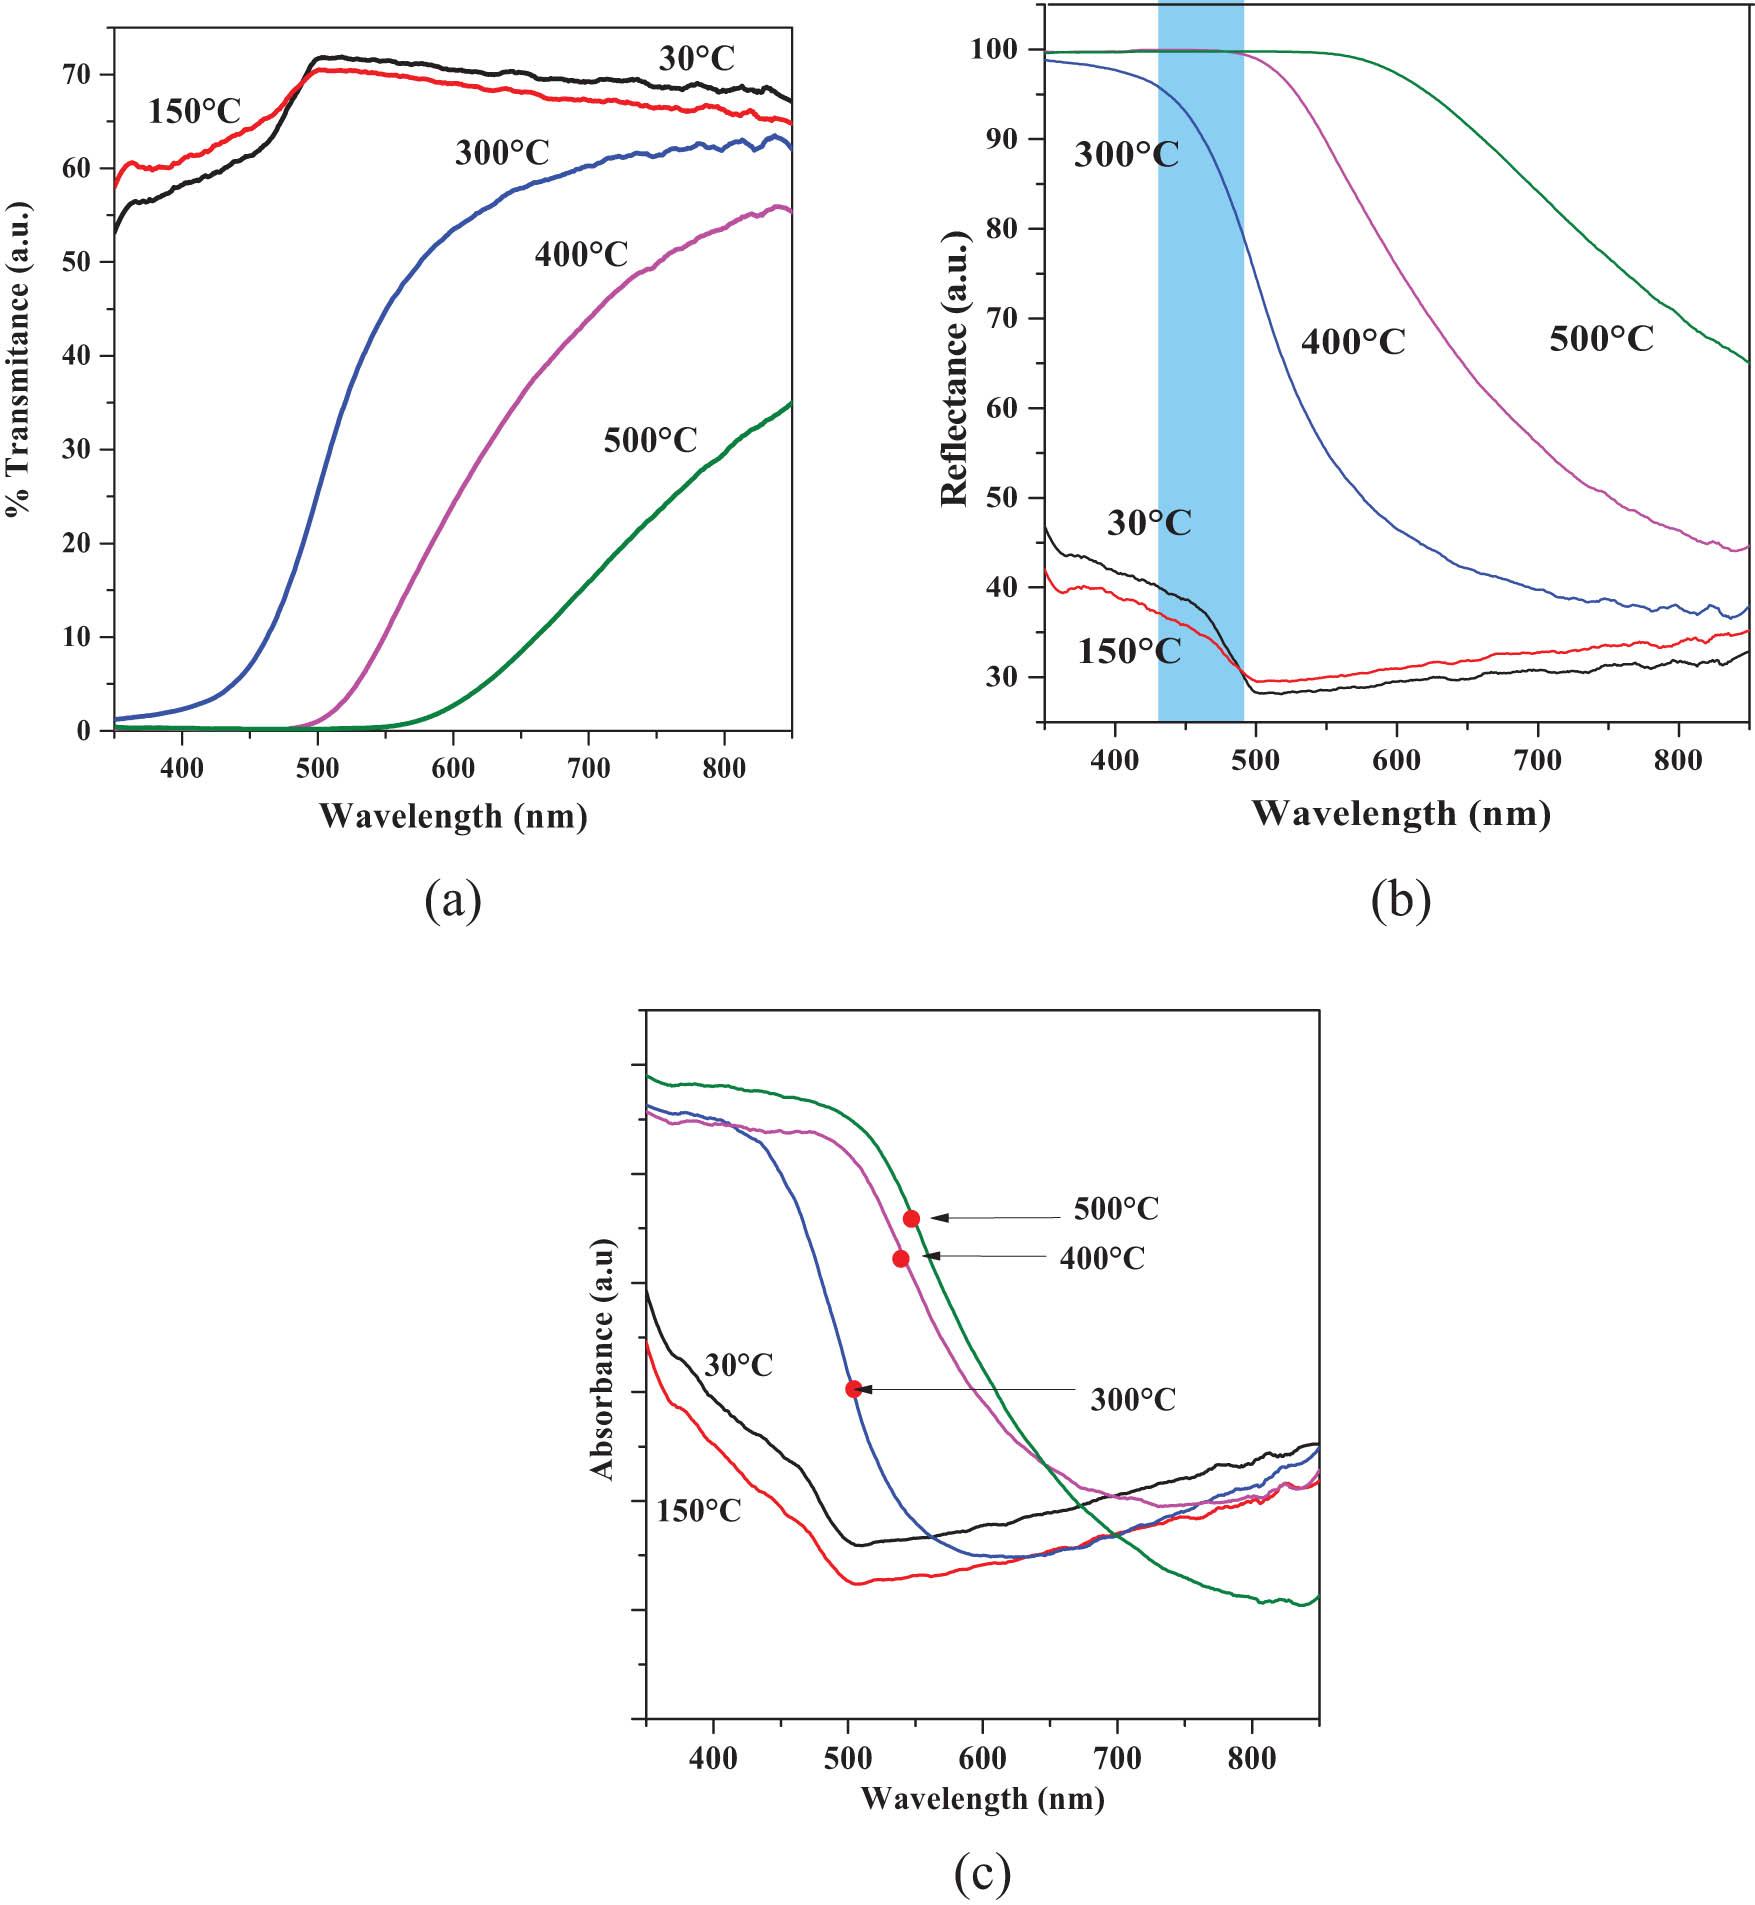
Figure 10
Figure 11
Figure 12
Figure 13
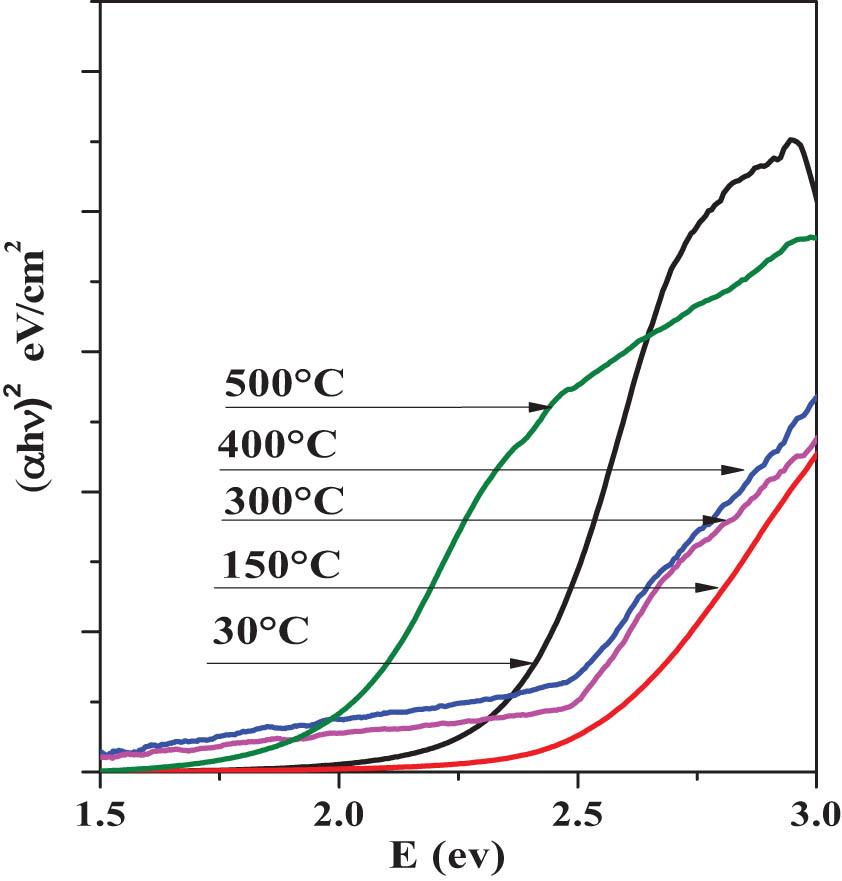
Figure 14
Figure 15
Figure 16
Figure 17
Experimental values for the bandgap energy (E g) of the 30°C, 150°C, 300°C, 400°C, and 500°C samples
| Temperature (°C) | E g (eV) |
|---|---|
| 30 | 2.37 |
| 150 | 2.31 |
| 300 | 2.17 |
| 400 | 2.06 |
| 500 | 1.87 |
Lattice parameters a and c, microstrain, and dislocation density (δ) of the 30°C, 150°C, 300°C, 400°C, and 500°C thin films_
| Sample (°C) | a (Å) | c (Å) | Microstrain | Dislocation density γ (lines/m2) |
|---|---|---|---|---|
| 30 | 4.947 | 16.263 | 1.144 × 10⁻⁴ | 3.8 × 10¹⁴ |
| 150 | 4.940 | 16.231 | 1.173 × 10⁻⁴ | 4.39 × 10¹⁴ |
| 300 | 4.9231 | 16.292 | 1.19 × 10⁻⁴ | 7.08 × 10¹⁴ |
| 400 | 4.9469 | 16.266 | 3.92 × 10⁻⁴ | 2.01 × 10¹⁴ |
| 500 | 4.9489 | 16.247 | 2.69 × 10⁻⁴ | 6.30 × 10¹⁴ |