Figure 1
Figure 2
Figure 3
Figure 4
Figure 5
Figure 6
Figure 7
Figure 8
Figure 9
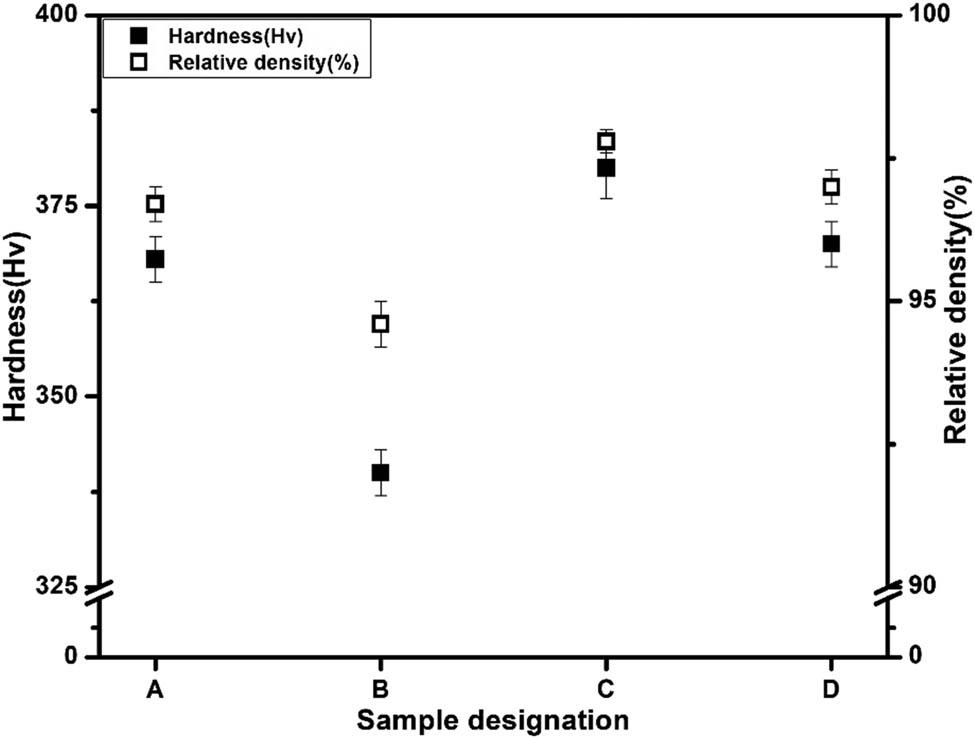
Figure 10
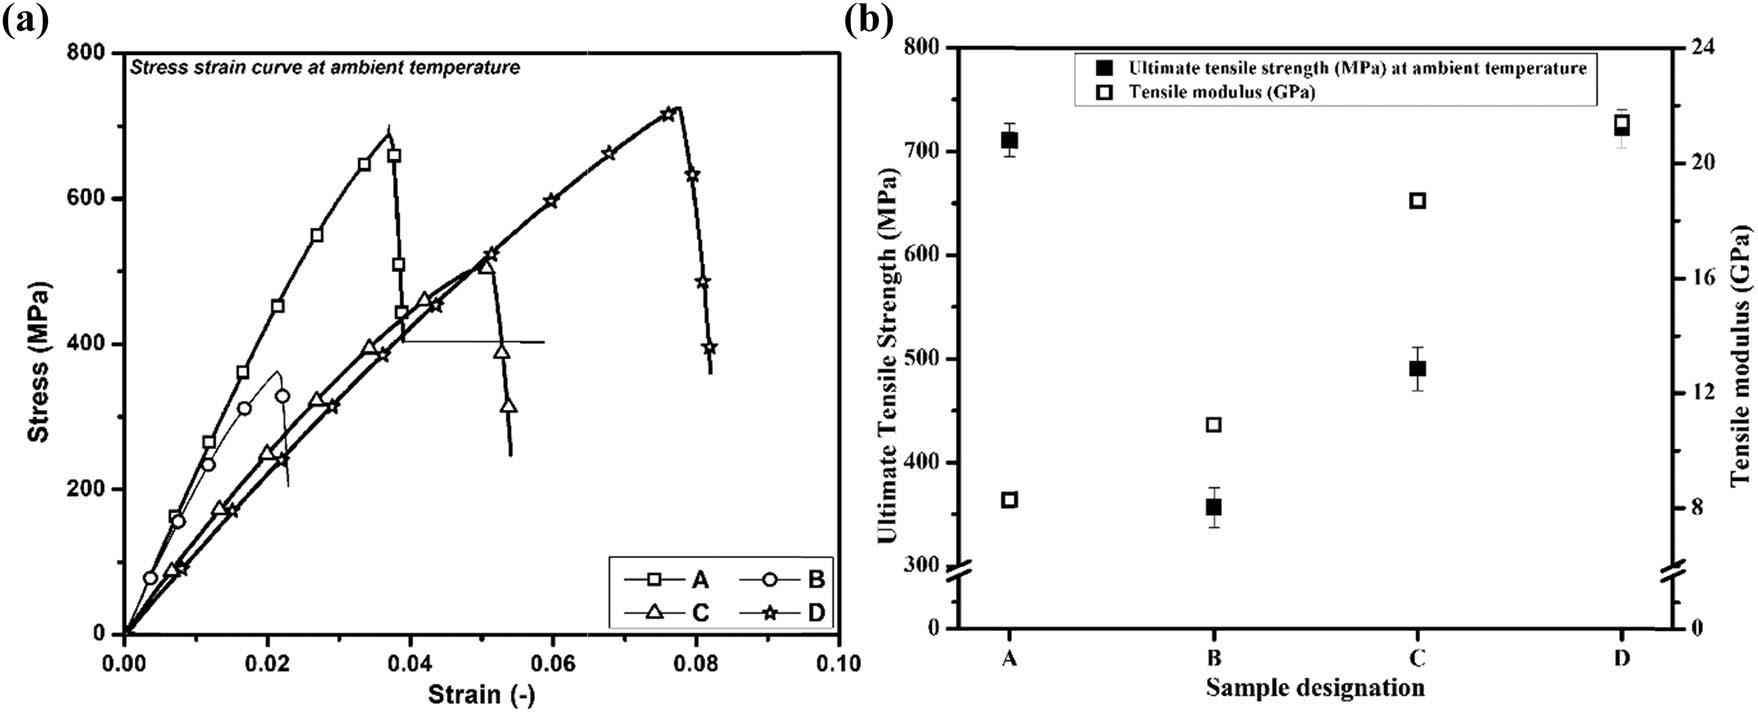
Figure 11
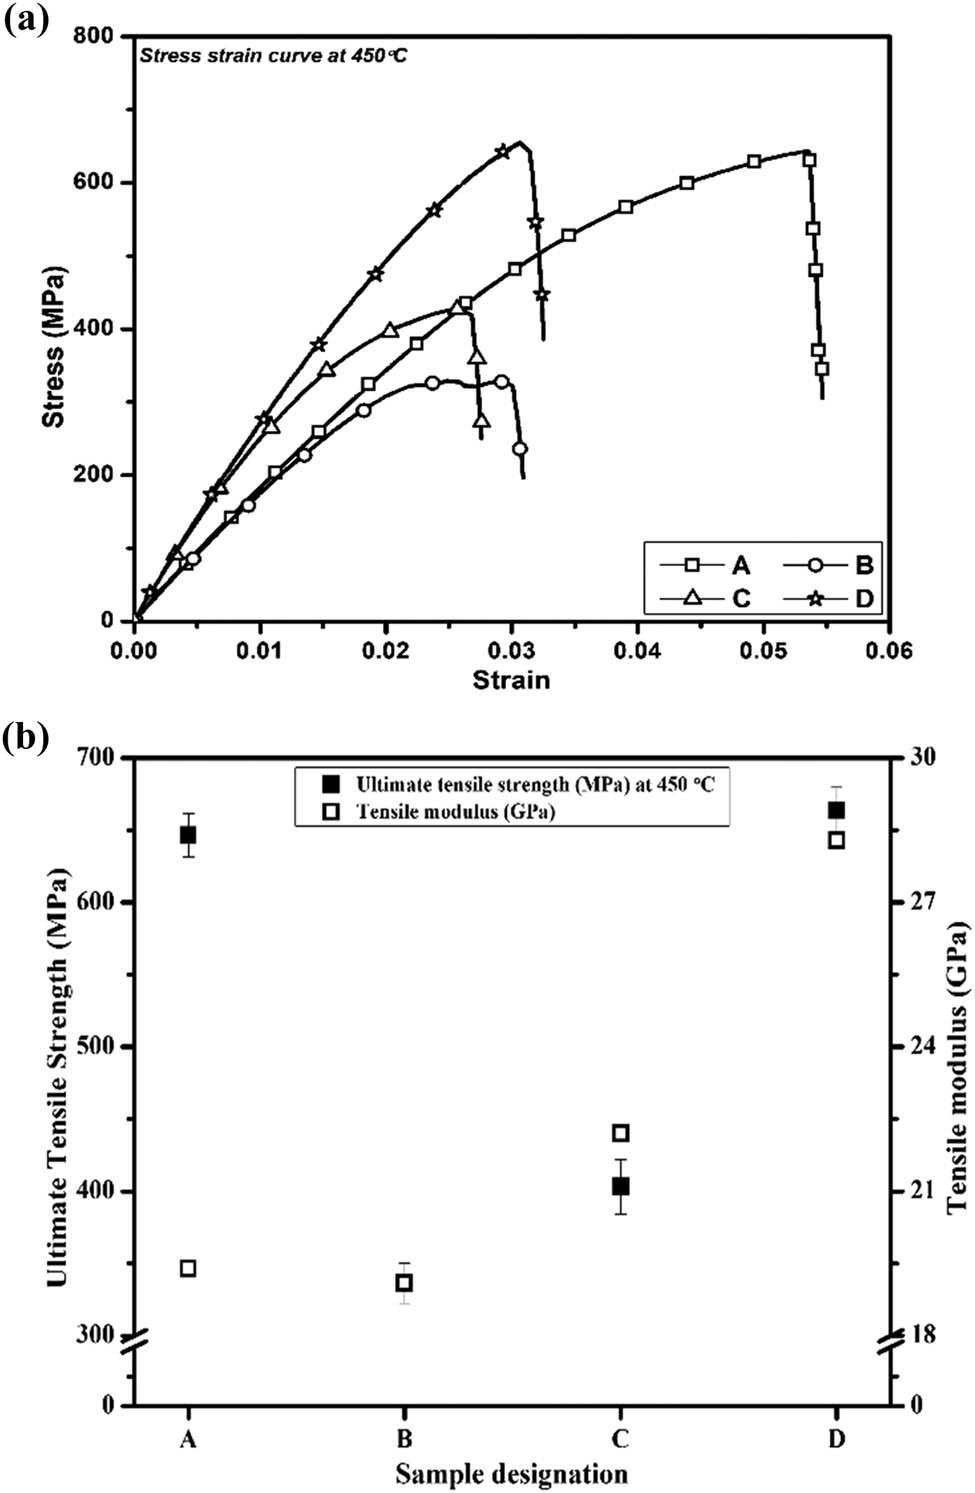
Figure 12
Processing parameters for sintering the composites_
| Sintering details | ||||
|---|---|---|---|---|
| Alloy/composites (wt%) | Temperature (°C) | Pressure (MPa) | Heating rate (°C/min) | Wetting time (min) |
| 45% Inconel, 10% WC, 33% Co, and 12% Gr | 950 | 40 | 100 | 5 |
| 33% Inconel, 10% WC, 45% Co, and 12% Gr | 1,000 | 45 | 100 | 5 |
| 90 wt% Inconel, 4 wt% WC, 5 wt% Co, and 1 wt% Gr | 1,050 | 50 | 100 | 5 |
Trials of micro tensile test on specimens A, B, C, and D_ Bold value significantly shows the Specimen D tensile stress is maximum_
| Specimen | Maximum tensile stress at ambient temperature (MPa) | Maximum tensile stress at 450°C temperature (MPa) | ||||||
|---|---|---|---|---|---|---|---|---|
| Trial 1 | Trial 2 | Trial 3 | Average | Trial 1 | Trial 2 | Trial 3 | Average | |
| A | 741 | 701 | 689.7 | 710.6 | 674.5 | 640.9 | 624 | 646.5 |
| B | 336.3 | 346 | 386 | 356.1 | 362.3 | 336 | 311 | 336.4 |
| C | 496.3 | 463 | 511 | 490.1 | 425.3 | 384.2 | 399.8 | 403.1 |
| D | 763.4 | 673.4 | 729.8 | 722.2 | 691.1 | 611.2 | 688.7 | 663.6 |
Micro-hardness and relative density percentages of sintered composites_
| Notation of specimen | Hardness (HV) | Relative density (%) |
|---|---|---|
| A | 368 ± 3 | 96.7 ± 0.3 |
| B | 340 ± 3 | 94.6 ± 0.4 |
| C | 380 ± 4 | 97.8 ± 0.2 |
| D | 370 ± 3 | 97.0 ± 0.3 |